Home > Comparison > Technology > CSCO vs FTNT
The strategic rivalry between Cisco Systems, Inc. and Fortinet, Inc. shapes the trajectory of the cybersecurity and networking technology sector. Cisco operates as a capital-intensive leader in communication equipment, delivering broad infrastructure solutions worldwide. Fortinet, a software infrastructure innovator, focuses on integrated, automated cybersecurity services. This analysis pits established scale against agile specialization to identify which company offers superior risk-adjusted potential for a diversified portfolio.
Table of contents
Companies Overview
Cisco Systems, Inc. and Fortinet, Inc. are key players shaping technology infrastructure and cybersecurity markets.
Cisco Systems, Inc.: Networking Giant with Diverse Connectivity Solutions
Cisco dominates the communication equipment sector by designing and selling Internet Protocol-based networking products. Its revenue stems from campus and data center switching, enterprise routing, and wireless products. In 2026, Cisco focuses on expanding its security and collaboration offerings, blending cloud, on-premise, and hybrid deployments to enhance enterprise connectivity and digital transformation.
Fortinet, Inc.: Cybersecurity Innovator with Integrated Defense
Fortinet leads in software infrastructure by delivering broad, automated cybersecurity solutions. Its core revenue comes from FortiGate hardware and software licenses providing firewall, intrusion prevention, and multi-factor authentication. In 2026, Fortinet prioritizes integrating endpoint protection and network security services, targeting diverse industries with scalable, centralized management and proactive threat detection.
Strategic Collision: Similarities & Divergences
Cisco and Fortinet share a commitment to security and network reliability but differ in approach. Cisco leans on a hybrid ecosystem combining hardware and cloud collaboration, while Fortinet pursues a tightly integrated cybersecurity platform. Their primary battleground is enterprise network security. Cisco offers broad infrastructure solutions; Fortinet focuses on specialized threat defense, creating distinct risk and growth profiles for investors.
Income Statement Comparison
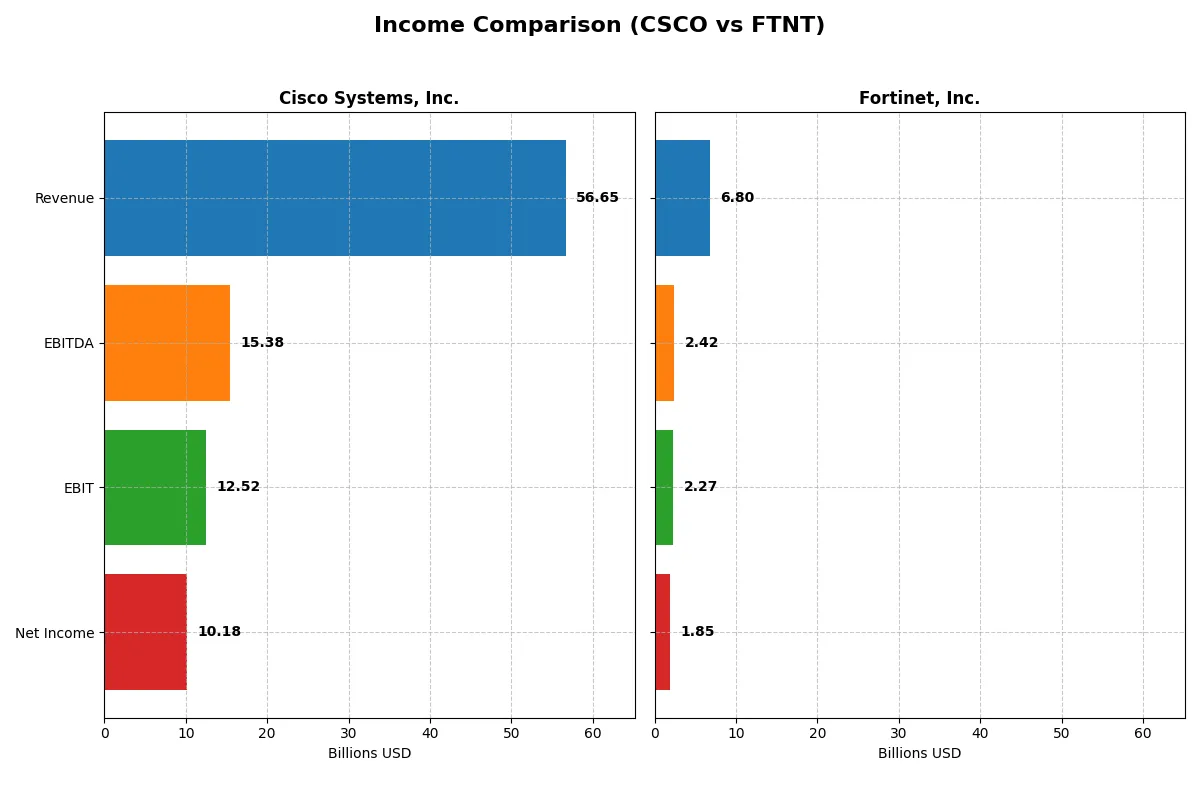
This data dissects the core profitability and scalability of both corporate engines to reveal who dominates the bottom line:
| Metric | Cisco Systems, Inc. (CSCO) | Fortinet, Inc. (FTNT) |
|---|---|---|
| Revenue | 56.7B | 6.8B |
| Cost of Revenue | 19.9B | 1.3B |
| Operating Expenses | 25.0B | 3.4B |
| Gross Profit | 36.8B | 5.5B |
| EBITDA | 15.4B | 2.4B |
| EBIT | 12.5B | 2.3B |
| Interest Expense | 1.6B | 20M |
| Net Income | 10.2B | 1.9B |
| EPS | 2.56 | 2.44 |
| Fiscal Year | 2025 | 2025 |
Income Statement Analysis: The Bottom-Line Duel
The following income statement comparison reveals which company operates its business with superior efficiency and profitability in 2025.
Cisco Systems, Inc. Analysis
Cisco’s revenue grew modestly by 5.3% in 2025, reaching $56.7B, but net income declined 1.4% to $10.2B, reflecting margin pressure. Gross margin remains strong at 64.9%, yet net margin slipped to 18.0%. Operating expenses grew proportionally, eroding EBIT by 5.5%, signaling caution on operational efficiency despite stable EPS.
Fortinet, Inc. Analysis
Fortinet posted robust 14.2% revenue growth to $6.8B in 2025, with net income rising 6.2% to $1.85B. Its gross margin impresses at 80.8%, and net margin holds at a healthy 27.3%. EBIT expanded 9.3%, driven by disciplined expense growth. EPS surged 7.5%, underscoring strong momentum and operational leverage in a high-growth environment.
Verdict: Margin Excellence vs. Scale Stability
Fortinet outperforms Cisco in both revenue and net income growth, boasting superior margins and EPS momentum. Cisco’s massive scale delivers steady top-line gains but struggles with margin contraction and earnings pressure. Investors seeking growth and margin expansion may favor Fortinet’s profile, while Cisco appeals more to those prioritizing established scale and stability.
Financial Ratios Comparison
These vital ratios act as a diagnostic tool to expose the underlying fiscal health, valuation premiums, and capital efficiency of the companies compared below:
| Ratios | Cisco Systems, Inc. (CSCO) | Fortinet, Inc. (FTNT) |
|---|---|---|
| ROE | 21.7% | 149.8% |
| ROIC | 11.6% | 28.8% |
| P/E | 26.8 | 32.5 |
| P/B | 5.83 | 48.64 |
| Current Ratio | 1.00 | 1.17 |
| Quick Ratio | 0.91 | 1.09 |
| D/E | 0.63 | 0.81 |
| Debt-to-Assets | 24.2% | 9.6% |
| Interest Coverage | 7.38 | 103.7 |
| Asset Turnover | 0.46 | 0.65 |
| Fixed Asset Turnover | 16.59 | 4.20 |
| Payout ratio | 63.2% | 0% |
| Dividend yield | 2.36% | 0% |
| Fiscal Year | 2025 | 2025 |
Efficiency & Valuation Duel: The Vital Signs
Financial ratios act as a company’s DNA, exposing hidden risks and operational strengths that shape investor confidence and valuation clarity.
Cisco Systems, Inc.
Cisco delivers robust profitability with a 21.7% ROE and a solid 18% net margin, signaling operational efficiency. However, its valuation appears stretched, with a 26.8 P/E and 5.8 P/B, above typical sector averages. Cisco rewards shareholders through a 2.36% dividend yield, balancing growth with steady income.
Fortinet, Inc.
Fortinet demonstrates exceptional profitability, boasting a 149.8% ROE and a 27.3% net margin, which highlights superior capital efficiency. Its valuation is expensive, with a 32.5 P/E and a sky-high 48.6 P/B ratio. Fortinet reinvests aggressively, eschewing dividends for growth and innovation, aiming to sustain its market leadership.
Premium Valuation vs. Operational Safety
Cisco offers a more balanced risk-reward profile with consistent profitability and shareholder returns despite a stretched valuation. Fortinet excels in returns but trades at a premium with no dividend cushion. Cisco suits cautious investors; Fortinet appeals to growth-focused investors willing to pay for high performance.
Which one offers the Superior Shareholder Reward?
I observe Cisco Systems, Inc. (CSCO) pays a steady dividend with a yield around 2.35% to 3.26% and a payout ratio near 62–63%, well covered by free cash flow. Its buyback program is consistent but moderate, supporting shareholder returns without straining cash flow. Fortinet, Inc. (FTNT) forgoes dividends entirely, reinvesting heavily in growth and R&D, reflected in its higher operating margins and cash flow reinvestment. FTNT’s buybacks are minimal or absent, prioritizing capital for expansion over immediate shareholder distributions. Historically in tech, a balanced distribution model like Cisco’s tends to sustain long-term value better in mature markets, while Fortinet’s aggressive reinvestment suits growth investors but carries higher risk. For 2026, I find Cisco offers a more attractive total return profile due to its reliable dividends combined with prudent buybacks, delivering both income and capital appreciation potential.
Comparative Score Analysis: The Strategic Profile
The radar chart reveals the fundamental DNA and trade-offs of Cisco Systems, Inc. and Fortinet, Inc., highlighting their distinct financial strengths and weaknesses:
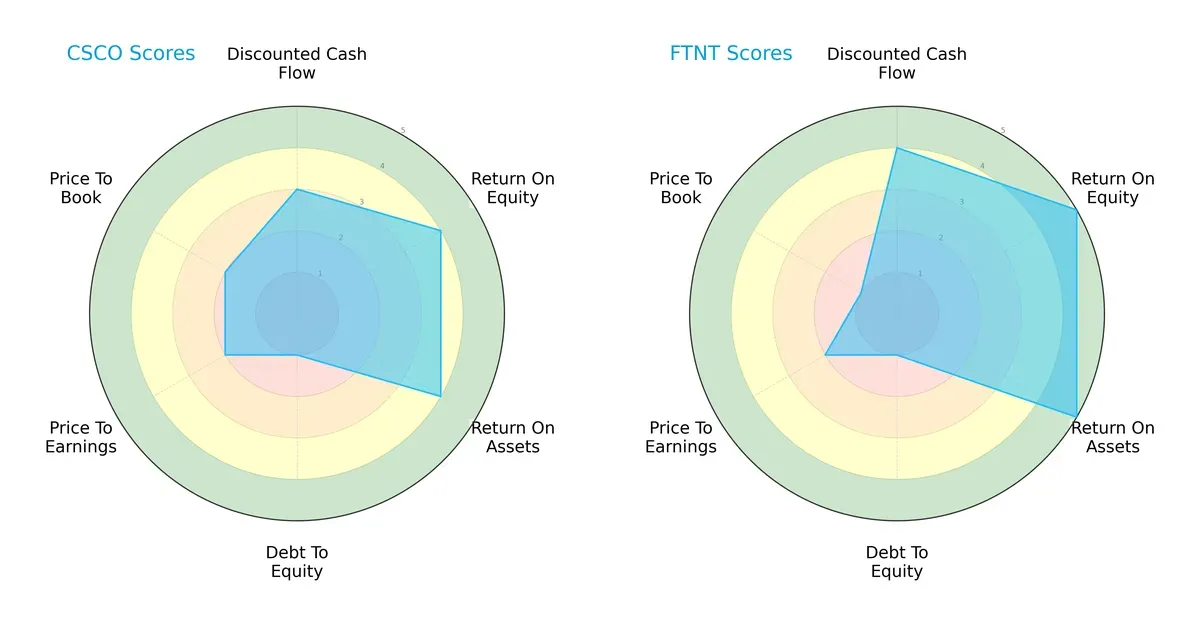
Fortinet excels in profitability with higher ROE (5 vs. 4) and ROA (5 vs. 4) scores, reflecting superior asset and equity efficiency. It also leads in discounted cash flow (4 vs. 3), indicating stronger future cash flow prospects. Cisco shows a more balanced valuation profile with slightly better price-to-book (2 vs. 1) and price-to-earnings (2 vs. 2) scores, although both face valuation challenges. Both firms share a weak debt-to-equity score (1), signaling elevated leverage risk. Overall, Fortinet relies on operational excellence, while Cisco maintains a steadier valuation balance.
—
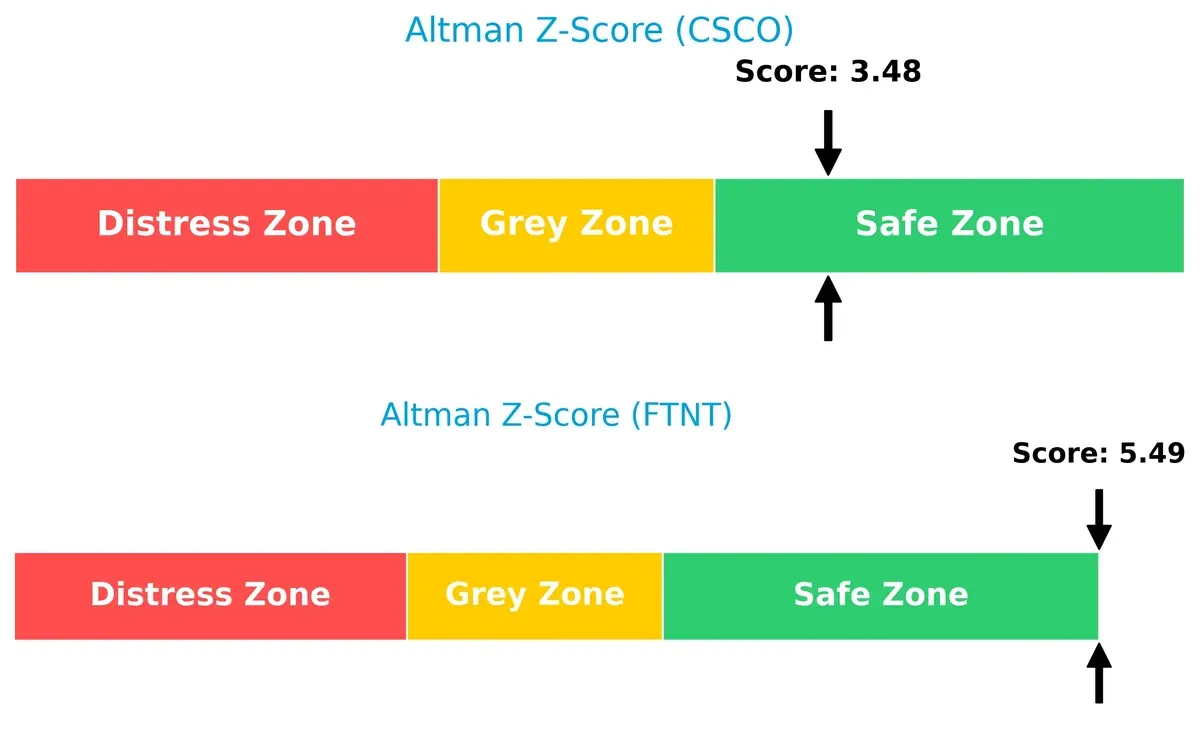
Bankruptcy Risk: Solvency Showdown
Fortinet’s Altman Z-Score of 5.49 significantly outpaces Cisco’s 3.48, placing both safely above distress thresholds but highlighting Fortinet’s stronger solvency and lower bankruptcy risk in this cycle:
—
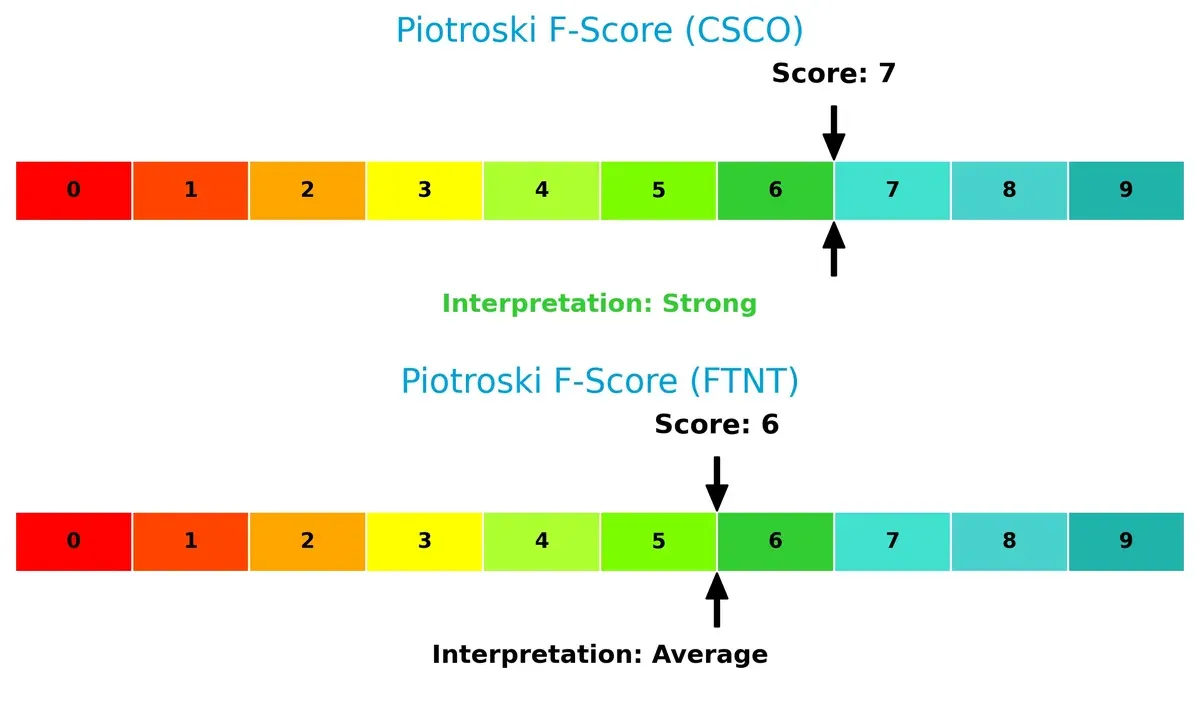
Financial Health: Quality of Operations
Cisco’s Piotroski F-Score of 7 surpasses Fortinet’s 6, indicating Cisco currently enjoys stronger financial health with fewer red flags in profitability, leverage, and efficiency metrics:
How are the two companies positioned?
This section dissects the operational DNA of Cisco and Fortinet by comparing revenue distribution and internal dynamics. The goal is to confront their economic moats to reveal the most resilient competitive advantage today.
Revenue Segmentation: The Strategic Mix
This comparison dissects how Cisco Systems and Fortinet diversify their income streams and where their primary sector bets lie:
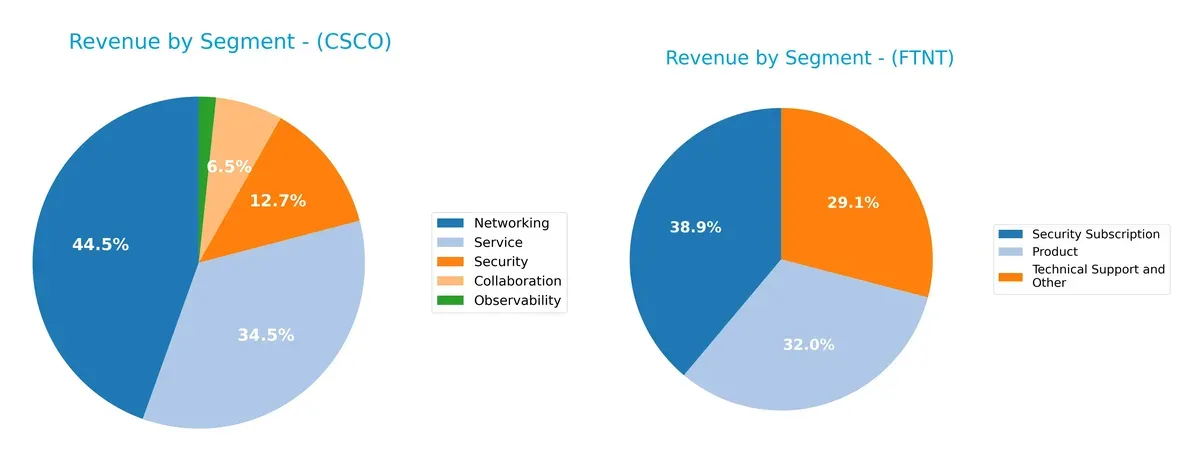
Cisco’s 2025 revenue dwarfs Fortinet’s, anchored by Networking at $28.3B and Services at $21.9B, showing a broad ecosystem lock-in. Fortinet pivots around Security Subscription at $2.3B and Product at $1.9B, revealing a narrower focus on cybersecurity. Cisco’s diversification reduces concentration risk, while Fortinet’s reliance on security subscriptions exposes it to market shifts but strengthens its infrastructure dominance in that niche.
Strengths and Weaknesses Comparison
This table compares the Strengths and Weaknesses of Cisco Systems, Inc. and Fortinet, Inc.:
Cisco Strengths
- Diversified revenue streams including Networking, Security, and Collaboration
- Favorable profitability with net margin of 18% and ROE of 22%
- Strong global presence with $33.7B US revenue and significant Asia and EMEA sales
- Favorable capital structure with debt-to-assets at 24% and interest coverage of 7.9x
Fortinet Strengths
- High profitability with net margin 27% and exceptional ROE at 150%
- Strong return on invested capital at 29%, well above WACC
- Solid liquidity with current ratio 1.17 and quick ratio 1.09
- Favorable geographic diversification across Americas, EMEA, and Asia Pacific
Cisco Weaknesses
- Valuation appears stretched with P/E 27 and P/B 5.8, limiting upside
- Current ratio at 1.0 flags tight liquidity
- Asset turnover low at 0.46, indicating less efficient asset use
- Limited innovation visibility in newer segments like Observability
Fortinet Weaknesses
- High valuation with P/E 32.5 and very high P/B 48.6 signals market premium
- No dividend yield, reducing income appeal
- Debt-to-equity at 0.81 and high interest coverage may signal leverage risks
- Asset turnover moderate at 0.65, showing average asset efficiency
Cisco’s broad diversification and solid profitability underpin its stable global footprint, though valuation and liquidity require caution. Fortinet’s outstanding profitability and liquidity support aggressive growth, but elevated valuation and lack of dividends suggest riskier investment dynamics.
The Moat Duel: Analyzing Competitive Defensibility
A structural moat is the only true shield protecting long-term profits from relentless competitive erosion. Let’s dissect the moats of two tech giants:
Cisco Systems, Inc.: Broad Network Infrastructure Moat
Cisco’s moat stems from its extensive switching and routing portfolio, creating high switching costs. This shows in steady 22% EBIT margins and a 4% ROIC premium over WACC. Yet, its declining ROIC trend signals margin pressure amid fierce cloud and security competition in 2026.
Fortinet, Inc.: Agile Cybersecurity Moat
Fortinet’s moat centers on integrated cybersecurity solutions with strong subscription revenue. It outpaces Cisco with 33% EBIT margin and a 20% ROIC premium, plus a rising ROIC trend. Fortinet’s innovation in AI-driven security deepens its moat and expands market reach in 2026.
Defensive Moat Battle: Legacy Infrastructure vs. Agile Innovation
Fortinet holds a deeper, more dynamic moat than Cisco, fueled by faster ROIC growth and higher margin expansion. Fortinet is better positioned to defend and grow market share amid evolving cybersecurity threats. Cisco’s scale is formidable but faces margin headwinds ahead.
Which stock offers better returns?
Over the past year, Cisco Systems, Inc. and Fortinet, Inc. saw notable price advances with decelerating momentum, reflecting shifting trading dynamics and varied volume trends.
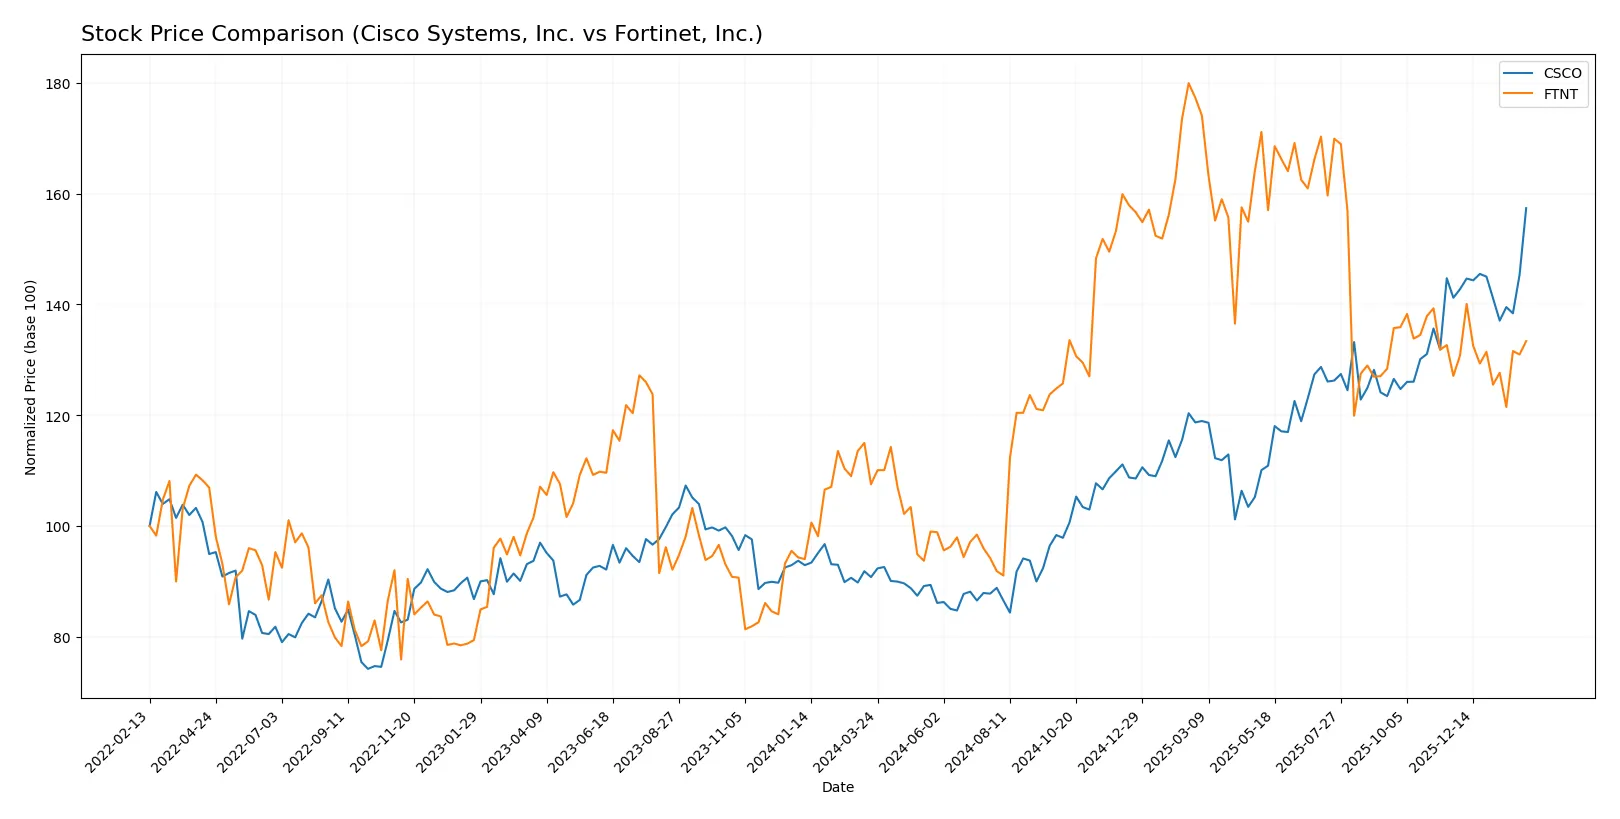
Trend Comparison
Cisco Systems, Inc. gained 73.35% over the last 12 months, marking a strong bullish trend with decelerating price acceleration and a volatility (std deviation) of 10.04%. Its price ranged from 45.47 to 84.82.
Fortinet, Inc. posted a 24.04% increase in the same period, also bullish but with deceleration and higher volatility at 15.07%. The stock’s price moved between 56.51 and 111.64.
Cisco’s return significantly outpaced Fortinet’s, delivering the highest market performance over the past year.
Target Prices
Analysts present a confident target price consensus for Cisco Systems, Inc. and Fortinet, Inc.
| Company | Target Low | Target High | Consensus |
|---|---|---|---|
| Cisco Systems, Inc. | 69 | 100 | 89.6 |
| Fortinet, Inc. | 70 | 90 | 85 |
The consensus targets for Cisco and Fortinet imply upside potential of 5.6% and 2.7%, respectively, compared to current prices near $84.82 and $82.76. Analysts expect moderate appreciation reflecting sector resilience.

Don’t Let Luck Decide Your Entry Point
Optimize your entry points with our advanced ProRealTime indicators. You’ll get efficient buy signals with precise price targets for maximum performance. Start outperforming now!
How do institutions grade them?
Here are the latest grades from reputable financial institutions for Cisco Systems, Inc. and Fortinet, Inc.:
Cisco Systems, Inc. Grades
The following table summarizes Cisco Systems’ recent institutional grades and recommendations.
| Grading Company | Action | New Grade | Date |
|---|---|---|---|
| Evercore ISI Group | Upgrade | Outperform | 2026-01-26 |
| Morgan Stanley | Maintain | Overweight | 2025-12-17 |
| Citigroup | Maintain | Buy | 2025-11-13 |
| Barclays | Maintain | Equal Weight | 2025-11-13 |
| Keybanc | Maintain | Overweight | 2025-11-13 |
| Piper Sandler | Maintain | Neutral | 2025-11-13 |
| Evercore ISI Group | Maintain | In Line | 2025-11-13 |
| Wells Fargo | Maintain | Overweight | 2025-11-13 |
| B of A Securities | Maintain | Buy | 2025-11-13 |
| Morgan Stanley | Maintain | Overweight | 2025-11-13 |
Fortinet, Inc. Grades
This table displays Fortinet’s recent institutional grades and updates.
| Grading Company | Action | New Grade | Date |
|---|---|---|---|
| Rosenblatt | Maintain | Buy | 2026-02-06 |
| Mizuho | Maintain | Underperform | 2026-02-06 |
| JP Morgan | Maintain | Underweight | 2026-02-06 |
| RBC Capital | Maintain | Sector Perform | 2026-02-06 |
| Wedbush | Maintain | Outperform | 2026-02-06 |
| Scotiabank | Downgrade | Sector Perform | 2026-02-02 |
| JP Morgan | Maintain | Underweight | 2026-01-30 |
| Rosenblatt | Upgrade | Buy | 2026-01-29 |
| TD Cowen | Upgrade | Buy | 2026-01-23 |
| Citigroup | Maintain | Neutral | 2026-01-13 |
Which company has the best grades?
Cisco Systems holds generally stronger and more consistent grades, including multiple Buy and Overweight ratings. Fortinet shows a mixed profile with some Buy and Outperform ratings but also several Underperform and Underweight grades. This divergence may influence investor sentiment and portfolio positioning differently.
Risks specific to each company
The following categories identify critical pressure points and systemic threats facing both Cisco Systems, Inc. and Fortinet, Inc. in the 2026 market environment:
1. Market & Competition
Cisco Systems, Inc.
- Operates in a mature communication equipment sector with intense competition from diversified tech giants.
Fortinet, Inc.
- Faces fierce competition in cybersecurity software, a fast-evolving and innovation-driven market.
2. Capital Structure & Debt
Cisco Systems, Inc.
- Moderate leverage with debt-to-assets at 24.24%, and interest coverage at 7.86x, reflecting manageable debt risk.
Fortinet, Inc.
- Lower leverage at 9.59% debt-to-assets and very strong interest coverage at 113x, indicating robust debt control.
3. Stock Volatility
Cisco Systems, Inc.
- Beta of 0.865 suggests below-market volatility, offering relative stability in turbulent markets.
Fortinet, Inc.
- Beta of 1.047 shows slightly higher volatility, implying greater sensitivity to market swings.
4. Regulatory & Legal
Cisco Systems, Inc.
- Subject to global regulations in communications and data security, with potential compliance costs.
Fortinet, Inc.
- Operates under stringent cybersecurity laws with risks linked to data breaches and evolving legal standards.
5. Supply Chain & Operations
Cisco Systems, Inc.
- Complex global supply chain with exposure to semiconductor shortages and geopolitical tensions.
Fortinet, Inc.
- Less hardware-dependent but reliant on global software development and cloud infrastructure stability.
6. ESG & Climate Transition
Cisco Systems, Inc.
- Increasing pressure to enhance sustainability in product lifecycle and reduce carbon footprint.
Fortinet, Inc.
- Faces ESG scrutiny on data privacy and energy consumption of security solutions amid climate initiatives.
7. Geopolitical Exposure
Cisco Systems, Inc.
- Significant global footprint, especially in China and Europe, exposing it to trade and regulatory risks.
Fortinet, Inc.
- Also global but smaller scale, with concentrated exposure in North America and Europe, less in Asia-Pacific.
Which company shows a better risk-adjusted profile?
Fortinet’s lower leverage and stronger interest coverage reduce financial risk compared to Cisco’s moderate debt. However, Cisco benefits from lower stock volatility and a more diversified product base. Cisco’s current ratio of 1.0 is a red flag, signaling potential liquidity strain. Fortinet’s higher beta and valuation multiples heighten market risk. Overall, Fortinet shows a slightly better risk-adjusted profile due to its superior debt metrics and Altman Z-score of 5.49 versus Cisco’s 3.48. Yet, Cisco’s stable dividend yield and broader market reach mitigate some risks. Investors must weigh Fortinet’s growth volatility against Cisco’s operational scale and liquidity caution.
Final Verdict: Which stock to choose?
Cisco Systems, Inc. wields unmatched operational efficiency and a reliable cash flow engine, reflecting its legacy moat in enterprise networking. Its point of vigilance lies in a near-flat current ratio, signaling potential liquidity pressure. Cisco suits investors aiming for steady income and moderate growth in a diversified portfolio.
Fortinet, Inc. commands a strategic moat rooted in cloud security dominance and recurring revenue resilience. Its robust and growing ROIC outshines Cisco’s, offering superior capital efficiency with a cleaner balance sheet. Fortinet fits well within a GARP portfolio, targeting growth tempered by reasonable financial discipline.
If you prioritize stable cash generation and proven market position, Cisco is the compelling choice due to its consistent value creation despite margin pressures. However, if you seek dynamic growth with a sustainable competitive advantage and expanding profitability, Fortinet offers better upside potential albeit with higher valuation risks. Both carry risks, so alignment with your risk tolerance and portfolio goals is key.
Disclaimer: Investment carries a risk of loss of initial capital. The past performance is not a reliable indicator of future results. Be sure to understand risks before making an investment decision.
Go Further
I encourage you to read the complete analyses of Cisco Systems, Inc. and Fortinet, Inc. to enhance your investment decisions: