Home > Comparison > Technology > CSCO vs CMCSA
The strategic rivalry between Cisco Systems, Inc. and Comcast Corporation shapes the evolution of global technology and communication services. Cisco, a technology leader, specializes in communication equipment with a focus on networking hardware and security. Comcast, a communication services powerhouse, integrates media, broadband, and entertainment. This analysis contrasts their capital deployment and growth strategies to identify which path offers superior risk-adjusted returns for a diversified portfolio in 2026.
Table of contents
Companies Overview
Cisco Systems and Comcast Corporation dominate distinct yet overlapping sectors, shaping the communication landscape in 2026.
Cisco Systems, Inc.: Networking and Security Powerhouse
Cisco Systems leads the communication equipment sector with a robust portfolio in Internet Protocol-based networking products. It generates revenue primarily through switching, routing, wireless, security, and collaboration solutions. In 2026, Cisco sharpens its strategic focus on cloud migration and cybersecurity, delivering hybrid cloud collaboration and advanced network security services globally.
Comcast Corporation: Media and Broadband Giant
Comcast operates across telecommunications and media, offering broadband, video, voice, and wireless services under the Xfinity brand. It also commands a strong presence in media production, theme parks, and streaming platforms. In 2026, Comcast prioritizes expanding its streaming and direct-to-consumer offerings while deepening broadband penetration and advertising revenues.
Strategic Collision: Similarities & Divergences
Cisco and Comcast differ fundamentally: Cisco prioritizes a technology-centric, product-driven model, while Comcast adopts a content and service-oriented approach. Their competition centers on connectivity and customer engagement, with Cisco enabling infrastructure and Comcast delivering content and access. This divergence creates distinct investment profiles—Cisco as a technology innovator, Comcast as a media and service conglomerate.
Income Statement Comparison
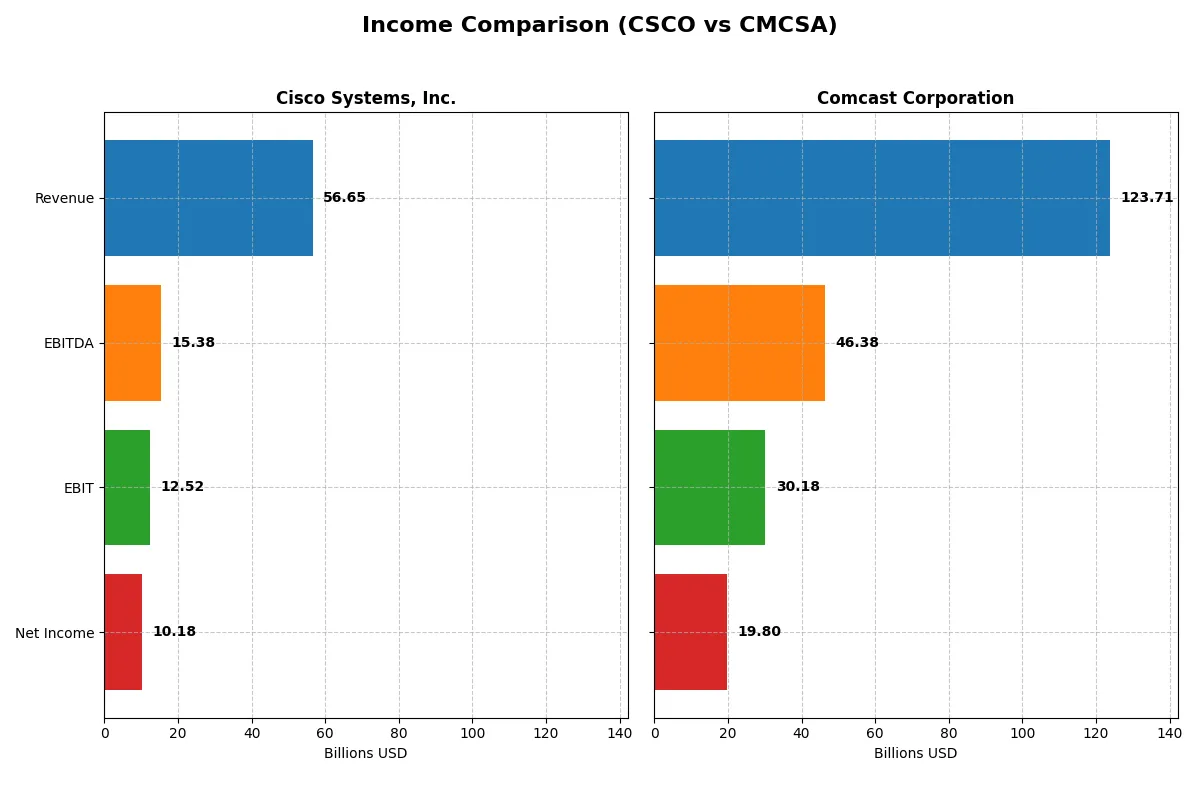
This table dissects the core profitability and scalability of both corporate engines to reveal who dominates the bottom line:
| Metric | Cisco Systems, Inc. (CSCO) | Comcast Corporation (CMCSA) |
|---|---|---|
| Revenue | 56.7B | 123.7B |
| Cost of Revenue | 19.9B | 49.4B |
| Operating Expenses | 25.0B | 53.6B |
| Gross Profit | 36.8B | 74.3B |
| EBITDA | 15.4B | 46.4B |
| EBIT | 12.5B | 30.2B |
| Interest Expense | 1.6B | 4.4B |
| Net Income | 10.2B | 20.0B |
| EPS | 2.56 | 5.41 |
| Fiscal Year | 2025 | 2025 |
Income Statement Analysis: The Bottom-Line Duel
This income statement comparison reveals which company converts revenue into profit most efficiently and sustains superior margin health.
Cisco Systems, Inc. Analysis
Cisco’s revenue rose steadily from 49.8B in 2021 to 56.7B in 2025, showing a 13.7% growth over five years. Net income, however, declined by 3.9%, sliding from 10.6B to 10.2B, reflecting margin pressure. Gross margin remains robust near 65%, but net margin shrank to 18%, signaling rising operating costs and slightly eroding bottom-line momentum in 2025.
Comcast Corporation Analysis
Comcast’s revenue hovered around 123.7B in 2025, with a modest 6.3% increase since 2021. Net income soared 40% to 20.0B, driven by expanding net margin at 16%. Comcast’s gross margin at 60% and EBIT margin above 24% demonstrate strong operational leverage. The company gained momentum in 2025 with double-digit EBIT and net margin growth, highlighting improving profitability.
Margin Resilience vs. Earnings Momentum
Cisco delivers higher gross margin but shows weakening net income and margin trends. Comcast posts slightly lower margins but drives strong net income growth and expanding profitability. Comcast’s profile favors investors seeking earnings momentum, while Cisco appeals for margin stability amid rising expenses.
Financial Ratios Comparison
These vital ratios act as a diagnostic tool to expose the underlying fiscal health, valuation premiums, and capital efficiency of Cisco Systems, Inc. and Comcast Corporation:
| Ratios | Cisco Systems, Inc. (CSCO) | Comcast Corporation (CMCSA) |
|---|---|---|
| ROE | 21.7% | 20.4% |
| ROIC | 11.6% | 9.9% |
| P/E | 26.8 | 5.1 |
| P/B | 5.8 | 1.1 |
| Current Ratio | 1.0 | 0.9 |
| Quick Ratio | 0.9 | 0.9 |
| D/E | 0.63 | 0.06 |
| Debt-to-Assets | 24.2% | 3.2% |
| Interest Coverage | 7.4 | 4.7 |
| Asset Turnover | 0.46 | 0.66 |
| Fixed Asset Turnover | 16.6 | 1.9 |
| Payout ratio | 63.2% | 24.7% |
| Dividend yield | 2.36% | 4.81% |
| Fiscal Year | 2025 | 2025 |
Efficiency & Valuation Duel: The Vital Signs
Financial ratios serve as a company’s DNA, exposing hidden risks and operational strengths that shape investor decisions.
Cisco Systems, Inc.
Cisco delivers strong profitability with a 21.7% ROE and a healthy 18% net margin, signaling operational excellence. However, its valuation appears stretched, with a P/E of 26.8 and P/B at 5.8, both unfavorable versus sector norms. Cisco rewards shareholders with a 2.36% dividend yield, balancing capital return with consistent R&D investment.
Comcast Corporation
Comcast shows solid profitability, boasting a 20.4% ROE and a 16% net margin. Its valuation metrics remain very attractive, with a low P/E of 5.1 and P/B near 1.0, indicating the stock is efficiently priced. Comcast offers a generous 4.8% dividend yield while maintaining conservative leverage and moderate reinvestment in growth.
Valuation Discipline vs. Profitability Excellence
Comcast offers a compelling balance of attractive valuation and solid profitability, minimizing risk with low debt and strong dividends. Cisco excels in operational efficiency and shareholder returns but trades at a premium, raising valuation risk. Income-focused investors may prefer Comcast’s yield, while growth-oriented investors might favor Cisco’s quality metrics.
Which one offers the Superior Shareholder Reward?
I see Cisco Systems (CSCO) and Comcast Corporation (CMCSA) adopt contrasting shareholder reward strategies. Cisco yields 2.36% with a payout ratio near 63%, showing strong free cash flow (FCF) coverage around 94%. Its buyback program remains solid but modest relative to cash flow. Comcast pays a higher dividend yield of 4.81% with a conservative payout ratio near 25%, prioritizing buybacks and reinvestment. Comcast’s free cash flow coverage is lighter at 65%, reflecting heavier capital expenditures. Cisco’s balanced dividend and buyback approach feels more sustainable, offering a blend of income and capital returns. Comcast’s higher yield suits income-focused investors but carries more risk due to leverage and capex demands. In 2026, I favor Cisco for superior total return potential and financial prudence.
Comparative Score Analysis: The Strategic Profile
The radar chart reveals the fundamental DNA and trade-offs of Cisco Systems, Inc. and Comcast Corporation, highlighting their financial strengths and vulnerabilities:

Comcast leads with a more balanced profile, scoring favorably across DCF (4), ROE (4), ROA (5), and Debt/Equity (4). Cisco shows strength in ROE (4) and ROA (4) but struggles with debt (score 1) and valuation metrics (P/E 2, P/B 2). Comcast’s diversified strength suggests a robust capital allocation strategy, while Cisco depends heavily on operational efficiency amid financial leverage risks.
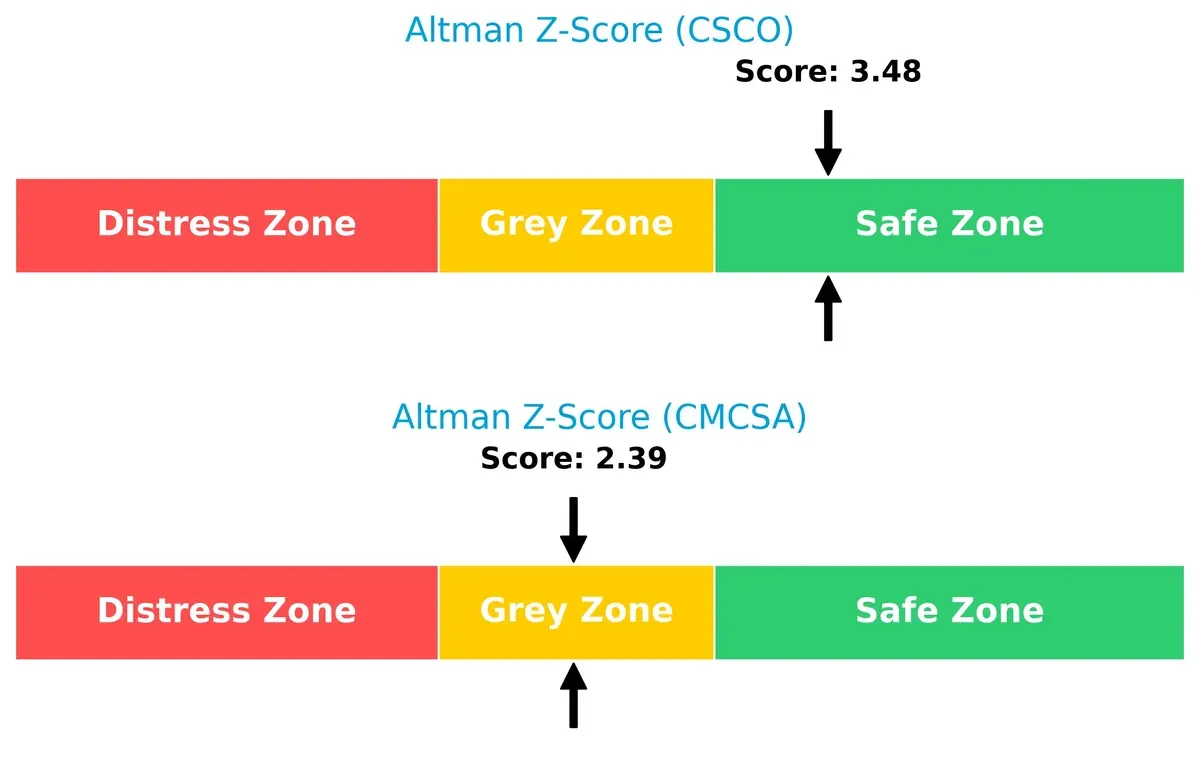
Bankruptcy Risk: Solvency Showdown
Comcast’s Altman Z-Score of 2.39 places it in the grey zone, signaling moderate bankruptcy risk. Cisco’s score of 3.48 situates it safely above distress levels, indicating stronger long-term survival odds in this cycle:
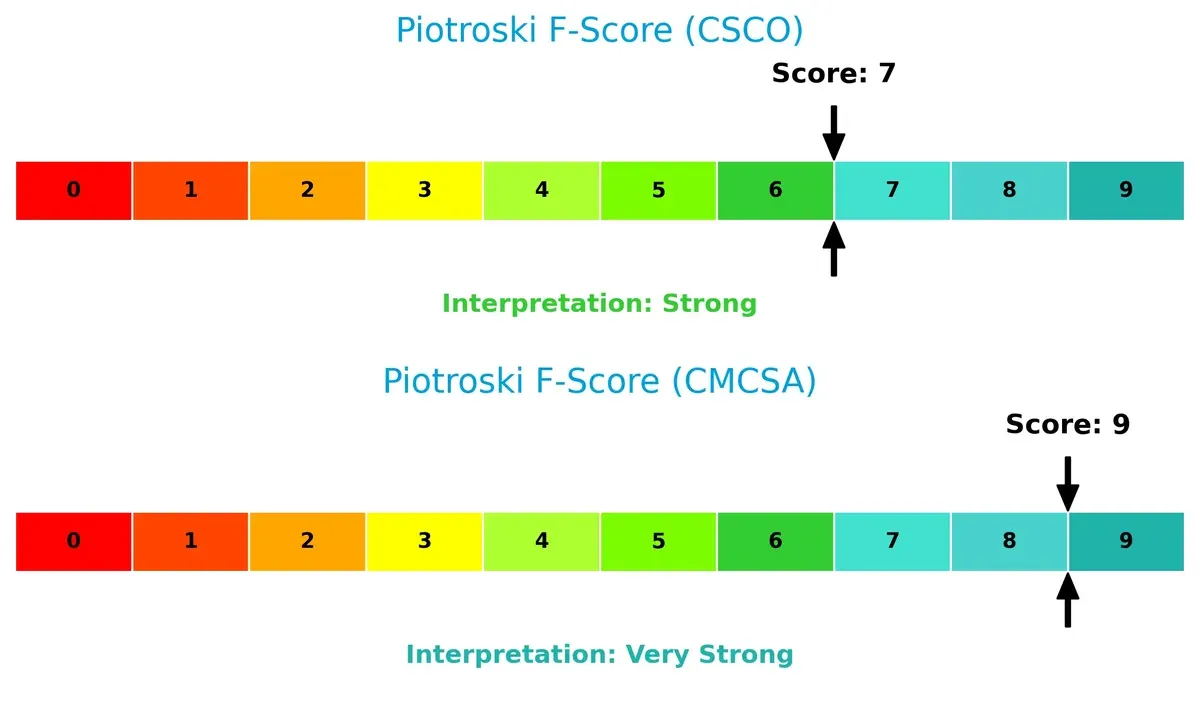
Financial Health: Quality of Operations
Comcast’s Piotroski F-Score of 9 indicates very strong financial health with robust operational metrics. Cisco’s score of 7, while strong, reveals some internal weaknesses compared to Comcast’s peak performance:
How are the two companies positioned?
This section dissects Cisco and Comcast’s operational DNA by comparing revenue distribution and internal dynamics. The goal is to confront their economic moats and identify the more resilient, sustainable competitive advantage today.
Revenue Segmentation: The Strategic Mix
This visual comparison dissects how Cisco Systems and Comcast diversify income streams and highlights their primary sector bets:
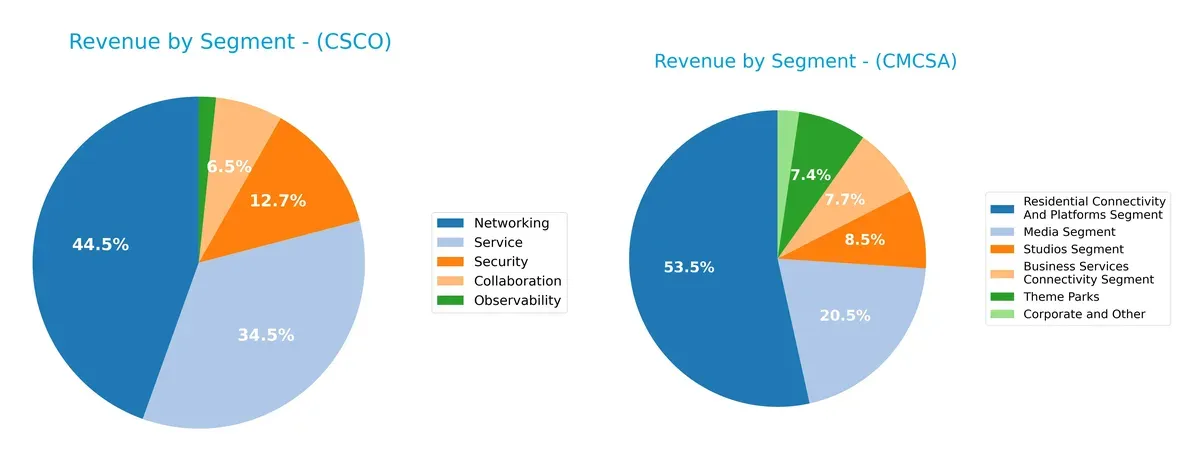
Cisco anchors its revenue in Networking at $28.3B, with Services and Security adding $21.9B and $8.1B respectively. This mix reflects infrastructure dominance with moderate diversification across Collaboration and Observability. Comcast, however, pivots heavily on Residential Connectivity and Platforms at $70.7B, dwarfing its Media and Theme Parks segments. Comcast’s revenue concentration signals ecosystem lock-in but raises concentration risk, while Cisco balances growth with infrastructure and security breadth.
Strengths and Weaknesses Comparison
This table compares the strengths and weaknesses of Cisco Systems and Comcast Corporation:
Cisco Strengths
- Diverse product segments including Networking 28B, Security 8B, and Services 22B
- Strong profitability with net margin 18% and ROE 22%
- Favorable capital structure with ROIC 12% above WACC 7.6%
- Global presence with significant US 34B and EMEA 15B revenues
- High fixed asset turnover 16.6 indicates asset efficiency
Comcast Strengths
- Wide geographic reach with US 95B, Europe 15B, and Other 13B revenues
- Healthy profitability: net margin 16%, ROE 20%, and WACC 5.3%
- Favorable valuation with PE 5.1 and PB 1.05
- Low debt-to-equity 0.06 supports financial flexibility
- Strong dividend yield 4.8% enhances shareholder returns
Cisco Weaknesses
- Unfavorable valuation metrics: PE 26.8 and PB 5.8 suggest premium pricing
- Current ratio at 1.0 signals tight liquidity buffer
- Asset turnover 0.46 below ideal, indicating lower asset utilization
Comcast Weaknesses
- Current ratio 0.88 below optimal liquidity level
- Neutral ROIC 9.9% close to WACC, limiting value creation
- Moderate asset turnover 0.66 and fixed asset turnover 1.9 suggest room for operational improvement
Cisco excels in diversified technology segments and asset efficiency but faces valuation and liquidity pressures. Comcast offers broader geographic diversification and attractive valuation but must manage liquidity and optimize capital returns. Both companies show strengths aligned with their industry roles, yet caution on liquidity and asset use is warranted.
The Moat Duel: Analyzing Competitive Defensibility
A structural moat is the only shield protecting long-term profits from relentless competitive erosion. Here’s how Cisco Systems and Comcast defend their turf:
Cisco Systems, Inc.: Intangible Assets and Network Effects
Cisco’s competitive advantage stems from its deep intellectual property and entrenched network effects in enterprise networking. This shows in its stable gross margin near 65% and solid 18% net margin. However, its declining ROIC trend warns of margin pressure. New cloud-based security and collaboration products could either reinforce or threaten its moat in 2026.
Comcast Corporation: Scale and Ecosystem Integration
Comcast leverages scale and a diversified media-telecom ecosystem, driving a robust 24% EBIT margin and accelerating net income growth near 40% over five years. Unlike Cisco, Comcast’s ROIC is rising sharply, signaling efficient capital use. Expansion in streaming and international markets promises to deepen its moat amid shifting consumer habits.
Intangibles vs. Scale: Defensibility in Tech and Media
Both companies create economic value above their cost of capital, but Comcast’s growing ROIC and revenue diversification give it a wider, more sustainable moat. I see Comcast better positioned to shield profits and capture market share in 2026’s evolving landscape.
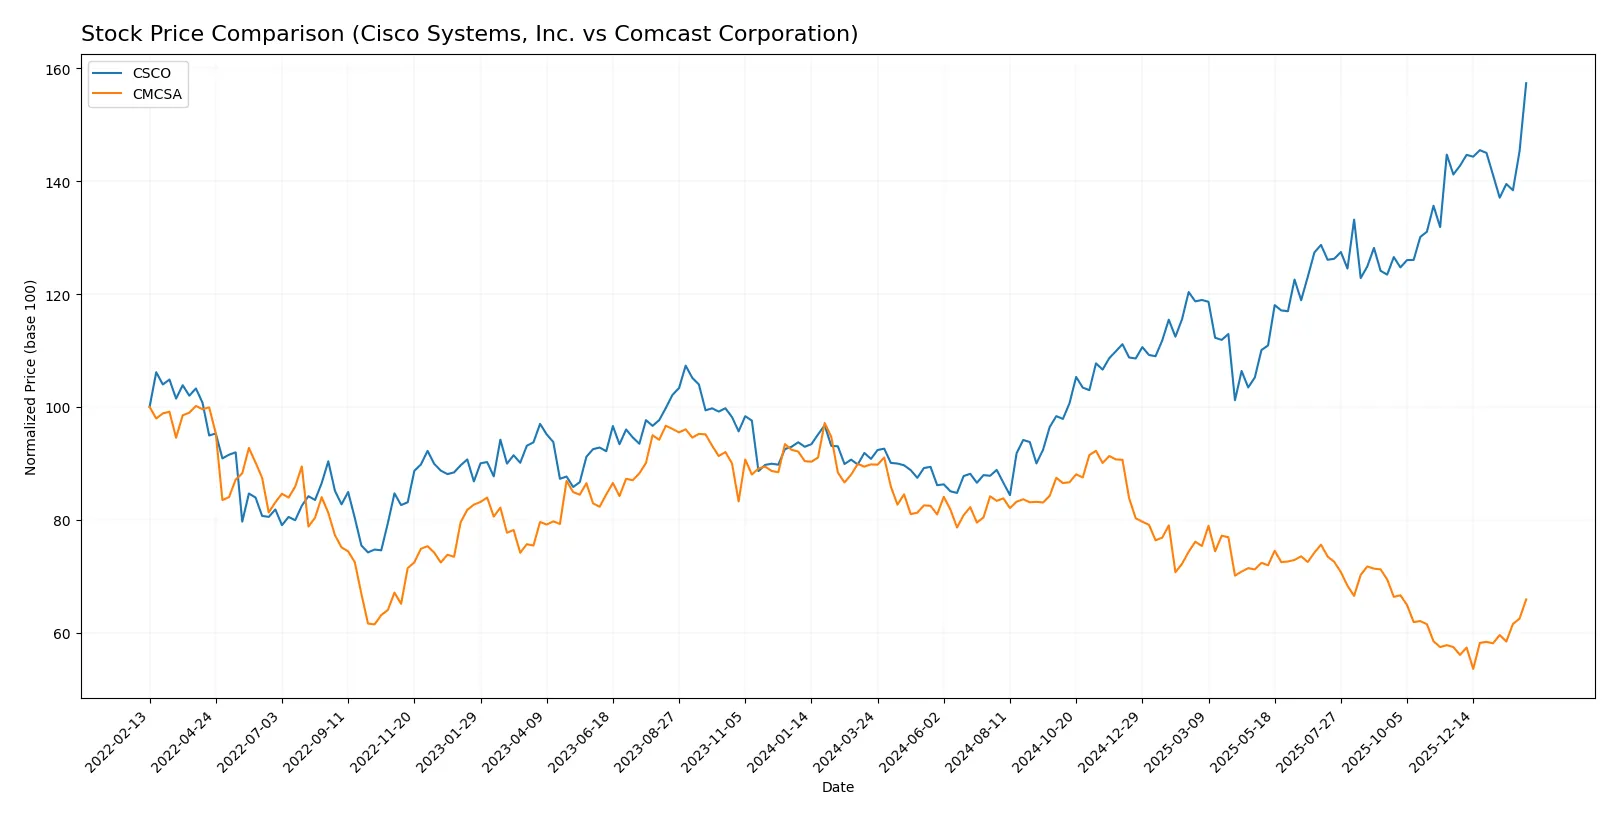
Which stock offers better returns?
The past year saw Cisco Systems, Inc. surge with a strong upward trend, while Comcast Corporation experienced a significant decline, reflecting contrasting market dynamics and investor sentiment.
Trend Comparison
Cisco Systems, Inc. posted a 73.35% price increase over the last 12 months, signaling a strong bullish trend despite decelerating momentum and a 10.04 volatility measure. The stock peaked at 84.82 and bottomed at 45.47.
Comcast Corporation’s stock fell 26.65% over the same period, marking a bearish trend with accelerating decline and moderate volatility at 4.74. Its price ranged between 25.51 and 43.91.
Cisco delivered the highest market performance with a substantial positive return, contrasting Comcast’s persistent downward trajectory despite recent short-term gains.
Target Prices
Analysts present a cautiously optimistic target consensus for Cisco Systems, Inc. and Comcast Corporation.
| Company | Target Low | Target High | Consensus |
|---|---|---|---|
| Cisco Systems, Inc. | 69 | 100 | 89.6 |
| Comcast Corporation | 23 | 40 | 32.71 |
Cisco’s consensus target price of 89.6 exceeds its current price of 84.82, indicating moderate upside potential. Comcast’s target consensus of 32.71 slightly surpasses its current price of 31.37, signaling modest expected gains.

Don’t Let Luck Decide Your Entry Point
Optimize your entry points with our advanced ProRealTime indicators. You’ll get efficient buy signals with precise price targets for maximum performance. Start outperforming now!
How do institutions grade them?
Cisco Systems, Inc. Grades
The following table summarizes recent grades from leading financial institutions for Cisco Systems, Inc.:
| Grading Company | Action | New Grade | Date |
|---|---|---|---|
| Evercore ISI Group | Upgrade | Outperform | 2026-01-26 |
| Morgan Stanley | Maintain | Overweight | 2025-12-17 |
| Citigroup | Maintain | Buy | 2025-11-13 |
| Barclays | Maintain | Equal Weight | 2025-11-13 |
| Keybanc | Maintain | Overweight | 2025-11-13 |
| Piper Sandler | Maintain | Neutral | 2025-11-13 |
| Evercore ISI Group | Maintain | In Line | 2025-11-13 |
| Wells Fargo | Maintain | Overweight | 2025-11-13 |
| B of A Securities | Maintain | Buy | 2025-11-13 |
| Morgan Stanley | Maintain | Overweight | 2025-11-13 |
Comcast Corporation Grades
Below are recent institutional grades for Comcast Corporation from reputable firms:
| Grading Company | Action | New Grade | Date |
|---|---|---|---|
| Rosenblatt | Maintain | Neutral | 2026-01-30 |
| TD Cowen | Maintain | Buy | 2026-01-30 |
| Citigroup | Maintain | Buy | 2026-01-30 |
| Scotiabank | Maintain | Sector Perform | 2026-01-30 |
| Bernstein | Maintain | Market Perform | 2026-01-16 |
| Barclays | Maintain | Equal Weight | 2026-01-13 |
| B of A Securities | Upgrade | Buy | 2026-01-12 |
| Benchmark | Maintain | Buy | 2026-01-06 |
| Morgan Stanley | Maintain | Equal Weight | 2025-12-10 |
| Rosenblatt | Maintain | Neutral | 2025-12-01 |
Which company has the best grades?
Cisco Systems holds a stronger consensus with multiple “Buy” and “Overweight” ratings, including a recent upgrade to “Outperform.” Comcast’s grades lean toward “Buy” and “Neutral,” with fewer upgrades. Investors might view Cisco’s higher grades as a signal of greater confidence from analysts.
Risks specific to each company
The following categories identify critical pressure points and systemic threats facing Cisco Systems, Inc. and Comcast Corporation in the 2026 market environment:
1. Market & Competition
Cisco Systems, Inc.
- Faces intense competition in networking equipment from emerging tech firms and legacy players.
Comcast Corporation
- Competes in diversified media and telecom sectors, facing disruption from streaming and content rivals.
2. Capital Structure & Debt
Cisco Systems, Inc.
- Moderate debt level (D/E 0.63) with solid interest coverage but weaker debt-to-equity score signals some leverage risk.
Comcast Corporation
- Very low debt ratio (D/E 0.06) and strong coverage provide financial flexibility and lower default risk.
3. Stock Volatility
Cisco Systems, Inc.
- Beta of 0.865 indicates moderate sensitivity to market swings, slightly above Comcast’s.
Comcast Corporation
- Beta of 0.793 shows lower relative volatility, appealing for risk-averse investors.
4. Regulatory & Legal
Cisco Systems, Inc.
- Subject to technology export controls and data privacy regulations globally, increasing compliance costs.
Comcast Corporation
- Faces regulatory scrutiny in cable, media consolidation, and broadband net neutrality issues.
5. Supply Chain & Operations
Cisco Systems, Inc.
- Vulnerable to semiconductor supply disruptions impacting product availability and margins.
Comcast Corporation
- Complex operations across media, theme parks, and telecom create operational risks and cost pressures.
6. ESG & Climate Transition
Cisco Systems, Inc.
- Strong focus on network security and sustainability but must advance climate transition in manufacturing.
Comcast Corporation
- Increasing pressure to reduce carbon footprint in theme parks and data centers amid rising ESG demands.
7. Geopolitical Exposure
Cisco Systems, Inc.
- Significant international sales expose it to trade tensions and foreign regulatory risks.
Comcast Corporation
- Mostly U.S.-centric but international media assets face geopolitical content regulations and risks.
Which company shows a better risk-adjusted profile?
Cisco’s main risk is its leveraged capital structure amid sector competition and supply chain fragility. Comcast’s key risk lies in regulatory complexity across diverse businesses. Comcast’s lower debt load, superior Altman Z-Score in grey zone, and higher Piotroski score reflect a stronger risk-adjusted profile. Notably, Comcast’s debt-to-equity of 0.06 versus Cisco’s 0.63 justifies concern over Cisco’s financial leverage.
Final Verdict: Which stock to choose?
Cisco Systems’ superpower lies in its efficient capital allocation and robust profitability, delivering solid returns despite a slightly declining ROIC trend. Its near-parity current ratio signals a liquidity point of vigilance. This stock fits well in aggressive growth portfolios seeking tech resilience with some margin for operational improvement.
Comcast commands a strategic moat through a sustainable and growing ROIC, reflecting strong operational efficiency and capital discipline. Its lower leverage and attractive valuation multiples offer a safer profile compared to Cisco. Comcast suits investors favoring GARP strategies, balancing growth with reasonable risk and valuation.
If you prioritize dynamic growth backed by efficient capital use, Cisco outshines with superior returns on equity and invested capital. However, if you seek better stability and valuation safety with a robust competitive advantage, Comcast offers a more compelling scenario. Both present favorable cases, but investor risk tolerance and strategy will guide the analytical choice.
Disclaimer: Investment carries a risk of loss of initial capital. The past performance is not a reliable indicator of future results. Be sure to understand risks before making an investment decision.
Go Further
I encourage you to read the complete analyses of Cisco Systems, Inc. and Comcast Corporation to enhance your investment decisions: