Home > Comparison > Technology > TXN vs CRUS
The strategic rivalry between Texas Instruments Incorporated and Cirrus Logic, Inc. shapes the semiconductor sector’s evolution. Texas Instruments operates as a capital-intensive industrial giant with broad analog and embedded processing product lines. Cirrus Logic, a fabless semiconductor innovator, focuses on high-precision mixed-signal audio solutions. This head-to-head pits scale and diversification against specialization and innovation. This analysis aims to identify which corporate trajectory offers superior risk-adjusted returns for a diversified portfolio.
Table of contents
Companies Overview
Texas Instruments and Cirrus Logic shape key segments of the semiconductor market with distinct strategic focuses.
Texas Instruments Incorporated: Analog and Embedded Processing Leader
Texas Instruments dominates as a semiconductor manufacturer specializing in analog and embedded processing chips. It generates revenue by selling power management products and microcontrollers globally. In 2026, it prioritizes expanding its analog segment, leveraging highly integrated solutions for industrial and automotive markets to maintain its robust competitive advantage.
Cirrus Logic, Inc.: Mixed-Signal Audio Innovator
Cirrus Logic stands out as a fabless semiconductor company focused on low-power, high-precision mixed-signal processing solutions. Its core revenue comes from audio codecs and DSPs used in consumer devices like smartphones and AR/VR headsets. The company’s 2026 strategy emphasizes enhancing user experience through proprietary SoundClear technology and expanding its footprint in portable audio markets.
Strategic Collision: Similarities & Divergences
Both companies operate in semiconductors but diverge sharply: Texas Instruments embraces a broad chip manufacturing model, while Cirrus Logic specializes in a narrow fabless niche. Their primary battleground lies in capturing end-market device integrations, with TI targeting industrial and automotive sectors and Cirrus focusing on consumer audio. Their distinct investment profiles reflect TI’s scale and diversification versus Cirrus’s innovation-driven growth potential.
Income Statement Comparison
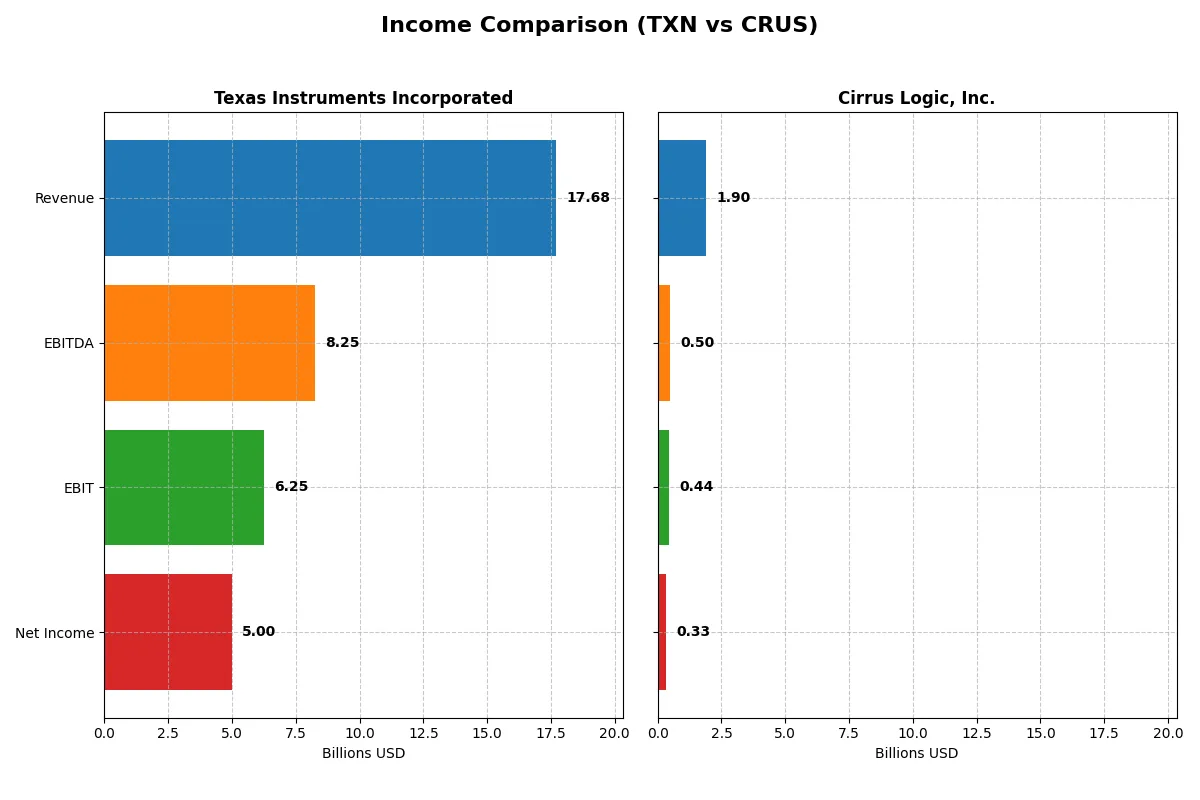
This data dissects the core profitability and scalability of both corporate engines to reveal who dominates the bottom line:
| Metric | Texas Instruments Incorporated (TXN) | Cirrus Logic, Inc. (CRUS) |
|---|---|---|
| Revenue | 17.7B | 1.9B |
| Cost of Revenue | 7.6B | 900M |
| Operating Expenses | 4.1B | 586M |
| Gross Profit | 10.1B | 1.0B |
| EBITDA | 8.3B | 497M |
| EBIT | 6.3B | 445M |
| Interest Expense | 543M | 0.9M |
| Net Income | 5.0B | 332M |
| EPS | 5.45 | 6.24 |
| Fiscal Year | 2025 | 2025 |
Income Statement Analysis: The Bottom-Line Duel
This income statement comparison reveals which company runs a more efficient and profitable corporate engine through recent financial performance.
Texas Instruments Incorporated Analysis
Texas Instruments’ revenue reached $17.7B in 2025, up 13% from 2024, although its five-year trend shows a slight decline. Net income stood at $5.0B, reflecting a solid 28.3% net margin but a 7.8% margin contraction year-over-year. Gross margin remains robust at 57%, signaling efficient cost control despite a modest net income dip.
Cirrus Logic, Inc. Analysis
Cirrus Logic posted $1.9B in 2025 revenue, growing nearly 6% from the prior year and showing strong five-year momentum. Net income rose to $331M with a 17.5% net margin, improving 13.9% year-over-year. Margins expanded alongside a 22% EPS increase, indicating accelerating profitability and operational leverage in recent periods.
Margin Strength vs. Growth Momentum
Texas Instruments dominates in absolute scale and margin quality, boasting a 57% gross margin and $5B net income. Cirrus Logic, smaller but faster-growing, excels in margin expansion and earnings growth. For investors, Texas Instruments offers stable, high-margin earnings, while Cirrus Logic presents a compelling growth profile with improving profitability.
Financial Ratios Comparison
These vital ratios act as a diagnostic tool to expose the underlying fiscal health, valuation premiums, and capital efficiency of Texas Instruments (TXN) and Cirrus Logic (CRUS):
| Ratios | Texas Instruments (TXN) | Cirrus Logic (CRUS) |
|---|---|---|
| ROE | 30.7% | 17.0% |
| ROIC | 16.5% | 14.2% |
| P/E | 31.5 | 15.9 |
| P/B | 9.69 | 2.71 |
| Current Ratio | 4.35 | 6.35 |
| Quick Ratio | 2.83 | 4.82 |
| D/E | 0.86 | 0.07 |
| Debt-to-Assets | 40.6% | 6.18% |
| Interest Coverage | 11.1 | 457 |
| Asset Turnover | 0.51 | 0.81 |
| Fixed Asset Turnover | 1.44 | 6.62 |
| Payout Ratio | 100% | 0% |
| Dividend Yield | 3.17% | 0% |
| Fiscal Year | 2025 | 2025 |
Efficiency & Valuation Duel: The Vital Signs
Ratios serve as the company’s DNA, exposing hidden risks and operational strengths through clear, measurable financial signals.
Texas Instruments Incorporated
Texas Instruments reports a strong 30.7% ROE and a robust 28.3% net margin, signaling high profitability. However, its P/E ratio at 31.5 and P/B near 9.7 suggest the stock trades at a stretched valuation. The company supports shareholders with a 3.17% dividend yield, reflecting steady income alongside reinvestment in R&D at 11.8% of revenue.
Cirrus Logic, Inc.
Cirrus Logic posts a moderate 17% ROE and a 17.5% net margin, showing efficient core operations but lower profitability than its peer. Its P/E ratio at 16 and P/B at 2.7 indicate a fair valuation relative to earnings and book value. The firm offers no dividend, instead channeling capital into growth, with R&D spending at 22.9% of revenue.
Valuation Stretch vs. Operational Efficiency
Texas Instruments commands a premium valuation justified by superior profitability and shareholder dividends, though at some valuation risk. Cirrus Logic balances a reasonable valuation with solid operational efficiency but lacks direct shareholder returns. Investors seeking income might prefer Texas Instruments, while those favoring growth might find Cirrus Logic’s profile more suitable.
Which one offers the Superior Shareholder Reward?
Texas Instruments Incorporated (TXN) delivers a classic income and buyback blend, yielding about 3.17% with a nearly 100% payout ratio and moderate free cash flow coverage (~0.75x). Its buyback activity complements dividends, sustaining shareholder rewards. Cirrus Logic, Inc. (CRUS) pays no dividends but channels strong free cash flow (~7.8/share) into aggressive buybacks, fueling growth and capital returns. CRUS’s lean capex (~0.54/share) and negligible debt suggest high distribution sustainability via buybacks. Historically, dividend-plus-buyback models like TXN’s offer stability, but CRUS’s reinvestment agility suits growth-focused investors. In 2026, I see TXN as superior for income investors seeking steady payouts, while CRUS appeals for total return seekers valuing buyback-driven capital appreciation. Overall, TXN offers a more balanced and sustainable shareholder reward profile today.
Comparative Score Analysis: The Strategic Profile
The radar chart reveals the fundamental DNA and trade-offs of Texas Instruments and Cirrus Logic, highlighting their financial strengths and valuation nuances:
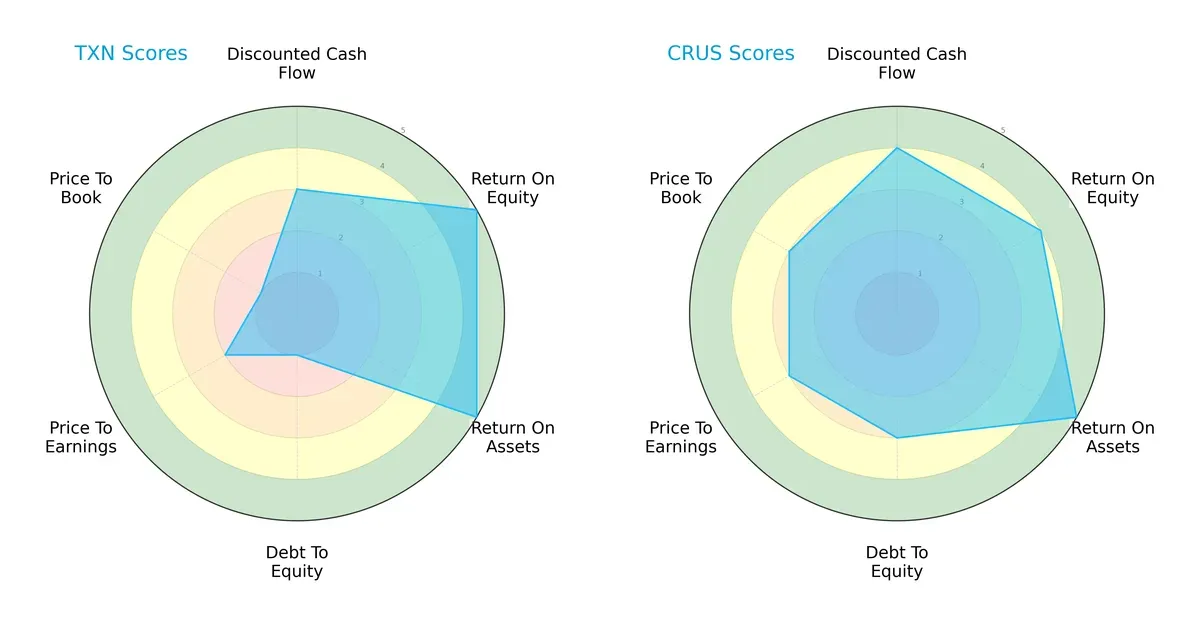
Texas Instruments excels in return on equity and assets, scoring a perfect 5 in both, but suffers from a weak debt-to-equity position and poor valuation metrics. Cirrus Logic offers a more balanced profile with solid DCF, ROE, ROA, and moderate debt and valuation scores. While TXN relies heavily on operational efficiency, CRUS shows steadier financial stability and valuation appeal.
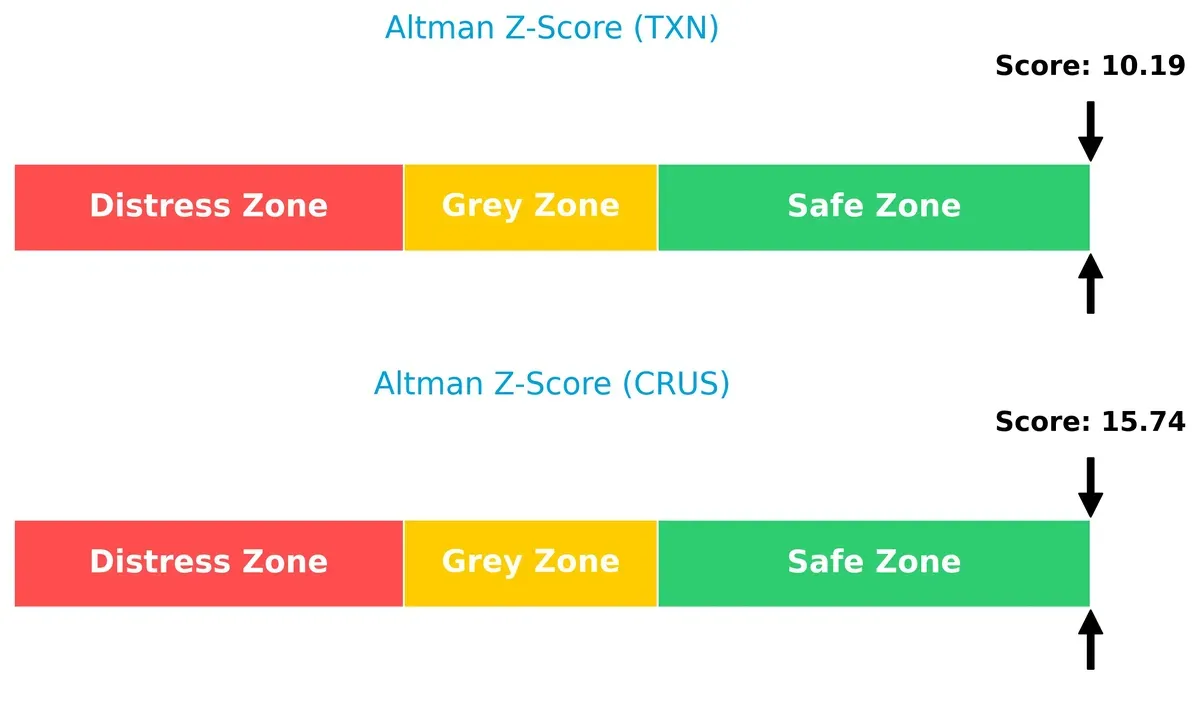
Bankruptcy Risk: Solvency Showdown
Cirrus Logic’s Altman Z-Score of 15.7 significantly outpaces Texas Instruments’ 10.2, placing both comfortably in the safe zone but highlighting CRUS’s stronger buffer against financial distress in this cycle:
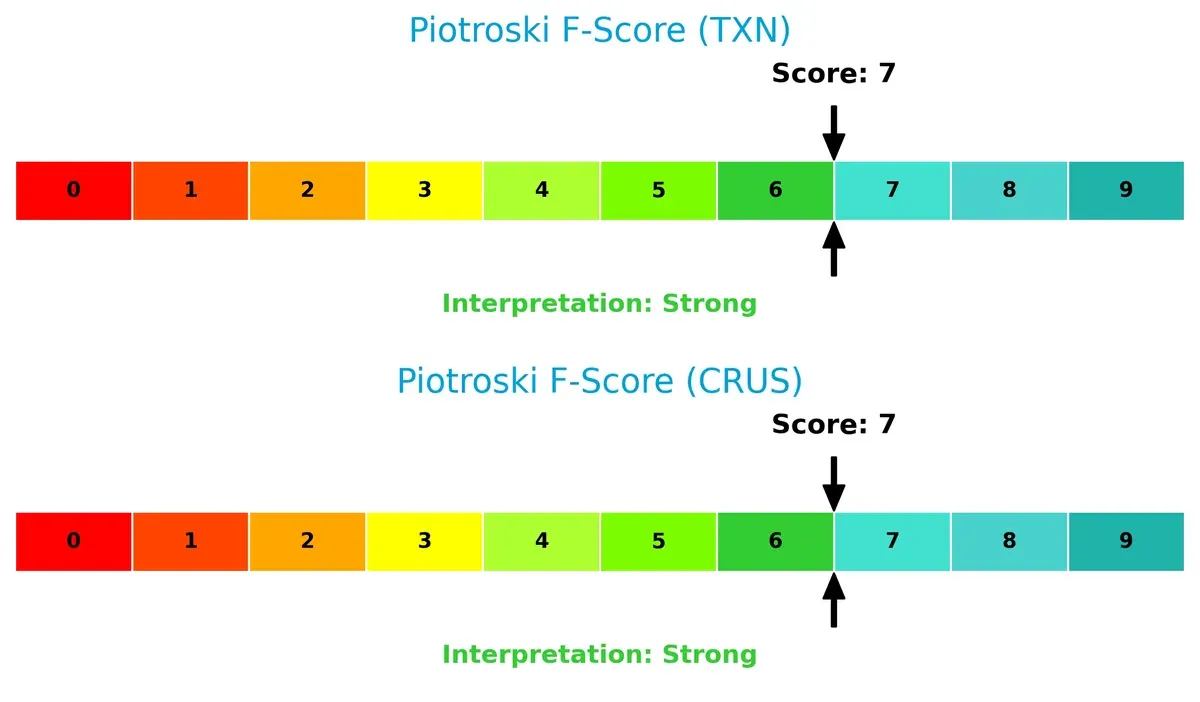
Financial Health: Quality of Operations
Both companies score a robust 7 on the Piotroski F-Score, indicating strong financial health and operational quality. Neither shows red flags in internal metrics, signaling sound fundamentals:
How are the two companies positioned?
This section dissects the operational DNA of Texas Instruments and Cirrus Logic by comparing their revenue distribution and internal dynamics. The goal is to confront their economic moats to identify which model offers a more resilient, sustainable competitive advantage today.
Revenue Segmentation: The Strategic Mix
The following visual comparison dissects how Texas Instruments and Cirrus Logic diversify their income streams and where their primary sector bets lie:
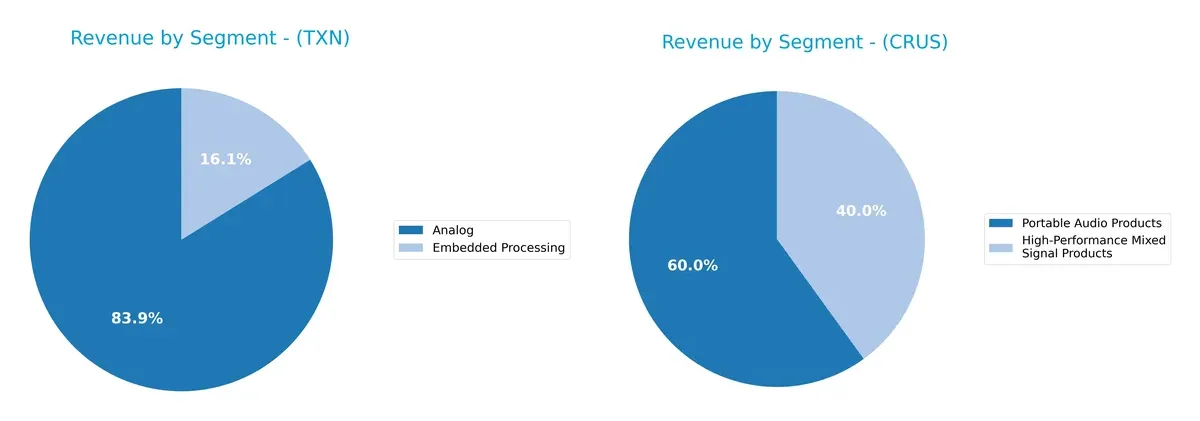
Texas Instruments anchors its revenue in Analog, generating $14B in 2025, with Embedded Processing at $2.7B, showing a moderately diversified portfolio. Cirrus Logic pivots heavily on Portable Audio Products, earning $1.1B, while High-Performance Mixed Signal Products contribute $759M, indicating a narrower focus. Texas Instruments’ broader mix reduces concentration risk and leverages infrastructure dominance. Cirrus Logic’s reliance on portable audio suggests exposure to consumer trends and potential volatility.
Strengths and Weaknesses Comparison
This table compares the strengths and weaknesses of Texas Instruments Incorporated and Cirrus Logic, Inc.:
Texas Instruments Incorporated Strengths
- Strong profitability with 28.28% net margin
- High ROE at 30.73% and ROIC at 16.52%
- Diverse revenue streams including Analog and Embedded Processing
- Solid global presence with significant sales in US, China, and EMEA
- Favorable quick ratio and interest coverage
- Dividend yield at 3.17%
Cirrus Logic, Inc. Strengths
- Favorable profitability metrics with 17.48% net margin and 17.01% ROE
- Low debt-to-assets ratio at 6.18% and high interest coverage
- High fixed asset turnover at 6.62 indicating efficient asset use
- Favorable quick ratio and debt-to-equity
- Revenue focused on Portable Audio and Mixed Signal Products
- Favorable global presence with strong China and Hong Kong exposure
Texas Instruments Incorporated Weaknesses
- Unfavorable high P/E (31.53) and P/B (9.69) ratios
- Current ratio of 4.35 flagged as unfavorable, indicating liquidity concerns
- Moderate debt level with 40.62% debt to assets
- Asset turnover is neutral at 0.51, indicating average asset efficiency
- Dependence on Analog segment may limit diversification
Cirrus Logic, Inc. Weaknesses
- Zero dividend yield signals no income return to investors
- Current ratio at 6.35 also unfavorable, indicating possible working capital inefficiency
- Higher WACC at 9.01% compared to TXN
- Lower net margin and ROE compared to TXN
- Smaller market share with concentrated product lines
Overall, Texas Instruments shows strong profitability and diversified revenue but faces valuation and liquidity challenges. Cirrus Logic benefits from efficient asset use and low leverage but has limited diversification and no dividend, impacting income-focused investors. Both companies have distinct financial profiles shaping their strategic priorities.
The Moat Duel: Analyzing Competitive Defensibility
A structural moat shields long-term profits from competitive erosion. Without it, sustainable returns vanish rapidly:
Texas Instruments Incorporated: Cost Advantage Through Analog Dominance
Texas Instruments leverages a cost advantage rooted in scale and manufacturing expertise. Its high 35% EBIT margin signals margin stability. New industrial and automotive markets in 2026 could deepen this moat.
Cirrus Logic, Inc.: Intangible Assets in Audio Innovation
Cirrus Logic’s moat stems from proprietary audio processing technology and intellectual property, unlike Texas Instruments’ cost moat. Its rising ROIC and 23% EBIT margin demonstrate strengthening competitive positioning. Expansion into AR/VR audio can propel growth.
Verdict: Cost Efficiency vs. Intellectual Property Power
Texas Instruments holds a wider moat via cost leadership and scale, but Cirrus Logic shows a deeper moat with rising ROIC and innovation-driven defensibility. Cirrus Logic appears better positioned to defend market share amid technological shifts.
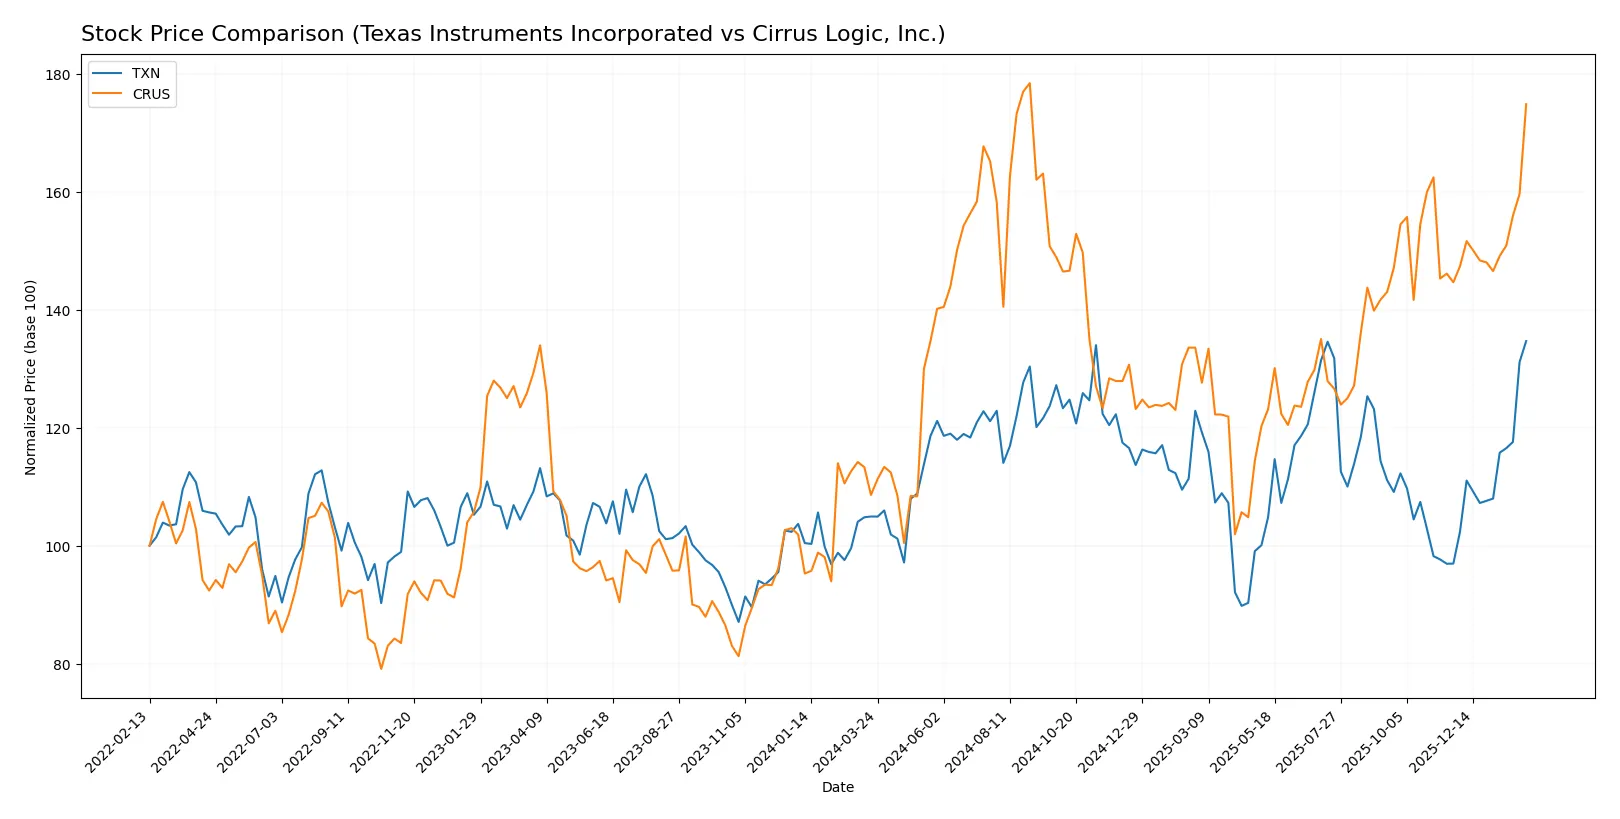
Which stock offers better returns?
Over the past 12 months, Texas Instruments and Cirrus Logic have shown strong price appreciation with accelerating bullish momentum and rising trading volumes.
Trend Comparison
Texas Instruments’ stock price rose 28.36% over the past year, showing a bullish trend with acceleration and high volatility (16.2% std deviation). It hit a low of 147.6 and a high of 221.44.
Cirrus Logic’s stock price surged 61.02% over the same period, also bullish with acceleration but slightly lower volatility at 14.64%. The price ranged from 82.02 to 145.69.
Cirrus Logic outperformed Texas Instruments in total return, delivering higher gains despite lower overall trading volume and volatility during the period.
Target Prices
Analysts present a balanced target price consensus for Texas Instruments Incorporated and Cirrus Logic, Inc.
| Company | Target Low | Target High | Consensus |
|---|---|---|---|
| Texas Instruments Incorporated | 160 | 260 | 204.64 |
| Cirrus Logic, Inc. | 110 | 163 | 144.5 |
The consensus target for Texas Instruments sits below its current price of $221.44, suggesting modest downside risk. Cirrus Logic’s consensus aligns closely with its $142.78 price, indicating stable market expectations.

Don’t Let Luck Decide Your Entry Point
Optimize your entry points with our advanced ProRealTime indicators. You’ll get efficient buy signals with precise price targets for maximum performance. Start outperforming now!
How do institutions grade them?
Here are the latest institutional grades assigned to Texas Instruments Incorporated and Cirrus Logic, Inc.:
Texas Instruments Incorporated Grades
The following table summarizes recent grades from reputable institutions for Texas Instruments Incorporated.
| Grading Company | Action | New Grade | Date |
|---|---|---|---|
| Rosenblatt | Maintain | Buy | 2026-02-05 |
| JP Morgan | Maintain | Overweight | 2026-01-28 |
| Cantor Fitzgerald | Maintain | Neutral | 2026-01-28 |
| Wells Fargo | Maintain | Equal Weight | 2026-01-28 |
| Truist Securities | Maintain | Hold | 2026-01-28 |
| Stifel | Maintain | Hold | 2026-01-28 |
| UBS | Maintain | Buy | 2026-01-28 |
| Mizuho | Maintain | Underperform | 2026-01-28 |
| Jefferies | Maintain | Hold | 2026-01-28 |
| Benchmark | Maintain | Buy | 2026-01-28 |
Cirrus Logic, Inc. Grades
Below are recent institutional grades for Cirrus Logic, Inc. from established grading firms.
| Grading Company | Action | New Grade | Date |
|---|---|---|---|
| Stifel | Maintain | Buy | 2026-02-04 |
| Benchmark | Maintain | Buy | 2026-02-04 |
| Barclays | Maintain | Equal Weight | 2026-02-04 |
| Benchmark | Maintain | Buy | 2025-11-05 |
| Barclays | Maintain | Equal Weight | 2025-11-05 |
| Keybanc | Maintain | Overweight | 2025-11-05 |
| Stifel | Maintain | Buy | 2025-11-05 |
| Susquehanna | Maintain | Positive | 2025-10-22 |
| Stifel | Maintain | Buy | 2025-10-17 |
| Stifel | Maintain | Buy | 2025-09-12 |
Which company has the best grades?
Cirrus Logic holds more consistent Buy and Overweight ratings than Texas Instruments, which shows a wider range including Neutral and Underperform grades. This suggests stronger recent institutional confidence in Cirrus Logic’s outlook, potentially influencing investor sentiment positively.
Risks specific to each company
The following categories identify the critical pressure points and systemic threats facing both firms in the 2026 market environment:
1. Market & Competition
Texas Instruments Incorporated
- Dominates analog and embedded processing segments with strong pricing power but faces margin pressure from semiconductor cycle volatility.
Cirrus Logic, Inc.
- Faces intense competition in low-power mixed-signal processing, with smaller scale and niche market focus limiting pricing leverage.
2. Capital Structure & Debt
Texas Instruments Incorporated
- Moderate leverage with debt-to-assets at 40.6%, interest coverage strong at 11.5x, but debt-to-equity score is very unfavorable.
Cirrus Logic, Inc.
- Very low leverage with debt-to-assets at 6.2%, interest coverage extremely high at 495x, indicating a robust balance sheet and low financial risk.
3. Stock Volatility
Texas Instruments Incorporated
- Beta near market average at 0.995, reflecting moderate sensitivity to market swings and semiconductor industry cycles.
Cirrus Logic, Inc.
- Higher beta at 1.136 signals greater stock price volatility and sensitivity to market and sector-specific risks.
4. Regulatory & Legal
Texas Instruments Incorporated
- Exposed to global trade regulations and export controls affecting semiconductor sales, especially in China and emerging markets.
Cirrus Logic, Inc.
- Faces regulatory scrutiny on global supply chain and intellectual property, with potential impacts from evolving tech export restrictions.
5. Supply Chain & Operations
Texas Instruments Incorporated
- Benefits from vertically integrated manufacturing, but ongoing chip shortages and rising input costs remain risks.
Cirrus Logic, Inc.
- As a fabless company, highly dependent on third-party foundries, increasing exposure to supply disruptions and capacity constraints.
6. ESG & Climate Transition
Texas Instruments Incorporated
- Increasing focus on energy-efficient products and sustainable manufacturing, but faces pressure to reduce carbon footprint across global operations.
Cirrus Logic, Inc.
- Smaller scale limits ESG investment capacity; must balance innovation with rising demands for climate risk disclosure and sustainability practices.
7. Geopolitical Exposure
Texas Instruments Incorporated
- Significant exposure to US-China tensions impacting supply chains and sales; also affected by global semiconductor trade policies.
Cirrus Logic, Inc.
- Geopolitical risks concentrated in supply chains and export markets, with less diversified geographic revenue base increasing vulnerability.
Which company shows a better risk-adjusted profile?
Texas Instruments’ largest risk is its substantial debt load and exposure to cyclical semiconductor markets, despite strong operational scale. Cirrus Logic’s key risk lies in supply chain dependency and higher stock volatility but benefits from a pristine balance sheet and favorable financial ratios. Cirrus Logic shows a better risk-adjusted profile in 2026, supported by its very high interest coverage and low leverage, offsetting volatility concerns. This contrast highlights the trade-off between scale-driven market power and financial prudence in this sector today.
Final Verdict: Which stock to choose?
Texas Instruments Incorporated showcases an unparalleled efficiency in capital allocation, consistently creating value with a strong return on invested capital well above its cost of capital. Its main point of vigilance lies in a declining profitability trend, which might pressure future growth. TXN fits well within an Aggressive Growth portfolio seeking established market leadership.
Cirrus Logic, Inc. stands out with a resilient strategic moat driven by sustainable competitive advantages and a growing return on invested capital. Its lower leverage and favorable cash flow generation suggest a safer profile compared to TXN. CRUS suits a Growth at a Reasonable Price (GARP) portfolio aiming for steady expansion with controlled risk.
If you prioritize robust capital efficiency and scale, Texas Instruments commands a premium position due to its dominant market presence and strong cash generation. However, if you seek growth combined with greater financial stability and an improving profitability trajectory, Cirrus Logic offers better stability and a compelling risk-reward balance for more conservative growth investors.
Disclaimer: Investment carries a risk of loss of initial capital. The past performance is not a reliable indicator of future results. Be sure to understand risks before making an investment decision.
Go Further
I encourage you to read the complete analyses of Texas Instruments Incorporated and Cirrus Logic, Inc. to enhance your investment decisions: