Home > Comparison > Technology > TER vs CRUS
The strategic rivalry between Teradyne, Inc. and Cirrus Logic, Inc. shapes the semiconductor sector’s competitive landscape. Teradyne operates as a capital-intensive test equipment and industrial automation leader. Cirrus Logic, a fabless semiconductor firm, focuses on high-precision mixed-signal audio and power solutions. This analysis pits Teradyne’s scale and diversification against Cirrus’s innovation-driven niche. I aim to identify which trajectory offers superior risk-adjusted returns for a diversified portfolio.
Table of contents
Companies Overview
Teradyne and Cirrus Logic both play crucial roles in the semiconductor industry, driving innovation in testing and signal processing technologies.
Teradyne, Inc.: Leader in Automated Test Equipment
Teradyne dominates the automatic test equipment market. It generates revenue by selling advanced testing solutions across semiconductor, industrial automation, and wireless sectors. In 2026, Teradyne focused strategically on expanding its robotics automation and 5G wireless testing platforms, enhancing its footprint in high-growth tech segments.
Cirrus Logic, Inc.: Specialist in Mixed-Signal Audio Solutions
Cirrus Logic excels in low-power, high-precision mixed-signal processing. Its revenue stems from audio codec ICs and signal processors used in consumer electronics and industrial applications. In 2026, Cirrus sharpened its focus on improving audio experience technologies and expanding into automotive and industrial energy markets.
Strategic Collision: Similarities & Divergences
Teradyne and Cirrus share a semiconductor foundation but diverge sharply in business philosophy. Teradyne builds a broad, diversified test equipment ecosystem, while Cirrus pursues niche, high-margin mixed-signal solutions. Their primary battleground lies in devices requiring precision testing versus integrated audio processing. This contrast creates distinct risk and growth profiles for investors seeking exposure to semiconductor hardware versus specialized IC innovation.
Income Statement Comparison
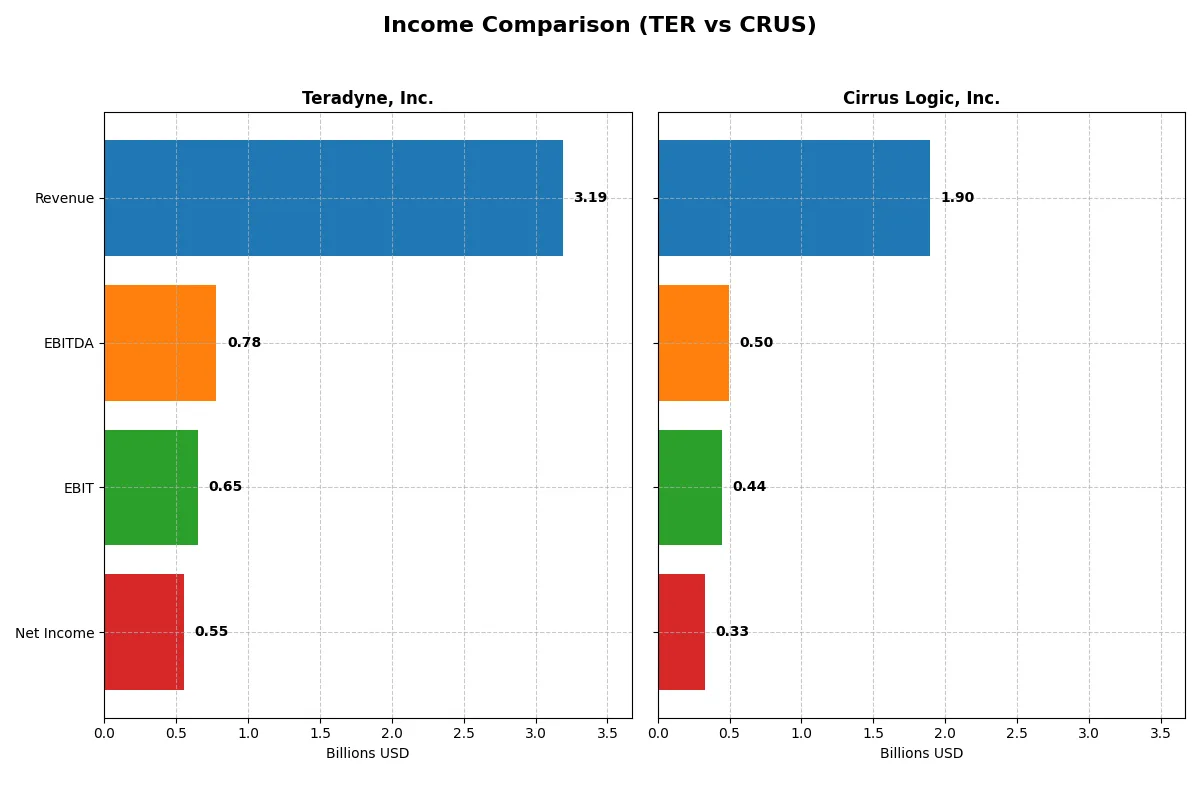
This data dissects the core profitability and scalability of both corporate engines to reveal who dominates the bottom line:
| Metric | Teradyne, Inc. (TER) | Cirrus Logic, Inc. (CRUS) |
|---|---|---|
| Revenue | 3.19B | 1.90B |
| Cost of Revenue | 1.32B | 900M |
| Operating Expenses | 1.17B | 586M |
| Gross Profit | 1.87B | 996M |
| EBITDA | 780M | 497M |
| EBIT | 653M | 445M |
| Interest Expense | 8M | 1M |
| Net Income | 554M | 332M |
| EPS | 3.49 | 6.24 |
| Fiscal Year | 2025 | 2025 |
Income Statement Analysis: The Bottom-Line Duel
This income statement comparison reveals which company runs its business more efficiently and generates superior shareholder value.
Teradyne, Inc. Analysis
Teradyne’s revenue grew from 2.67B in 2023 to 3.19B in 2025, showing recent momentum after earlier declines. Gross margin holds strong at 58.55%, signaling robust cost control. Net income reached 554M in 2025 but declined over the five-year period, indicating pressure on profitability despite efficient operations.
Cirrus Logic, Inc. Analysis
Cirrus Logic’s revenue steadily climbed from 1.37B in 2021 to 1.90B in 2025, marking consistent growth. Gross margin remains healthy at 52.53%, slightly lower than Teradyne’s but stable. The 2025 net income of 332M expanded markedly over five years, reflecting improving efficiency and expanding margins.
Growth Resilience vs. Margin Leadership
Cirrus Logic outpaces Teradyne in sustained revenue and net income growth, delivering superior earnings momentum. Teradyne excels in gross margin and absolute scale but struggles with profit decline over time. For investors prioritizing growth and improving profitability, Cirrus Logic offers a more compelling profile.
Financial Ratios Comparison
These vital ratios act as a diagnostic tool to expose the underlying fiscal health, valuation premiums, and capital efficiency of the companies compared below:
| Ratios | Teradyne, Inc. (TER) | Cirrus Logic, Inc. (CRUS) |
|---|---|---|
| ROE | 19.8% | 17.0% |
| ROIC | 18.4% | 14.2% |
| P/E | 54.6 | 15.9 |
| P/B | 10.8 | 2.7 |
| Current Ratio | 1.76 | 6.35 |
| Quick Ratio | 1.41 | 4.82 |
| D/E | 0.12 | 0.07 |
| Debt-to-Assets | 8.3% | 6.2% |
| Interest Coverage | 86.4 | 457.0 |
| Asset Turnover | 0.76 | 0.81 |
| Fixed Asset Turnover | 4.99 | 6.62 |
| Payout Ratio | 13.8% | 0% |
| Dividend Yield | 0.25% | 0% |
| Fiscal Year | 2025 | 2025 |
Efficiency & Valuation Duel: The Vital Signs
Ratios act as a company’s DNA, uncovering hidden risks and operational excellence that define its financial health and market stance.
Teradyne, Inc.
Teradyne shows strong profitability with a 19.8% ROE and a solid 17.4% net margin, indicating operational efficiency. However, its valuation appears stretched, with a high P/E of 54.6 and a P/B of 10.8. Shareholder returns include a modest 0.25% dividend yield, signaling limited cash distribution in favor of reinvestment in R&D and growth.
Cirrus Logic, Inc.
Cirrus Logic maintains healthy profitability with a 17.0% ROE and a 17.5% net margin. Its valuation is more reasonable, featuring a P/E of 16.0 and a P/B of 2.7, suggesting less price pressure. The company pays no dividends, focusing capital allocation on R&D to drive innovation and future expansion.
Valuation Balance vs. Profitability Strength
Teradyne’s high valuation contrasts with its robust profitability, while Cirrus Logic offers a more balanced valuation with slightly lower returns. Investors seeking growth with operational safety may prefer Teradyne; those prioritizing value and capital efficiency might lean toward Cirrus Logic.
Which one offers the Superior Shareholder Reward?
I observe Teradyne (TER) maintains a modest dividend yield around 0.25%-0.5% with a payout ratio near 14%. Its dividend is well-covered by FCF, indicating sustainability. Teradyne also executes steady buybacks, enhancing total return. Cirrus Logic (CRUS) pays no dividends but aggressively repurchases shares, returning 93.5% of operating cash flow to buybacks, signaling a strong reinvestment in growth and capital returns. Cirrus’s zero payout ratio and higher FCF yield suggest a growth-focused capital allocation, but lack of dividends may deter income-seeking investors. Considering sustainability and total return, I find Teradyne’s balanced dividend plus buybacks model superior for long-term shareholders in 2026.
Comparative Score Analysis: The Strategic Profile
The radar chart below reveals the fundamental DNA and trade-offs of Teradyne, Inc. and Cirrus Logic, Inc., highlighting their financial strengths and valuation nuances:
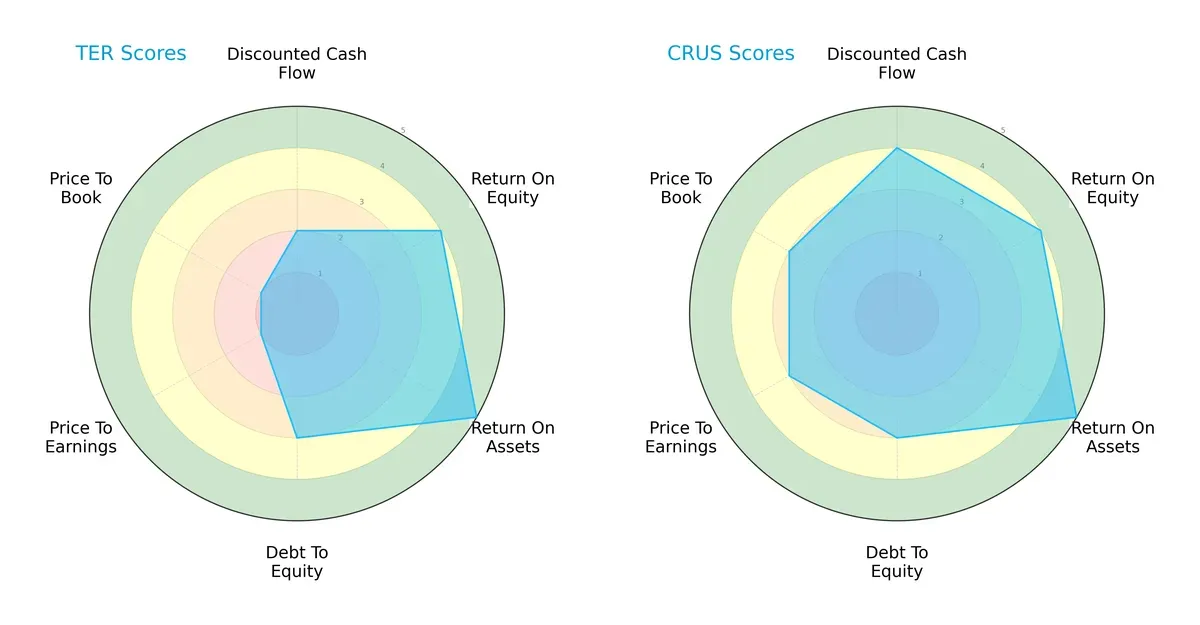
Cirrus Logic displays a more balanced financial profile with strong DCF (4), ROE (4), and ROA (5) scores. Teradyne relies heavily on asset efficiency (ROA 5) but suffers from weak valuation metrics (PE and PB scores at 1). Both maintain moderate debt-to-equity levels (3), but Cirrus offers a more favorable overall investment case with less valuation risk.
—
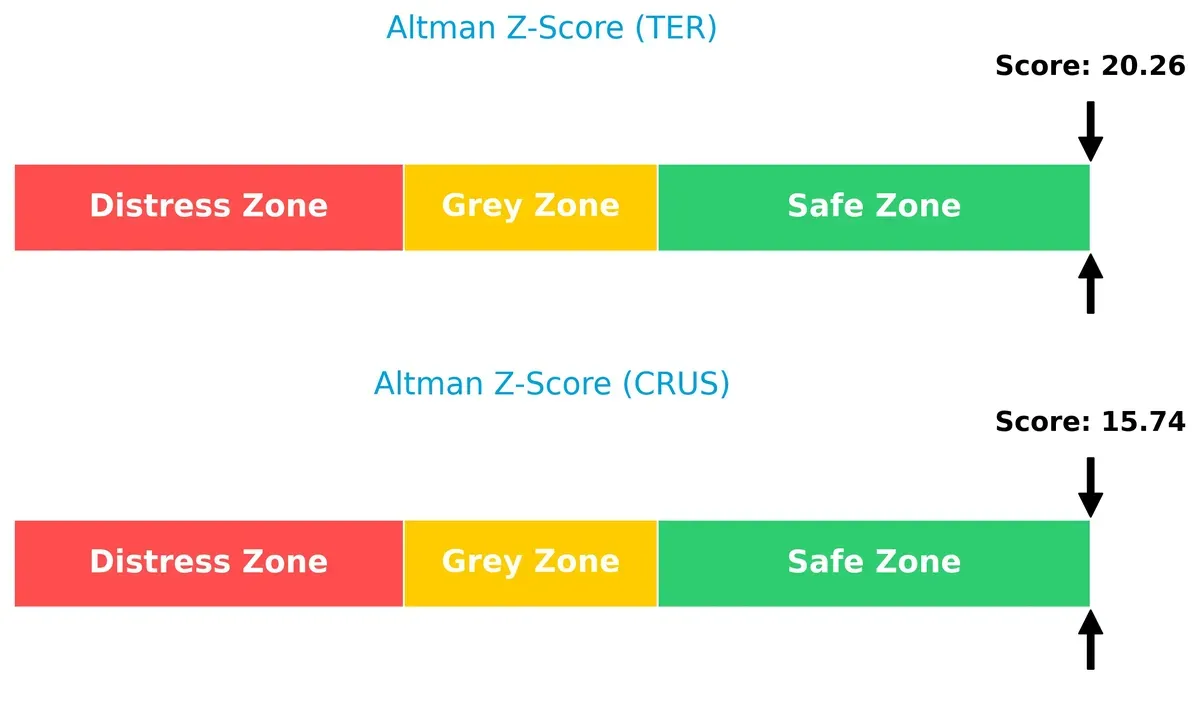
Bankruptcy Risk: Solvency Showdown
Teradyne’s Altman Z-Score (20.26) slightly outpaces Cirrus Logic’s (15.74), implying both firms sit comfortably in the safe zone for long-term survival in this economic cycle:
—
Financial Health: Quality of Operations
Cirrus Logic’s Piotroski F-Score (7) edges out Teradyne’s (6), signaling stronger internal financial metrics and operational quality. Teradyne’s score, while average, suggests some areas need monitoring:

How are the two companies positioned?
This section dissects the operational DNA of Teradyne and Cirrus Logic by comparing revenue distribution and internal dynamics. The goal is to confront their economic moats and identify which model offers the most resilient competitive advantage today.
Revenue Segmentation: The Strategic Mix
This visual comparison dissects how Teradyne, Inc. and Cirrus Logic, Inc. diversify their income streams and reveals their primary sector bets as of their latest fiscal years:
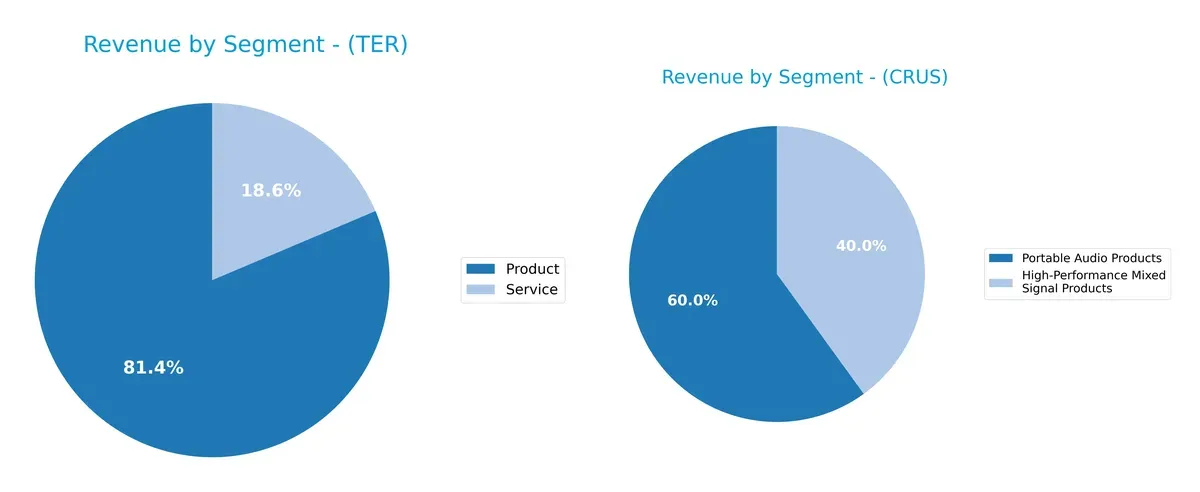
Teradyne anchors its revenue heavily in the Product segment with $2.3B in 2024, complemented by $525M in Services, showing moderate diversification. Cirrus Logic pivots between Portable Audio at $1.1B and High-Performance Mixed Signal Products at $705M, reflecting a more balanced yet tech-focused split. Teradyne’s reliance on Product underscores infrastructure dominance but risk if hardware demand dips. Cirrus Logic’s mix supports ecosystem lock-in in consumer electronics, offering resilience through varied audio tech.
Strengths and Weaknesses Comparison
This table compares the strengths and weaknesses of Teradyne, Inc. and Cirrus Logic, Inc.:
Teradyne Strengths
- Strong profitability metrics with 17.37% net margin and 19.82% ROE
- Favorable liquidity ratios with current ratio 1.76 and quick ratio 1.41
- Low debt levels and strong interest coverage at 81.43
- Diverse global revenue with significant presence in Taiwan, Korea, and the US
- Solid product and service revenue streams
Cirrus Strengths
- Comparable net margin at 17.48% and favorable ROE of 17.01%
- Extremely strong interest coverage of 495.45
- Favorable debt ratios and robust quick ratio of 4.82
- Global presence with strong revenue from China, Hong Kong, and India
- Balanced revenue mix between High-Performance Mixed Signal and Portable Audio Products
Teradyne Weaknesses
- High valuation multiples with PE 54.64 and PB 10.83 raise risk concerns
- WACC above ROIC at 12.29% indicating potential capital cost issues
- Dividend yield low at 0.25%
- Asset turnover neutral at 0.76 limits efficiency upside
- Concentrated revenue in semiconductor testing products
Cirrus Weaknesses
- Elevated current ratio at 6.35 suggests inefficient asset use
- PE and PB ratios neutral but less expensive than Teradyne
- Zero dividend yield could deter income investors
- Asset turnover neutral at 0.81, limiting operational leverage
- Revenue concentration in Portable Audio Products narrows diversification
Teradyne exhibits strong profitability and balanced global diversification but faces valuation and capital cost challenges. Cirrus offers excellent interest coverage and geographic reach but shows signs of inefficiency and product concentration risks. These factors directly influence their strategic focus on capital allocation and market expansion.
The Moat Duel: Analyzing Competitive Defensibility
A structural moat is the only reliable barrier protecting long-term profits from relentless competitive erosion in dynamic markets:
Teradyne, Inc.: Scale and Automation Leader
Teradyne’s moat stems from its cost advantage and scale in automatic test equipment. It shows a solid ROIC above WACC but a declining trend signals margin pressure. New industrial automation and wireless test products could reinforce or strain this moat in 2026.
Cirrus Logic, Inc.: Innovation-Driven Niche Specialist
Cirrus Logic leverages intangible assets and product differentiation in high-precision mixed-signal processing. Its ROIC exceeds WACC with an improving trend, reflecting growing value creation. Expansion in audio and haptics markets offers promising moat deepening potential.
Cost Scale vs. Innovation Edge: Who Holds the Deeper Moat?
Both firms create value, but Cirrus Logic’s rising ROIC and focused innovation indicate a wider, more sustainable moat. Teradyne’s scale advantage is solid but vulnerable to margin erosion. Cirrus Logic is better positioned to defend market share through innovation leadership.
Which stock offers better returns?
Over the past year, Teradyne, Inc. and Cirrus Logic, Inc. both recorded significant price appreciation, with Teradyne showing a notably higher increase and stronger buyer dominance.
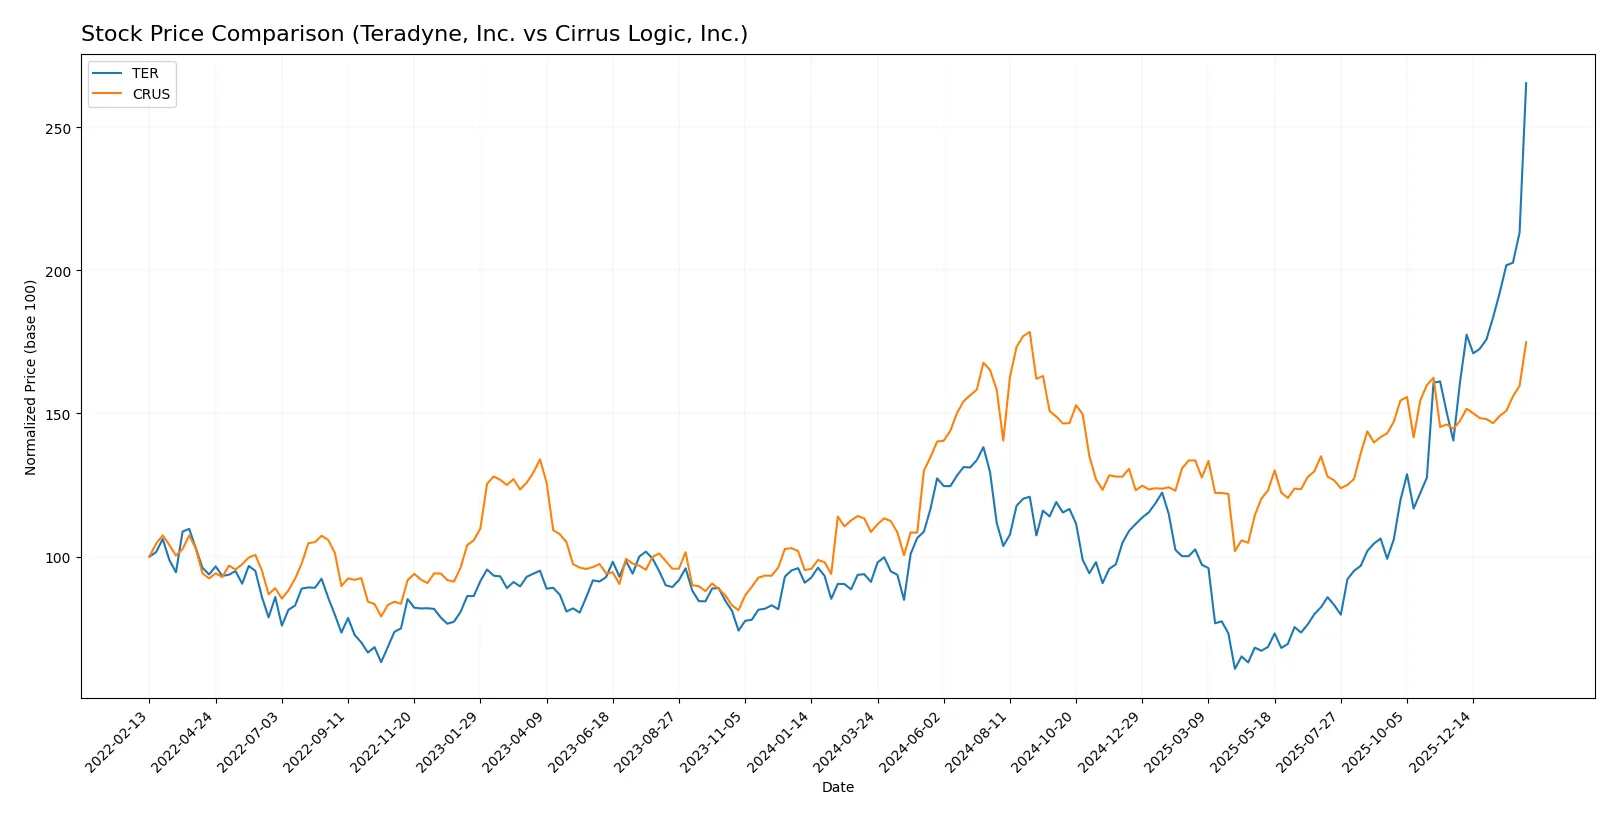
Trend Comparison
Teradyne’s stock rose 191.2% over 12 months, exhibiting a bullish trend with accelerating momentum and high volatility. The price ranged from 68.72 to 300.11, signaling strong market interest.
Cirrus Logic’s stock increased 61.02% in the same period, also bullish with acceleration but lower volatility. Prices moved between 82.02 and 145.69, reflecting steadier gains.
Teradyne outperformed Cirrus Logic, delivering the highest market returns with more pronounced price acceleration and buyer dominance.
Target Prices
Analysts present a mixed but optimistic target consensus for Teradyne, Inc. and Cirrus Logic, Inc.
| Company | Target Low | Target High | Consensus |
|---|---|---|---|
| Teradyne, Inc. | 175 | 335 | 276.08 |
| Cirrus Logic, Inc. | 110 | 163 | 144.5 |
Teradyne’s consensus target sits about 8% below its current price of $300, suggesting some upside risk given its 52-week range. Cirrus Logic’s target consensus aligns closely with its current price of $142.78, indicating a balanced market expectation.

Don’t Let Luck Decide Your Entry Point
Optimize your entry points with our advanced ProRealTime indicators. You’ll get efficient buy signals with precise price targets for maximum performance. Start outperforming now!
How do institutions grade them?
Teradyne, Inc. Grades
The following table summarizes recent grades from reputable institutional analysts for Teradyne, Inc.:
| Grading Company | Action | New Grade | Date |
|---|---|---|---|
| Goldman Sachs | Maintain | Buy | 2026-02-04 |
| Citigroup | Maintain | Buy | 2026-02-04 |
| Cantor Fitzgerald | Maintain | Overweight | 2026-02-04 |
| Evercore ISI Group | Maintain | Outperform | 2026-02-04 |
| Stifel | Maintain | Buy | 2026-02-04 |
| Evercore ISI Group | Maintain | Outperform | 2026-02-03 |
| Cantor Fitzgerald | Maintain | Overweight | 2026-02-02 |
| Stifel | Maintain | Buy | 2026-01-30 |
| UBS | Maintain | Buy | 2026-01-26 |
| B of A Securities | Maintain | Buy | 2026-01-22 |
Cirrus Logic, Inc. Grades
Institutional analyst grades for Cirrus Logic, Inc. are detailed in the table below:
| Grading Company | Action | New Grade | Date |
|---|---|---|---|
| Stifel | Maintain | Buy | 2026-02-04 |
| Benchmark | Maintain | Buy | 2026-02-04 |
| Barclays | Maintain | Equal Weight | 2026-02-04 |
| Benchmark | Maintain | Buy | 2025-11-05 |
| Barclays | Maintain | Equal Weight | 2025-11-05 |
| Keybanc | Maintain | Overweight | 2025-11-05 |
| Stifel | Maintain | Buy | 2025-11-05 |
| Susquehanna | Maintain | Positive | 2025-10-22 |
| Stifel | Maintain | Buy | 2025-10-17 |
| Stifel | Maintain | Buy | 2025-09-12 |
Which company has the best grades?
Teradyne, Inc. consistently earns strong buy and outperform ratings from major firms, indicating robust analyst confidence. Cirrus Logic, Inc. has more mixed grades, including equal weight and positive, but fewer outright buy or outperform ratings. This divergence may influence investor sentiment and portfolio positioning.
Risks specific to each company
The following categories identify the critical pressure points and systemic threats facing both firms in the 2026 market environment:
1. Market & Competition
Teradyne, Inc.
- Operates in highly competitive semiconductor and automation sectors with diverse product lines, facing rapid technological shifts.
Cirrus Logic, Inc.
- Faces intense competition in low-power mixed-signal semiconductors; dependency on a niche audio market limits diversification.
2. Capital Structure & Debt
Teradyne, Inc.
- Low debt-to-equity of 0.12 and strong interest coverage at 81.43 indicate robust financial stability.
Cirrus Logic, Inc.
- Lower debt-to-equity at 0.07 and extremely high interest coverage of 495.45 reflect a conservative capital structure.
3. Stock Volatility
Teradyne, Inc.
- Beta of 1.82 signals higher volatility compared to the market, increasing risk in turbulent periods.
Cirrus Logic, Inc.
- Beta of 1.14 shows moderate volatility, suggesting more stable stock price behavior.
4. Regulatory & Legal
Teradyne, Inc.
- Exposure to export controls and trade policies in semiconductor equipment markets could disrupt sales.
Cirrus Logic, Inc.
- Faces regulatory risks related to semiconductor manufacturing standards and IP protections in mixed-signal technologies.
5. Supply Chain & Operations
Teradyne, Inc.
- Complex global supply chains for test equipment vulnerable to geopolitical disruptions and component shortages.
Cirrus Logic, Inc.
- Fabless model reduces capital intensity but increases reliance on third-party foundries with potential capacity constraints.
6. ESG & Climate Transition
Teradyne, Inc.
- Growing focus on sustainable automation solutions but must manage energy consumption in manufacturing processes.
Cirrus Logic, Inc.
- Increasing pressure to demonstrate ESG compliance in product lifecycle and supply chain transparency.
7. Geopolitical Exposure
Teradyne, Inc.
- Significant exposure to US-China trade tensions affecting semiconductor test equipment exports.
Cirrus Logic, Inc.
- Moderate exposure with diversified client base but still vulnerable to shifts in global semiconductor supply chains.
Which company shows a better risk-adjusted profile?
Teradyne’s greatest risk lies in high stock volatility and geopolitical trade tensions, threatening revenue stability. Cirrus Logic faces concentrated market risk but benefits from a more conservative capital structure and lower volatility. Recent data reveal Teradyne’s beta at 1.82 versus Cirrus’s 1.14, justifying caution. Overall, Cirrus Logic presents a better risk-adjusted profile with stronger financial conservatism and steadier stock behavior.
Final Verdict: Which stock to choose?
Teradyne, Inc. shines with its unmatched capital efficiency and robust profitability, creating value despite a recent dip in return on invested capital. Its premium valuation calls for caution. I see it fitting well in an aggressive growth portfolio willing to embrace volatility for long-term upside.
Cirrus Logic, Inc. boasts a durable moat through steady revenue growth and expanding profitability, underpinned by solid cash flow and a conservative balance sheet. It offers better downside protection than Teradyne, making it suitable for investors seeking growth at a reasonable price with moderate risk.
If you prioritize aggressive growth and can tolerate a high valuation, Teradyne’s operational strength and market momentum make it a compelling choice. However, if you seek a more balanced risk profile with reliable earnings expansion, Cirrus Logic offers better stability and a sustainable competitive advantage without commanding an extreme premium.
Disclaimer: Investment carries a risk of loss of initial capital. The past performance is not a reliable indicator of future results. Be sure to understand risks before making an investment decision.
Go Further
I encourage you to read the complete analyses of Teradyne, Inc. and Cirrus Logic, Inc. to enhance your investment decisions: