Home > Comparison > Technology > STM vs CRUS
The strategic rivalry between STMicroelectronics N.V. and Cirrus Logic, Inc. shapes the semiconductor industry’s evolution. STMicroelectronics operates as a diversified, capital-intensive manufacturer with broad product lines spanning automotive and industrial markets. In contrast, Cirrus Logic excels as a fabless innovator focusing on high-precision audio and mixed-signal solutions. This analysis pits scale and manufacturing depth against niche specialization to identify which corporate path offers superior risk-adjusted returns for a balanced portfolio.
Table of contents
Companies Overview
STMicroelectronics and Cirrus Logic represent pivotal players in the semiconductor industry, each shaping distinct market niches.
STMicroelectronics N.V.: Global Semiconductor Powerhouse
STMicroelectronics dominates diverse semiconductor markets with its automotive ICs, analog, MEMS sensors, and microcontrollers. Its revenue stems from a broad product portfolio serving automotive, industrial, and personal electronics segments. In 2026, the company’s strategy sharpens focus on integrating analog and digital ICs to capture growth across automotive and IoT markets, leveraging its scale and innovation.
Cirrus Logic, Inc.: Specialist in Audio and Mixed-Signal Solutions
Cirrus Logic excels in high-precision, low-power mixed-signal ICs for audio and industrial applications. Its core revenue driver is proprietary audio codecs and DSPs embedded in consumer devices like smartphones and AR/VR headsets. The 2026 strategic thrust targets expanding its audio technology leadership while diversifying into industrial energy management, emphasizing innovation in sound quality and power efficiency.
Strategic Collision: Similarities & Divergences
Both firms operate in semiconductors but diverge in scope: STMicroelectronics pursues a broad, integrated product approach, while Cirrus Logic focuses on niche, high-margin audio and mixed-signal solutions. Their primary battleground is the expanding IoT and consumer electronics space where integration and power efficiency matter. Investors face distinct profiles: ST offers scale and diversification, Cirrus emphasizes specialization and innovation-driven growth.
Income Statement Comparison
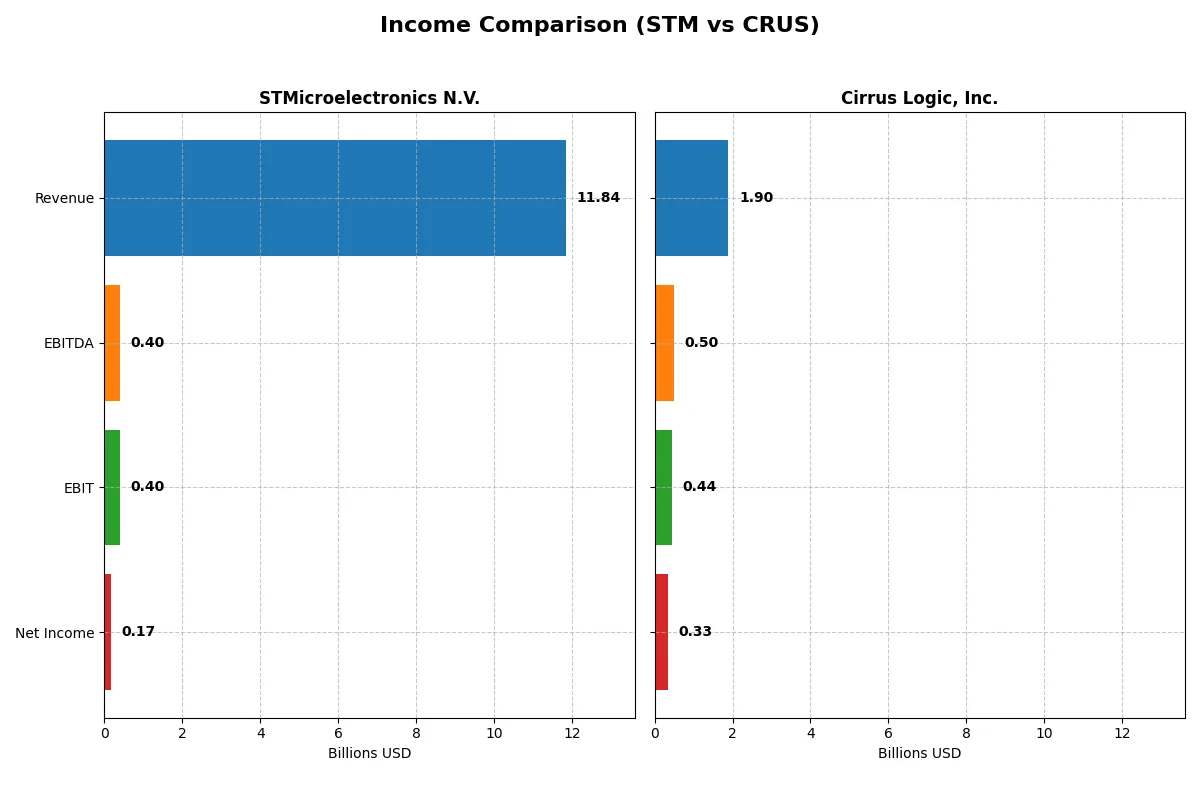
This data dissects the core profitability and scalability of both corporate engines to reveal who dominates the bottom line in the most recent fiscal year:
| Metric | STMicroelectronics N.V. (STM) | Cirrus Logic, Inc. (CRUS) |
|---|---|---|
| Revenue | 11.8B | 1.90B |
| Cost of Revenue | 7.83B | 900M |
| Operating Expenses | 3.69B | 586M |
| Gross Profit | 4.01B | 996M |
| EBITDA | 401M | 497M |
| EBIT | 401M | 445M |
| Interest Expense | 0 | 0.9M |
| Net Income | 167M | 332M |
| EPS | 0.19 | 6.24 |
| Fiscal Year | 2025 | 2025 |
Income Statement Analysis: The Bottom-Line Duel
This income statement comparison exposes which company runs a more efficient and profitable corporate engine through recent financial trends.
STMicroelectronics N.V. Analysis
STMicroelectronics saw a declining revenue trend from $17.3B in 2023 to $11.8B in 2025, with net income plunging from $4.2B to $167M. Its gross margin weakened to 33.9%, and net margin shrank to 1.4%, signaling deteriorated profitability. The 2025 figures highlight efficiency challenges and a severe drop in earnings momentum.
Cirrus Logic, Inc. Analysis
Cirrus Logic’s revenue grew modestly from $1.37B in 2021 to $1.9B in 2025, with net income rising from $217M to $332M. It maintains a strong gross margin above 52% and a robust net margin near 17.5%, reflecting solid operational control. The latest year shows consistent margin expansion and positive earnings momentum.
Margin Strength vs. Revenue Decline
Cirrus Logic outperforms STMicroelectronics on profitability and growth metrics, boasting higher margins and steady income improvement. ST’s sharp revenue and earnings decline weigh heavily against its margin compression. For investors prioritizing fundamental strength and margin resilience, Cirrus Logic presents a more attractive financial profile.
Financial Ratios Comparison
These vital ratios act as a diagnostic tool to expose the underlying fiscal health, valuation premiums, and capital efficiency of each company:
| Ratios | STMicroelectronics N.V. (STM) | Cirrus Logic, Inc. (CRUS) |
|---|---|---|
| ROE | 9.0% | 17.0% |
| ROIC | 6.3% | 14.2% |
| P/E | 14.4 | 15.9 |
| P/B | 1.29 | 2.71 |
| Current Ratio | 3.11 | 6.35 |
| Quick Ratio | 2.37 | 4.82 |
| D/E | 0.18 | 0.07 |
| Debt-to-Assets | 12.8% | 6.2% |
| Interest Coverage | 19.7 | 457.0 |
| Asset Turnover | 0.54 | 0.81 |
| Fixed Asset Turnover | 1.22 | 6.62 |
| Payout ratio | 18.5% | 0% |
| Dividend yield | 1.28% | 0% |
| Fiscal Year | 2025 | 2025 |
Efficiency & Valuation Duel: The Vital Signs
Ratios act as a company’s DNA, exposing hidden risks and operational strengths that guide smarter investment decisions.
STMicroelectronics N.V.
STMicroelectronics shows weak profitability with ROE at 0.93% and net margin at 1.41%, signaling operational challenges. Its valuation metrics like P/E and P/B are favorable but lack market pricing due to zero reported P/E. The company reinvests heavily in R&D (15.7% of revenue), foregoing dividends, which may support future growth but raises near-term uncertainty.
Cirrus Logic, Inc.
Cirrus Logic delivers strong profitability with a 17.01% ROE and a robust 17.48% net margin, reflecting efficient operations. Its valuation is moderately priced with a P/E of 15.95 and P/B of 2.71, aligning with industry norms. The firm does not pay dividends but focuses on R&D (22.9% of revenue), underpinning sustained innovation and shareholder value.
Operational Efficiency vs. Profitability Premium
Cirrus Logic offers a superior balance of profitability and valuation, with more favorable ratios and strong operational returns. STMicroelectronics presents a riskier profile with weak profitability but solid capital reinvestment. Investors seeking stable earnings and moderate valuation may prefer Cirrus Logic, while those favoring growth via R&D reinvestment might consider STMicroelectronics.
Which one offers the Superior Shareholder Reward?
I see STMicroelectronics (STM) pays a modest dividend yield around 1.28% in 2025, with a payout ratio near 18%, signaling a balanced approach to shareholder returns. However, its free cash flow per share turned negative in 2025, hinting at short-term distribution pressure. STM complements dividends with moderate buybacks, underpinning total returns but risking sustainability given recent cash flow declines. Cirrus Logic (CRUS) pays no dividends but boasts robust free cash flow per share around 7.8, enabling aggressive buybacks that enhance shareholder value. CRUS’s minimal debt and strong operating cash flow coverage support this reinvestment-heavy strategy. Historically, I’ve observed that in tech sectors, buybacks fueled by strong free cash flow often outpace modest dividends in total returns. Thus, for 2026 investors seeking superior reward with sustainable capital allocation, CRUS’s buyback-driven model offers a more attractive total return profile than STM’s cautious dividend-plus-buyback approach.
Comparative Score Analysis: The Strategic Profile
The radar chart reveals the fundamental DNA and trade-offs that shape the strategic profiles of STMicroelectronics and Cirrus Logic:
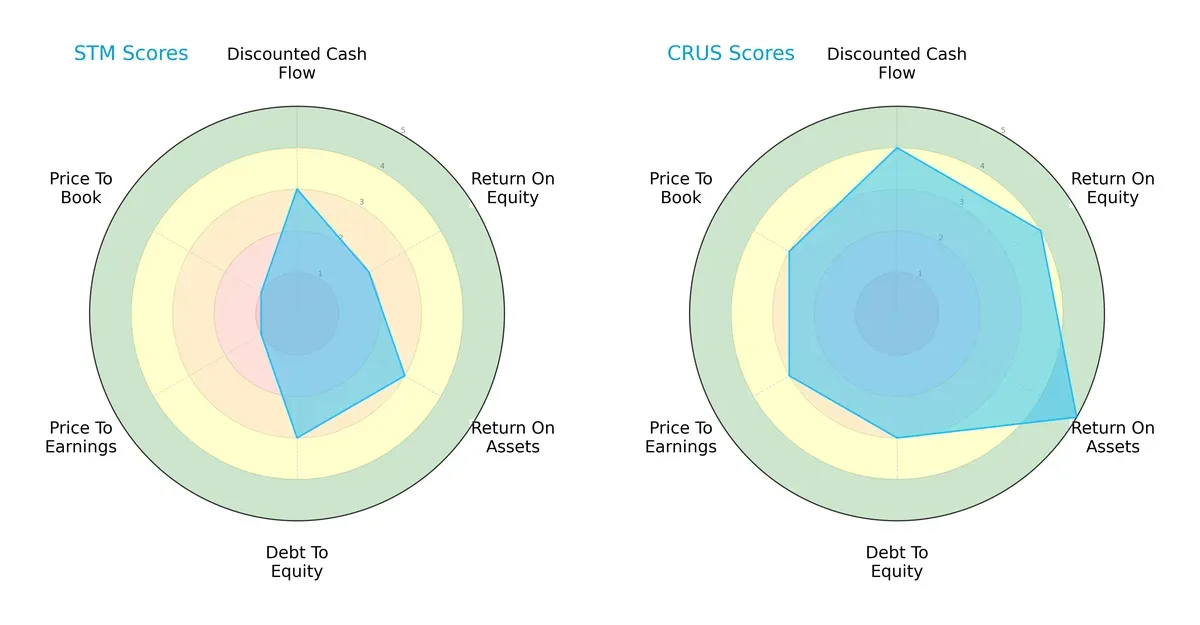
Cirrus Logic dominates in profitability with superior ROE (4 vs. 2) and ROA (5 vs. 3) scores. It also leads in discounted cash flow valuation (4 vs. 3), indicating better future cash generation visibility. Both firms share moderate debt-to-equity discipline (3 each), but STMicroelectronics lags significantly on valuation metrics (P/E and P/B both at 1), signaling potential overvaluation or market skepticism. Cirrus Logic delivers a more balanced and favorable score profile, while STMicroelectronics relies heavily on moderate operational scores but suffers from valuation concerns.
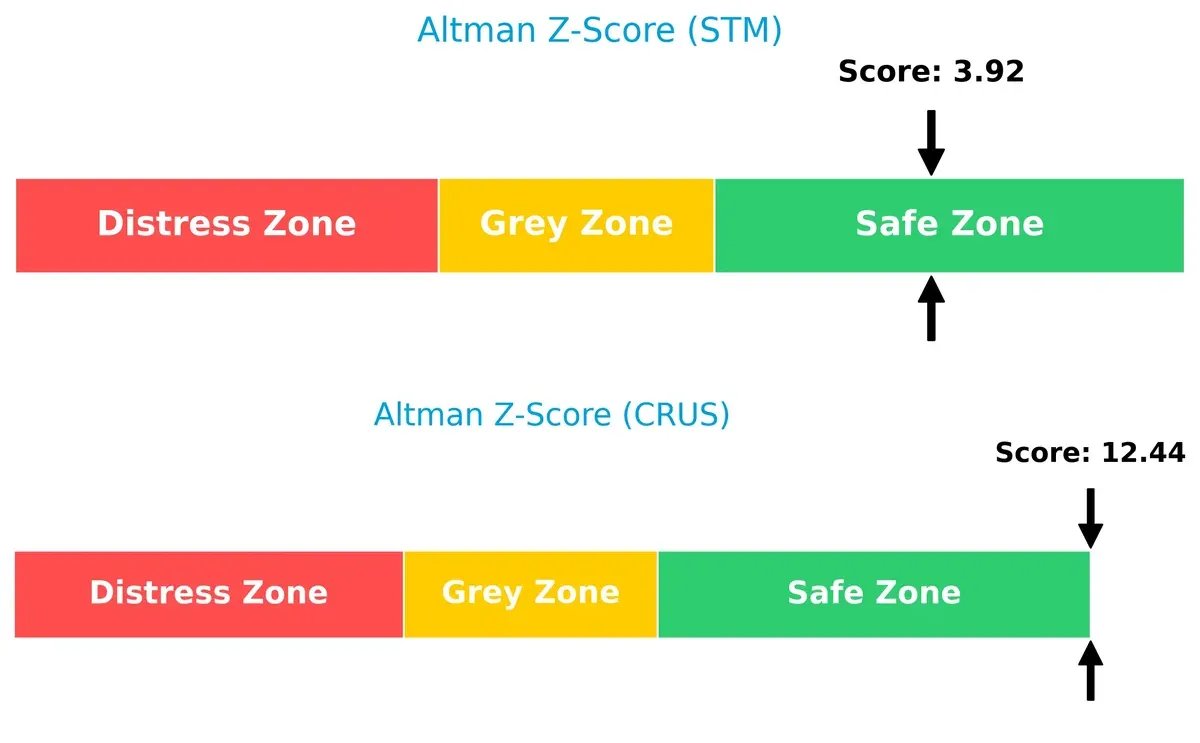
Bankruptcy Risk: Solvency Showdown
Cirrus Logic’s Altman Z-Score of 12.4 far exceeds STMicroelectronics’ 3.9, placing both comfortably in the safe zone, but highlighting Cirrus Logic’s superior long-term solvency and lower bankruptcy risk in the current cycle:
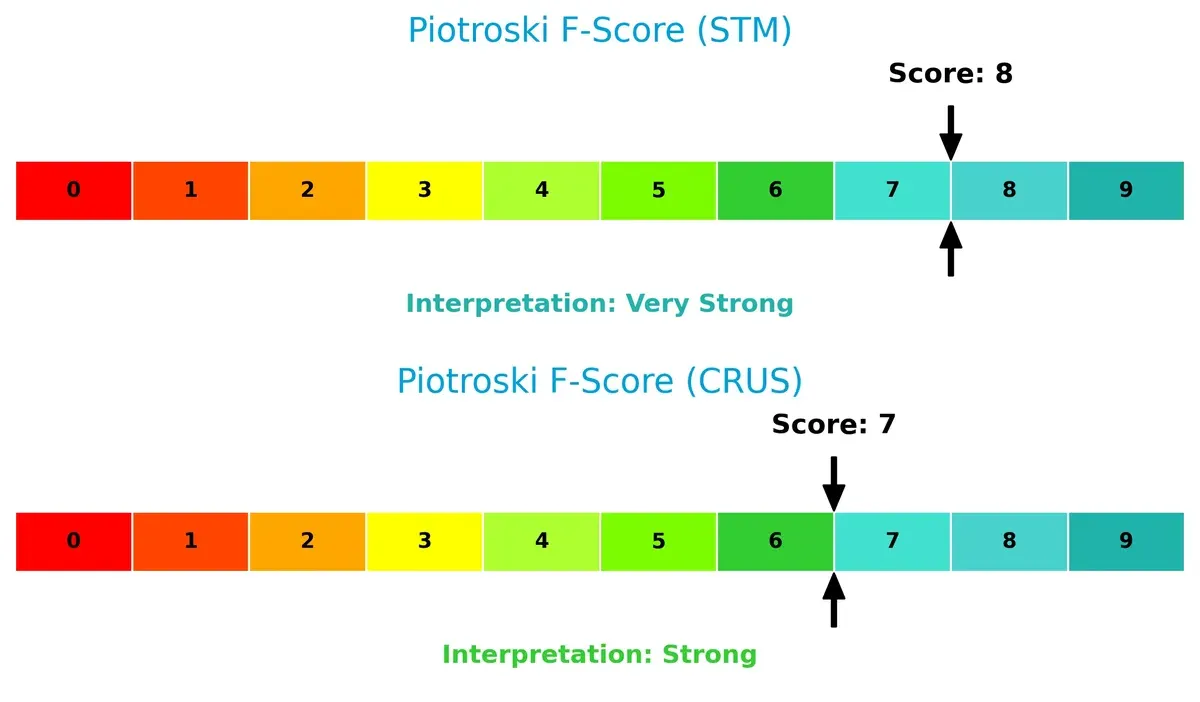
Financial Health: Quality of Operations
STMicroelectronics scores 8 on the Piotroski F-Score, narrowly outperforming Cirrus Logic’s 7. Both demonstrate strong internal financial health, but STMicroelectronics edges ahead, suggesting slightly better quality in profitability, leverage, and efficiency metrics despite valuation concerns:
How are the two companies positioned?
This section dissects STM and CRUS’s operational DNA by comparing revenue distribution and internal dynamics. The goal is to confront their economic moats and identify which model offers the most resilient competitive advantage today.
Revenue Segmentation: The Strategic Mix
This visual comparison dissects how STMicroelectronics and Cirrus Logic diversify their income streams and highlights their primary sector bets:
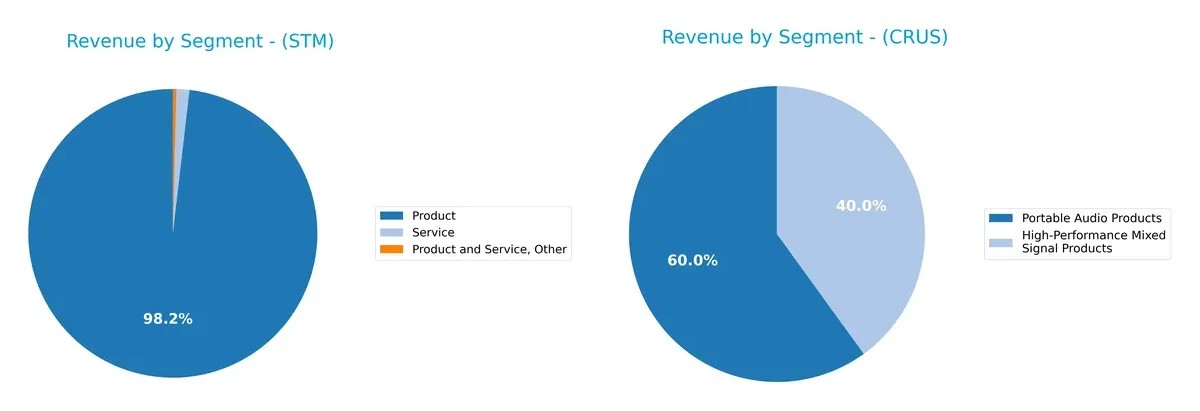
STMicroelectronics anchors its revenue on a dominant product segment, hitting $13.2B in 2024, with services and other smaller categories trailing far behind. This concentration underscores its infrastructure dominance but poses concentration risk. Cirrus Logic pivots between two close rivals: Portable Audio Products at $1.14B and High-Performance Mixed Signal Products at $759M, showcasing a more balanced, diversified portfolio. Cirrus’s mix reduces exposure to a single market, enhancing resilience.
Strengths and Weaknesses Comparison
This table compares the Strengths and Weaknesses of STMicroelectronics (STM) and Cirrus Logic (CRUS):
STM Strengths
- Diversified product segments including automotive, microcontrollers, and analog technologies
- Strong global presence in Asia Pacific and Americas
- Favorable debt levels with low debt-to-assets ratio
- High quick ratio indicates good liquidity management
CRUS Strengths
- High profitability with strong net margin, ROE, and ROIC
- Favorable asset turnover, especially fixed assets
- Low debt levels and excellent interest coverage
- Innovation focus on mixed signal and portable audio products
STM Weaknesses
- Low profitability metrics with unfavorable net margin and ROE
- Asset turnover below optimal levels
- High current ratio may indicate inefficient asset use
- No dividend yield signals potential lack of shareholder returns
CRUS Weaknesses
- High current ratio suggests possible inefficiencies in working capital
- Neutral valuation multiples may limit upside
- Zero dividend yield could deter income-focused investors
STM’s strengths lie in its diversified product and geographic footprint with solid liquidity and conservative leverage. However, low profitability and asset efficiency pose challenges. CRUS excels in profitability and operational efficiency but faces working capital concerns. Both companies show no dividend yield, impacting income strategies.
The Moat Duel: Analyzing Competitive Defensibility
A structural moat is the only lasting barrier protecting long-term profits from relentless competitive erosion. Let’s dissect how two semiconductor firms defend their turf:
STMicroelectronics N.V.: Diversified Product Breadth Moat
I see STMicroelectronics’ advantage in its broad product portfolio across automotive, industrial, and consumer segments. However, its eroding ROIC and shrinking margins signal a weakening moat. New markets in power transistors offer some hope but face stiff competition in 2026.
Cirrus Logic, Inc.: Specialized Innovation Moat
Cirrus Logic’s moat stems from specialized mixed-signal audio processing and proprietary SoundClear technology. It commands robust margins and growing ROIC, outperforming peers. Expansion into automotive entertainment and AR/VR audio could amplify this moat in 2026.
Verdict: Breadth vs. Depth in Semiconductor Moats
STMicroelectronics’ wide but fading moat contrasts with Cirrus Logic’s narrower but deepening competitive edge. I judge Cirrus Logic’s moat as stronger and more durable. It stands better positioned to defend and grow market share amid industry shifts.
Which stock offers better returns?
The past year shows contrasting trajectories: STMicroelectronics N.V. declines sharply overall but gains recently, while Cirrus Logic, Inc. maintains a strong bullish momentum with accelerating growth.
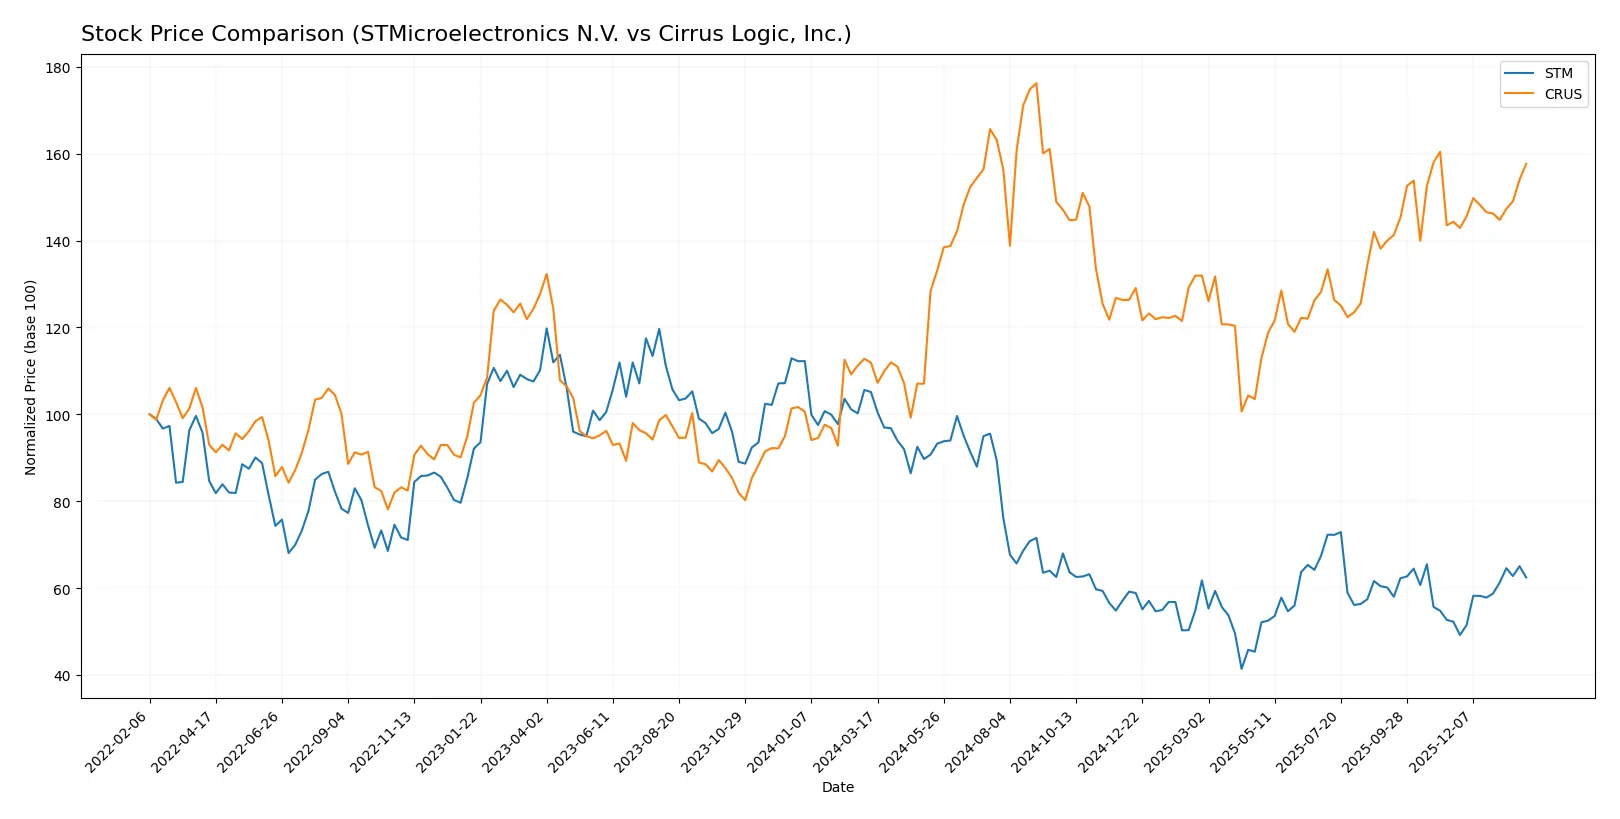
Trend Comparison
STMicroelectronics N.V. experiences a 40.6% price drop over the past year, confirming a bearish trend with accelerating decline and a high volatility of 6.77. Recent months show a 19.49% rebound.
Cirrus Logic, Inc. posts a 40.89% price increase over the past year, reflecting a bullish trend with accelerating gains. Volatility is higher at 14.44, with a 9.24% rise recently.
Cirrus Logic outperforms STMicroelectronics, delivering the highest market return with sustained bullish momentum versus STM’s overall decline despite recent recovery.
Target Prices
Analysts present a bullish consensus for STMicroelectronics and Cirrus Logic, reflecting confidence in their semiconductor market positions.
| Company | Target Low | Target High | Consensus |
|---|---|---|---|
| STMicroelectronics N.V. | 28 | 45 | 37.67 |
| Cirrus Logic, Inc. | 100 | 155 | 138.75 |
STMicroelectronics’ consensus target of 37.67 exceeds its current price of 27.89, suggesting upside potential. Cirrus Logic’s target consensus of 138.75 also surpasses its current 130.34 price, indicating positive analyst sentiment.

Don’t Let Luck Decide Your Entry Point
Optimize your entry points with our advanced ProRealTime indicators. You’ll get efficient buy signals with precise price targets for maximum performance. Start outperforming now!
How do institutions grade them?
Institutional grades for STMicroelectronics N.V. and Cirrus Logic, Inc. show a consistent view of each company’s outlook:
STMicroelectronics N.V. Grades
This table summarizes recent grades from well-known financial institutions for STMicroelectronics N.V.
| Grading Company | Action | New Grade | Date |
|---|---|---|---|
| TD Cowen | Maintain | Buy | 2025-10-24 |
| Susquehanna | Maintain | Positive | 2025-10-22 |
| Susquehanna | Maintain | Positive | 2025-07-25 |
| Baird | Upgrade | Outperform | 2025-07-22 |
| Susquehanna | Maintain | Positive | 2025-07-22 |
| Jefferies | Upgrade | Buy | 2025-02-19 |
| Bernstein | Downgrade | Market Perform | 2025-02-05 |
| Susquehanna | Maintain | Positive | 2025-01-31 |
| Barclays | Downgrade | Underweight | 2025-01-22 |
| JP Morgan | Downgrade | Neutral | 2024-12-09 |
Cirrus Logic, Inc. Grades
This table presents recent ratings from major grading firms on Cirrus Logic, Inc.
| Grading Company | Action | New Grade | Date |
|---|---|---|---|
| Keybanc | Maintain | Overweight | 2025-11-05 |
| Barclays | Maintain | Equal Weight | 2025-11-05 |
| Benchmark | Maintain | Buy | 2025-11-05 |
| Stifel | Maintain | Buy | 2025-11-05 |
| Susquehanna | Maintain | Positive | 2025-10-22 |
| Stifel | Maintain | Buy | 2025-10-17 |
| Stifel | Maintain | Buy | 2025-09-12 |
| Barclays | Maintain | Equal Weight | 2025-05-07 |
| Barclays | Maintain | Equal Weight | 2025-04-22 |
| Stifel | Maintain | Buy | 2025-04-17 |
Which company has the best grades?
Cirrus Logic consistently earns “Buy” and “Overweight” ratings, signaling strong institutional confidence. STMicroelectronics shows a mixed outlook with upgrades but also multiple downgrades, suggesting more cautious sentiment. Investors might interpret Cirrus Logic’s steadier positive grades as a sign of relative favorability among analysts.
Risks specific to each company
The following categories identify the critical pressure points and systemic threats facing both firms in the 2026 market environment:
1. Market & Competition
STMicroelectronics N.V.
- Faces intense competition in broad semiconductor markets with automotive and industrial segments vulnerable to cyclical downturns.
Cirrus Logic, Inc.
- Operates in niche mixed-signal audio and industrial chips, but heavy dependence on consumer electronics exposes it to rapid tech shifts.
2. Capital Structure & Debt
STMicroelectronics N.V.
- Maintains a low debt-to-equity ratio (0.12), signaling conservative leverage and strong interest coverage.
Cirrus Logic, Inc.
- Even lower leverage (0.07) with robust interest coverage, indicating solid financial flexibility and lower default risk.
3. Stock Volatility
STMicroelectronics N.V.
- Beta at 1.29 suggests higher volatility than the market, exposing investors to amplified market swings.
Cirrus Logic, Inc.
- Lower beta of 1.08 indicates less volatility, providing a comparatively stable equity profile.
4. Regulatory & Legal
STMicroelectronics N.V.
- Global footprint subjects it to complex international trade regulations and export controls in semiconductor supply chains.
Cirrus Logic, Inc.
- Primarily US-based but exposed to tightening US tech export policies and IP litigation risks.
5. Supply Chain & Operations
STMicroelectronics N.V.
- Large-scale manufacturing faces risks from component shortages and geopolitical tensions affecting Asia supply routes.
Cirrus Logic, Inc.
- Fabless model reduces capital intensity but increases dependency on foundry partners and raw material availability.
6. ESG & Climate Transition
STMicroelectronics N.V.
- Increasing regulations pressure semiconductor makers to improve energy efficiency and reduce carbon footprint.
Cirrus Logic, Inc.
- Smaller scale eases ESG compliance complexity but risks lagging in sustainability leadership relative to peers.
7. Geopolitical Exposure
STMicroelectronics N.V.
- Significant exposure to Europe and Asia-Pacific, vulnerable to EU-China tensions and supply chain disruptions.
Cirrus Logic, Inc.
- US-centric with some international sales, exposed mainly to US-China tech rivalry and related export restrictions.
Which company shows a better risk-adjusted profile?
Cirrus Logic faces less volatility and stronger financial metrics, with a focused niche and lower leverage risks. STMicroelectronics, despite solid capital structure, endures broader market cyclicality and complex geopolitical pressures. Cirrus Logic’s favorable Altman Z-score (12.44 vs. 3.92) and strong Piotroski score confirm superior financial health and resilience. The primary risk for STMicroelectronics is its broad market exposure amid global supply chain fragility. For Cirrus Logic, reliance on consumer electronics trends poses the greatest threat. Overall, Cirrus Logic offers a more balanced risk-return profile in 2026’s semiconductor landscape.
Final Verdict: Which stock to choose?
STMicroelectronics (STM) excels as a cash-generating powerhouse with a robust balance sheet and strong liquidity. However, its declining profitability and shrinking returns on invested capital remain points of vigilance. STM could fit portfolios seeking cyclical exposure with a tolerance for operational headwinds.
Cirrus Logic (CRUS) boasts a durable strategic moat grounded in high-margin audio and semiconductor niches. Its consistent value creation and improving profitability offer a safer profile relative to STM. CRUS suits investors favoring steady growth combined with solid fundamentals and margin resilience.
If you prioritize growth backed by a durable moat and superior capital efficiency, Cirrus Logic outshines STM with its rising ROIC and strong income statement momentum. However, if you seek exposure to a sector heavyweight with ample liquidity and cyclical upside potential, STM offers a compelling, albeit riskier, scenario.
Disclaimer: Investment carries a risk of loss of initial capital. The past performance is not a reliable indicator of future results. Be sure to understand risks before making an investment decision.
Go Further
I encourage you to read the complete analyses of STMicroelectronics N.V. and Cirrus Logic, Inc. to enhance your investment decisions: