Home > Comparison > Technology > NXPI vs CRUS
The strategic rivalry between NXP Semiconductors N.V. and Cirrus Logic, Inc. shapes the semiconductor industry’s evolution. NXP operates as a diversified technology powerhouse with a broad product portfolio spanning automotive to IoT applications. Cirrus Logic focuses on high-precision, low-power mixed-signal audio and industrial ICs. This analysis explores their contrasting business models and market positions to identify which offers superior risk-adjusted returns for a balanced technology portfolio.
Table of contents
Companies Overview
NXP Semiconductors and Cirrus Logic dominate distinct niches within the semiconductor industry, shaping technology’s future.
NXP Semiconductors N.V.: Global semiconductor innovator
NXP Semiconductors commands a broad semiconductor portfolio with products spanning microcontrollers, communication processors, and wireless connectivity solutions. Its core revenue stems from supplying automotive, industrial, and IoT markets. In 2026, NXP focuses on expanding its automotive and communication infrastructure segments to leverage growing connected vehicle and 5G deployment trends.
Cirrus Logic, Inc.: Specialist in mixed-signal audio solutions
Cirrus Logic excels in low-power mixed-signal processing, primarily through audio codecs and sound enhancement technologies. It generates revenue by embedding these solutions in consumer electronics like smartphones and AR/VR headsets. Cirrus Logic’s 2026 strategy emphasizes advancing audio fidelity and expanding into industrial energy applications, reflecting a dual focus on consumer and industrial markets.
Strategic Collision: Similarities & Divergences
While both excel in semiconductors, NXP pursues a diversified product ecosystem with a strong automotive and IoT focus. Cirrus Logic adopts a specialized approach targeting audio and precision mixed-signal markets. Their primary battleground lies in embedded systems for mobile and industrial devices. Investors should note NXP’s scale and broad reach contrast with Cirrus Logic’s niche leadership and innovation intensity.
Income Statement Comparison
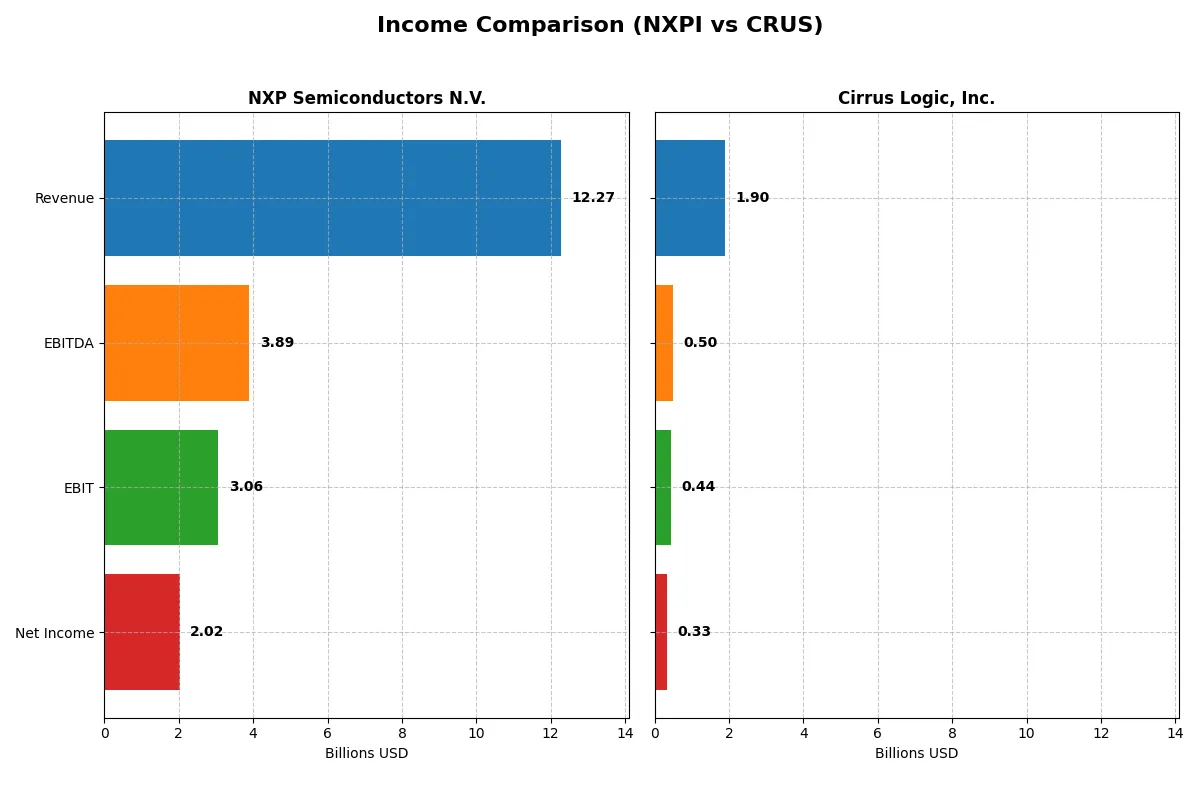
This data dissects the core profitability and scalability of both corporate engines to reveal who dominates the bottom line:
| Metric | NXP Semiconductors N.V. (NXPI) | Cirrus Logic, Inc. (CRUS) |
|---|---|---|
| Revenue | 12.27B | 1.90B |
| Cost of Revenue | 5.59B | 900M |
| Operating Expenses | 3.37B | 586M |
| Gross Profit | 6.68B | 996M |
| EBITDA | 3.89B | 497M |
| EBIT | 3.06B | 445M |
| Interest Expense | 384M | 900K |
| Net Income | 2.02B | 332M |
| EPS | 8.00 | 6.24 |
| Fiscal Year | 2025 | 2025 |
Income Statement Analysis: The Bottom-Line Duel
This income statement comparison reveals which corporate engine runs with superior efficiency and growth momentum in today’s semiconductor landscape.
NXP Semiconductors N.V. Analysis
NXP’s revenue declined 2.7% to $12.3B in 2025, pulling net income down 19% to $2.0B. Despite this, it maintains strong gross (54.4%) and net margins (16.5%), reflecting solid cost control. Yet, the recent margin compression signals challenges in sustaining prior profitability levels amid market pressures.
Cirrus Logic, Inc. Analysis
Cirrus Logic grew revenue 6% to $1.9B and boosted net income 21% to $331M in 2025. Its gross margin stands at 52.5%, with a net margin of 17.5%, both favorable. Cirrus exhibits robust momentum and expanding profitability, highlighting efficient capital allocation and operational leverage.
Margin Consistency vs. Growth Momentum
NXP delivers scale and historically stable margins but faces recent earnings pressure and shrinking profits. Cirrus, while smaller, outpaces NXP in revenue and net income growth with expanding margins. For investors, Cirrus offers a more dynamic growth profile, whereas NXP presents a mature but pressured profitability base.
Financial Ratios Comparison
These vital ratios act as a diagnostic tool to expose the underlying fiscal health, valuation premiums, and capital efficiency of each company:
| Ratios | NXP Semiconductors N.V. (NXPI) | Cirrus Logic, Inc. (CRUS) |
|---|---|---|
| ROE | 20.10% | 17.01% |
| ROIC | 11.03% | 14.20% |
| P/E | 27.14 | 15.95 |
| P/B | 5.45 | 2.71 |
| Current Ratio | 2.05 | 6.35 |
| Quick Ratio | 1.38 | 4.82 |
| D/E | 1.22 | 0.07 |
| Debt-to-Assets | 46.02% | 6.18% |
| Interest Coverage | 8.62 | 456.97 |
| Asset Turnover | 0.46 | 0.81 |
| Fixed Asset Turnover | 4.12 | 6.62 |
| Payout ratio | 50.72% | 0% |
| Dividend yield | 1.87% | 0% |
| Fiscal Year | 2025 | 2025 |
Efficiency & Valuation Duel: The Vital Signs
Ratios act as a company’s DNA, unveiling hidden risks and operational excellence that shape investor decisions and stock performance.
NXP Semiconductors N.V.
NXP shows strong profitability with a 20.1% ROE and healthy 16.47% net margin, but its valuation appears stretched at a 27.14 P/E. The firm balances risk with a solid 2.05 current ratio and a 1.87% dividend yield, signaling shareholder returns through moderate dividends and stable operations.
Cirrus Logic, Inc.
Cirrus Logic delivers favorable profitability and efficiency, with a 17.01% ROE and 17.48% net margin, coupled with a more reasonable 15.95 P/E. The company stands out for low debt (0.07 D/E) and a robust quick ratio of 4.82, yet lacks dividends, likely reinvesting heavily in R&D to sustain growth.
Premium Valuation vs. Operational Safety
NXP’s higher valuation reflects confidence in its profitability but introduces valuation risk. Cirrus Logic’s metrics suggest a healthier balance sheet and efficient capital use with less valuation stretch. Investors favoring stability and reinvestment may lean towards Cirrus, while those accepting premium pricing for strong returns might consider NXP.
Which one offers the Superior Shareholder Reward?
I observe NXP Semiconductors (NXPI) delivers steady dividends with a 1.87% yield and a moderate 51% payout ratio, signaling balanced cash return. NXPI also supports buybacks, enhancing total shareholder return sustainably. Cirrus Logic (CRUS) pays no dividends, reinvesting all FCF into growth and acquisitions. CRUS boasts stronger operating cash flow ratios and minimal debt, but lacks immediate cash returns. For income-focused investors, NXPI’s dividend and buyback mix offers superior, more predictable rewards in 2026. Growth-focused investors might prefer CRUS’s reinvestment approach, though it carries higher risk without current yield. Overall, I favor NXPI for its sustainable, total return profile combining dividends and buybacks.
Comparative Score Analysis: The Strategic Profile
The radar chart reveals the fundamental DNA and trade-offs of NXP Semiconductors N.V. and Cirrus Logic, Inc., highlighting their distinct financial strengths and valuation approaches:
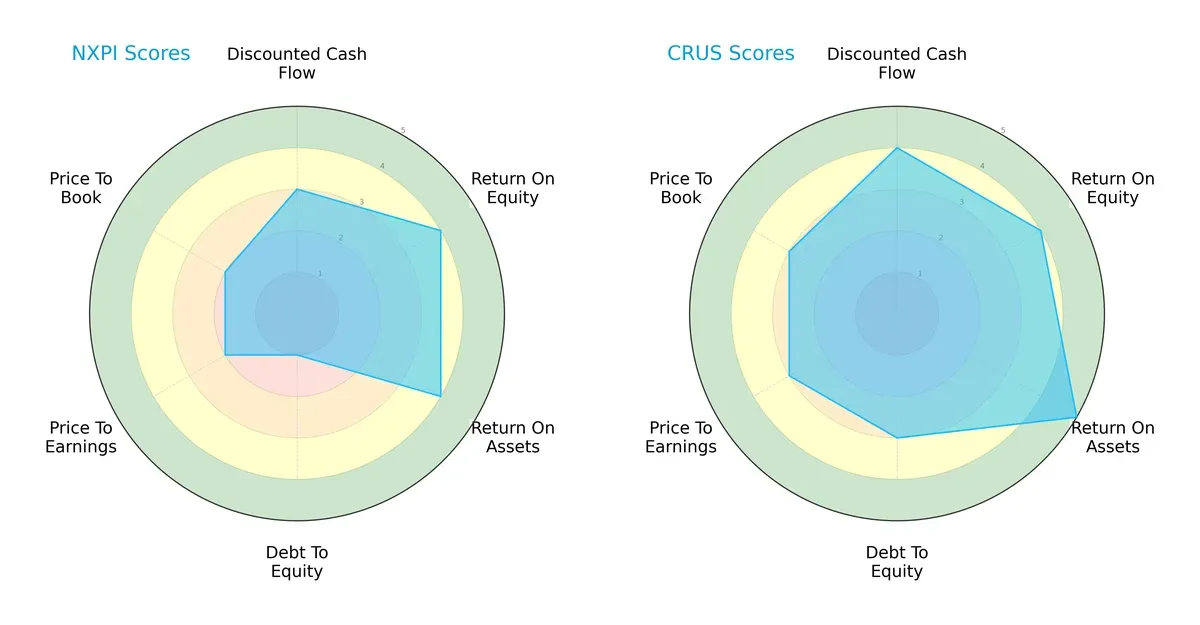
Cirrus Logic demonstrates a more balanced financial profile with strong DCF (4), ROE (4), ROA (5), and moderate Debt/Equity (3). NXP shows favorable profitability (ROE 4, ROA 4) but suffers from a weak balance sheet (Debt/Equity 1) and less attractive valuation scores (P/E 2, P/B 2). Cirrus relies on both operational efficiency and prudent leverage, while NXP leans heavily on profitability despite financial risks.
Bankruptcy Risk: Solvency Showdown
The Altman Z-Score gap between Cirrus Logic (15.7) and NXP (3.1) signals a stark contrast in long-term solvency:
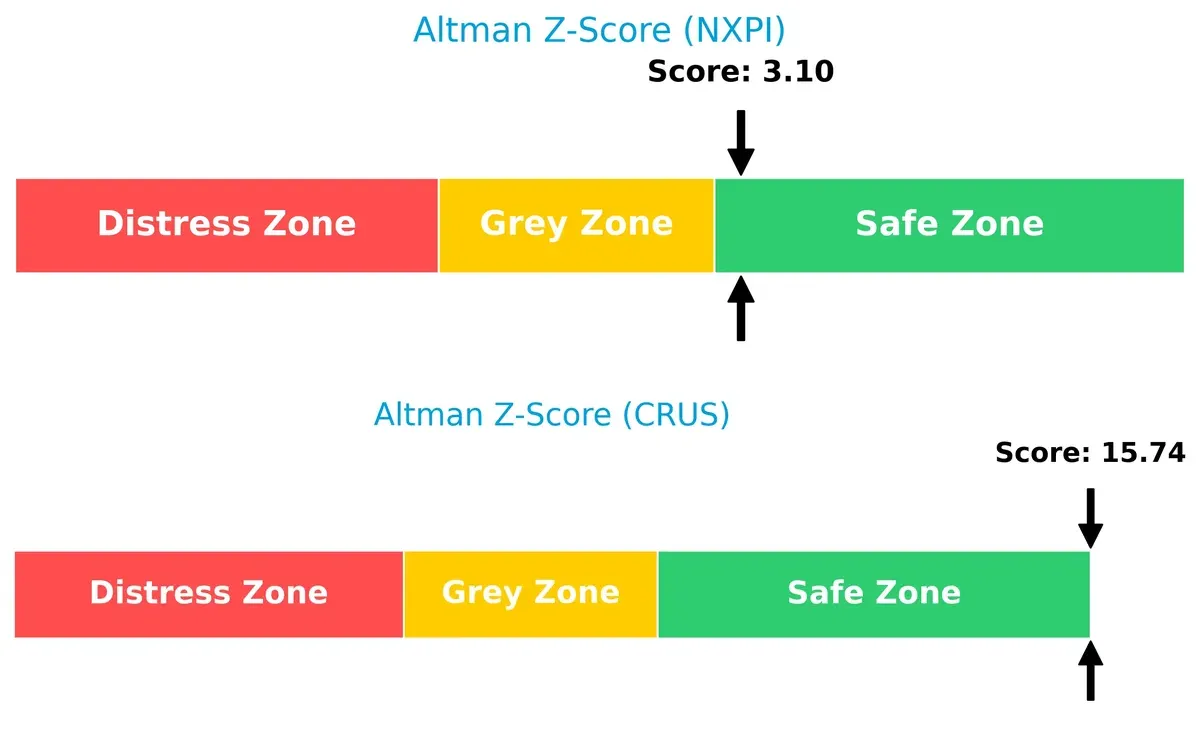
Cirrus Logic sits comfortably in the safe zone, indicating robust financial stability and low bankruptcy risk. NXP, while also in the safe zone, is much closer to the distress threshold, reflecting higher leverage and potential vulnerability if market conditions worsen.
Financial Health: Quality of Operations
Comparing Piotroski F-Scores reveals internal operational quality differences:
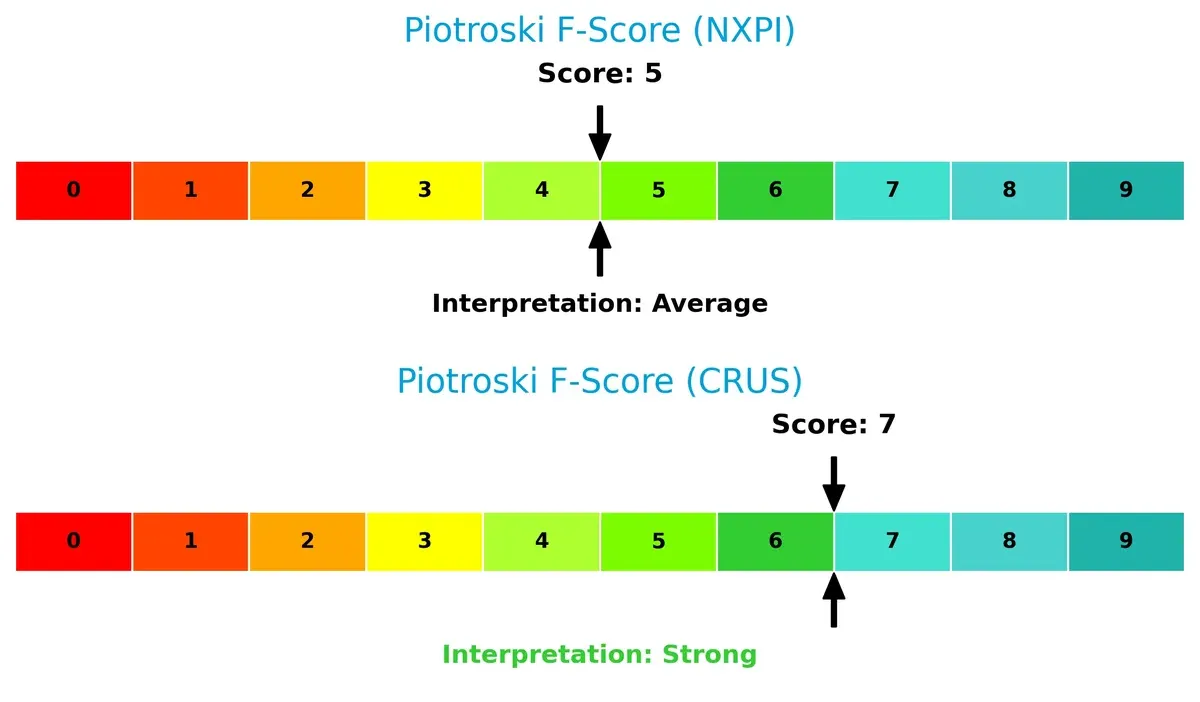
Cirrus Logic’s score of 7 suggests strong financial health with solid profitability, liquidity, and efficiency. NXP’s score of 5, though average, raises caution due to weaker internal metrics, potentially signaling operational or financial red flags compared to its peer.
How are the two companies positioned?
This section dissects NXPI and CRUS’s operational DNA by comparing revenue distribution and internal dynamics. The goal is to confront their economic moats, revealing which model offers a more resilient, sustainable advantage today.
Revenue Segmentation: The Strategic Mix
This visual comparison dissects how NXP Semiconductors and Cirrus Logic diversify income streams and where their primary sector bets lie:
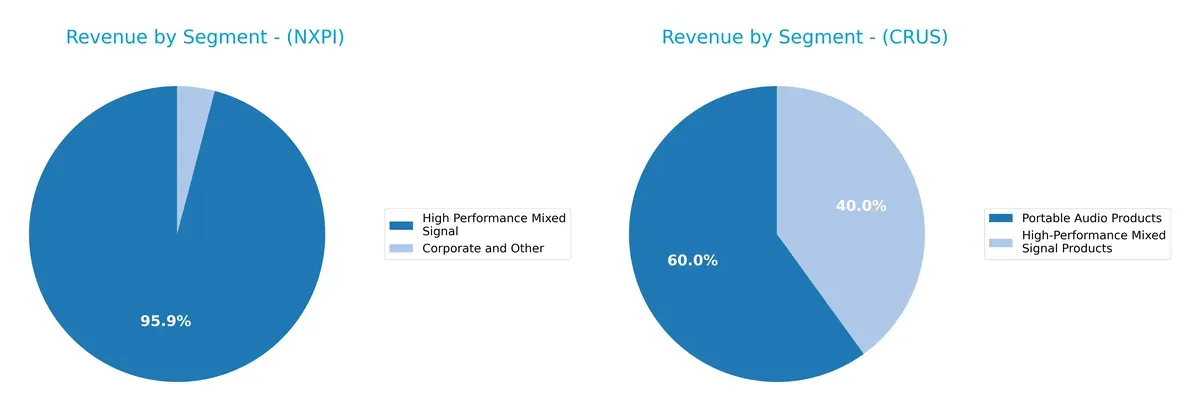
NXP Semiconductors anchors revenue in High Performance Mixed Signal, with $9B in 2018 dwarfing other segments, showing a focused, infrastructure-driven strategy. Cirrus Logic pivots between Portable Audio ($1.14B) and High-Performance Mixed Signal ($759M) in 2025, revealing a more balanced but still niche exposure. NXP’s concentration risks contrast with Cirrus’s diversified audio ecosystem, which may offer resilience amid market shifts.
Strengths and Weaknesses Comparison
This table compares the strengths and weaknesses of NXP Semiconductors N.V. and Cirrus Logic, Inc.:
NXP Semiconductors N.V. Strengths
- Strong profitability with 16.47% net margin
- High ROE of 20.1% indicates efficient capital use
- Solid liquidity with current ratio of 2.05
- Diversified global presence across major markets including China and US
- Favorable fixed asset turnover of 4.12
Cirrus Logic, Inc. Strengths
- Higher net margin at 17.48% shows better profitability
- Strong ROIC of 14.2% surpasses WACC, indicating value creation
- Low debt-to-equity ratio of 0.07 reduces financial risk
- Exceptional interest coverage at 495.45 signals strong earnings
- Growing revenue from portable audio and mixed signal products
NXP Semiconductors N.V. Weaknesses
- Elevated debt-to-equity at 1.22 raises leverage concerns
- Unfavorable P/E of 27.14 suggests possible overvaluation
- Asset turnover of 0.46 indicates less efficient asset use
- Moderate dividend yield at 1.87% may limit income appeal
Cirrus Logic, Inc. Weaknesses
- Very high current ratio of 6.35 could indicate inefficient asset use
- Zero dividend yield reduces income for investors
- P/E and P/B ratios are neutral but lack value premium
- Less geographic diversification with significant China reliance
Both companies demonstrate robust profitability and favorable capital returns, but NXP carries higher leverage and valuation risks. Cirrus Logic excels in low leverage and operational efficiency but shows signs of potential asset underutilization and limited dividend income. These factors shape their financial resilience and strategic options moving forward.
The Moat Duel: Analyzing Competitive Defensibility
A structural moat alone protects long-term profits from relentless competitive pressures. Here’s how NXP Semiconductors and Cirrus Logic defend their turf:
NXP Semiconductors N.V.: Broad Product Ecosystem Moat
NXP’s moat stems from its diverse product portfolio spanning automotive to IoT, embedding high switching costs. Despite a solid 24.95% EBIT margin, its ROIC trails WACC with a declining trend, signaling eroding efficiency. New markets in wireless connectivity could either strengthen or strain this position in 2026.
Cirrus Logic, Inc.: Focused Innovation and Value Creation Moat
Cirrus Logic leverages specialized mixed-signal audio solutions, creating a niche moat based on intangible assets and innovation. Its ROIC outpaces WACC by over 5%, with a rising trend, underscoring efficient capital use and growing profitability. Expansion in AR/VR and automotive audio offers promising growth avenues.
Specialized Innovation vs. Broad Ecosystem: The Moat Battle
Cirrus Logic’s focused, innovation-driven moat is both wider and deeper than NXP’s broad but weakening ecosystem moat. I see Cirrus better positioned to sustain profits and defend market share through efficient capital allocation and targeted growth.
Which stock offers better returns?
The past year reveals contrasting dynamics: NXP Semiconductors shows an overall decline with recent recovery, while Cirrus Logic posts strong gains and consistent buyer dominance.
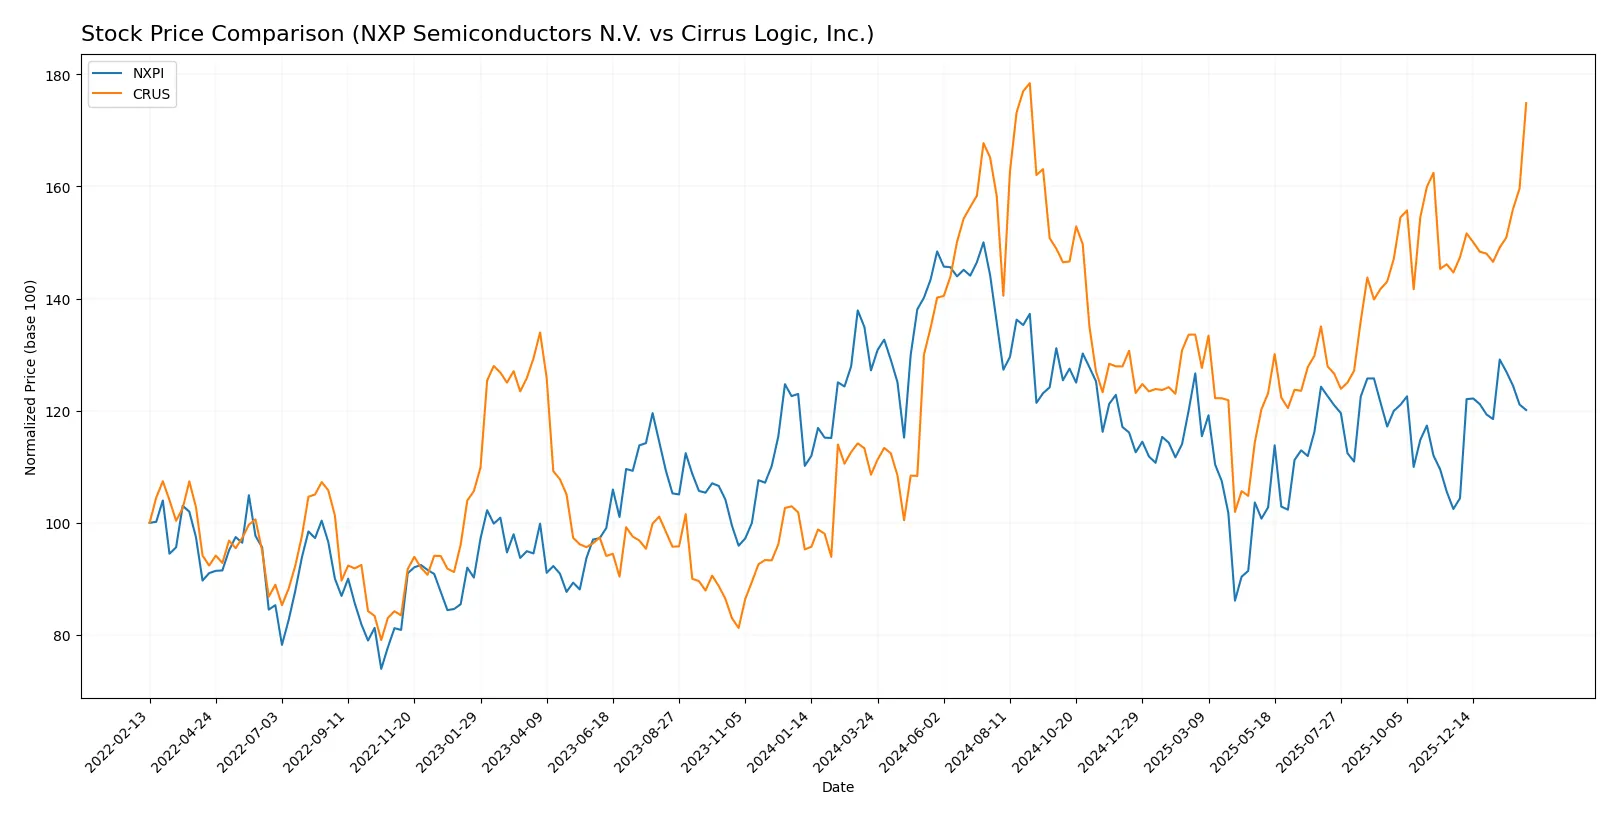
Trend Comparison
NXP Semiconductors’ stock fell 5.57% over the past year, marking a bearish trend with accelerating decline from a high of 280.19 to a low of 160.81.
Cirrus Logic’s stock rose 61.02% in the same period, reflecting a bullish trend with accelerating gains, supported by a lower volatility and a high near 145.69.
Cirrus Logic delivered significantly higher market performance than NXP Semiconductors, showing robust upward momentum and stronger buyer activity.
Target Prices
Analysts show a moderately bullish consensus for NXP Semiconductors and Cirrus Logic.
| Company | Target Low | Target High | Consensus |
|---|---|---|---|
| NXP Semiconductors N.V. | 215 | 280 | 250 |
| Cirrus Logic, Inc. | 110 | 163 | 144.5 |
NXP’s consensus target of 250 exceeds its current price of 224, indicating upside potential. Cirrus Logic’s 144.5 consensus aligns closely with its 143 price, suggesting limited near-term gains.

Don’t Let Luck Decide Your Entry Point
Optimize your entry points with our advanced ProRealTime indicators. You’ll get efficient buy signals with precise price targets for maximum performance. Start outperforming now!
How do institutions grade them?
NXP Semiconductors N.V. Grades
The latest institutional grades for NXP Semiconductors N.V. are summarized in the table below.
| Grading Company | Action | New Grade | Date |
|---|---|---|---|
| B of A Securities | Maintain | Buy | 2026-02-04 |
| Truist Securities | Maintain | Buy | 2026-02-04 |
| Citigroup | Maintain | Buy | 2026-02-04 |
| Evercore ISI Group | Maintain | Outperform | 2026-02-04 |
| Mizuho | Maintain | Outperform | 2026-02-04 |
| JP Morgan | Maintain | Neutral | 2026-02-04 |
| Needham | Maintain | Buy | 2026-02-03 |
| Citigroup | Maintain | Buy | 2026-01-15 |
| Wells Fargo | Maintain | Overweight | 2026-01-15 |
| Truist Securities | Maintain | Buy | 2025-12-19 |
Cirrus Logic, Inc. Grades
Below is the compilation of recent institutional grades for Cirrus Logic, Inc.
| Grading Company | Action | New Grade | Date |
|---|---|---|---|
| Stifel | Maintain | Buy | 2026-02-04 |
| Benchmark | Maintain | Buy | 2026-02-04 |
| Barclays | Maintain | Equal Weight | 2026-02-04 |
| Benchmark | Maintain | Buy | 2025-11-05 |
| Barclays | Maintain | Equal Weight | 2025-11-05 |
| Keybanc | Maintain | Overweight | 2025-11-05 |
| Stifel | Maintain | Buy | 2025-11-05 |
| Susquehanna | Maintain | Positive | 2025-10-22 |
| Stifel | Maintain | Buy | 2025-10-17 |
| Stifel | Maintain | Buy | 2025-09-12 |
Which company has the best grades?
NXP Semiconductors holds generally stronger grades with multiple “Buy” and “Outperform” ratings from diverse top-tier firms. Cirrus Logic mostly receives “Buy” and “Equal Weight” ratings. This difference may influence investor sentiment toward NXP as the more favorably viewed stock.
Risks specific to each company
The following categories identify critical pressure points and systemic threats facing both firms in the 2026 market environment:
1. Market & Competition
NXP Semiconductors N.V.
- Faces intense competition in automotive and IoT semiconductors; high market cap supports R&D but competition pressures margins.
Cirrus Logic, Inc.
- Operates in niche audio and mixed-signal chips; smaller scale limits market power but benefits from specialized focus.
2. Capital Structure & Debt
NXP Semiconductors N.V.
- High debt-to-equity ratio (1.22) signals financial leverage risk; interest coverage is solid but debt load remains a caution.
Cirrus Logic, Inc.
- Very low debt (0.07 D/E) and minimal leverage; strong interest coverage minimizes financial distress risk.
3. Stock Volatility
NXP Semiconductors N.V.
- Beta of 1.458 indicates above-market volatility; stock price has wide range, increasing trading risk.
Cirrus Logic, Inc.
- Beta of 1.136 shows moderate volatility; narrower trading range suggests lower price swings.
4. Regulatory & Legal
NXP Semiconductors N.V.
- Global operations expose it to complex regulatory environments, especially in China and EU.
Cirrus Logic, Inc.
- Primarily US-based, faces standard regulatory risks but less exposure to complex international laws.
5. Supply Chain & Operations
NXP Semiconductors N.V.
- Complex global supply chain susceptible to geopolitical tensions and component shortages.
Cirrus Logic, Inc.
- Smaller, fabless model reduces capital intensity but depends heavily on third-party manufacturers.
6. ESG & Climate Transition
NXP Semiconductors N.V.
- Faces growing pressure for sustainable practices amid semiconductor energy-intensive production.
Cirrus Logic, Inc.
- Less capital-intensive operations may ease ESG transitions, but industry-wide challenges remain.
7. Geopolitical Exposure
NXP Semiconductors N.V.
- Significant exposure to US-China tensions due to manufacturing and sales footprint.
Cirrus Logic, Inc.
- Limited international exposure reduces geopolitical risk but may constrain growth opportunities.
Which company shows a better risk-adjusted profile?
Cirrus Logic exhibits a stronger risk-adjusted profile with notably lower leverage, safer liquidity metrics, and less volatile stock behavior. NXP’s higher debt and international complexity amplify its risk, despite its scale advantages. Cirrus’s Altman Z-Score (15.7) and Piotroski Score (7) confirm superior financial stability over NXP’s moderate Piotroski (5) and borderline Altman Z (3.1). The key risk for NXP is its elevated debt load amid geopolitical headwinds. For Cirrus, moderate stock volatility paired with limited market scale defines its primary risk. This contrast underscores Cirrus’s safer investment stance in 2026.
Final Verdict: Which stock to choose?
NXP Semiconductors N.V. (NXPI) excels as a cash machine with solid profitability and a strong current ratio, underpinned by its efficient capital allocation. However, its declining ROIC and elevated debt levels warrant vigilance. NXPI suits investors targeting aggressive growth, willing to accept balance sheet risks for potential upside.
Cirrus Logic, Inc. (CRUS) boasts a very favorable moat, evidenced by a growing ROIC well above its WACC, reflecting sustainable competitive advantage. Its conservative leverage and robust free cash flow enhance its safety profile relative to NXPI. CRUS fits well in a GARP portfolio, balancing growth with financial stability.
If you prioritize aggressive expansion and can tolerate higher leverage, NXPI is the compelling choice due to its cash-generating ability despite some profitability erosion. However, if you seek a more stable growth story with a durable moat and prudent capital structure, CRUS offers better stability and value creation over the long term.
Disclaimer: Investment carries a risk of loss of initial capital. The past performance is not a reliable indicator of future results. Be sure to understand risks before making an investment decision.
Go Further
I encourage you to read the complete analyses of NXP Semiconductors N.V. and Cirrus Logic, Inc. to enhance your investment decisions: