NVIDIA Corporation and Cirrus Logic, Inc. are two prominent players in the semiconductor industry, each carving out unique niches with innovative technologies. NVIDIA leads in graphics processing and AI computing, while Cirrus Logic specializes in high-precision mixed-signal audio solutions. Their shared focus on cutting-edge semiconductor innovation makes them compelling subjects for comparison. In this article, I will help you determine which company presents the most attractive investment opportunity in 2026.

Table of contents
Companies Overview
I will begin the comparison between NVIDIA Corporation and Cirrus Logic, Inc. by providing an overview of these two companies and their main differences.
NVIDIA Overview
NVIDIA Corporation focuses on graphics, compute, and networking solutions globally, serving gaming, professional visualization, datacenter, and automotive markets. Its product range includes GeForce GPUs, AI platforms, automotive AI systems, and networking solutions. Headquartered in Santa Clara, California, NVIDIA is a dominant player in the semiconductor industry with a market cap exceeding 4.4T USD and a workforce of 36,000 employees.
Cirrus Logic Overview
Cirrus Logic, Inc. is a fabless semiconductor company specializing in low-power, high-precision mixed-signal processing solutions, primarily for audio applications. Its products, including codecs, amplifiers, and digital signal processors, target consumer electronics such as smartphones, laptops, and automotive systems. Based in Austin, Texas, Cirrus Logic has a market cap around 6.3B USD and employs about 1,600 people.
Key similarities and differences
Both companies operate in the semiconductor sector and supply critical components for consumer electronics and industrial applications. NVIDIA’s business spans a broader market with a focus on high-performance graphics and AI computing, while Cirrus Logic concentrates on audio and mixed-signal processing solutions. NVIDIA’s scale and diversification significantly exceed Cirrus Logic’s more specialized product portfolio and smaller market capitalization.
Income Statement Comparison
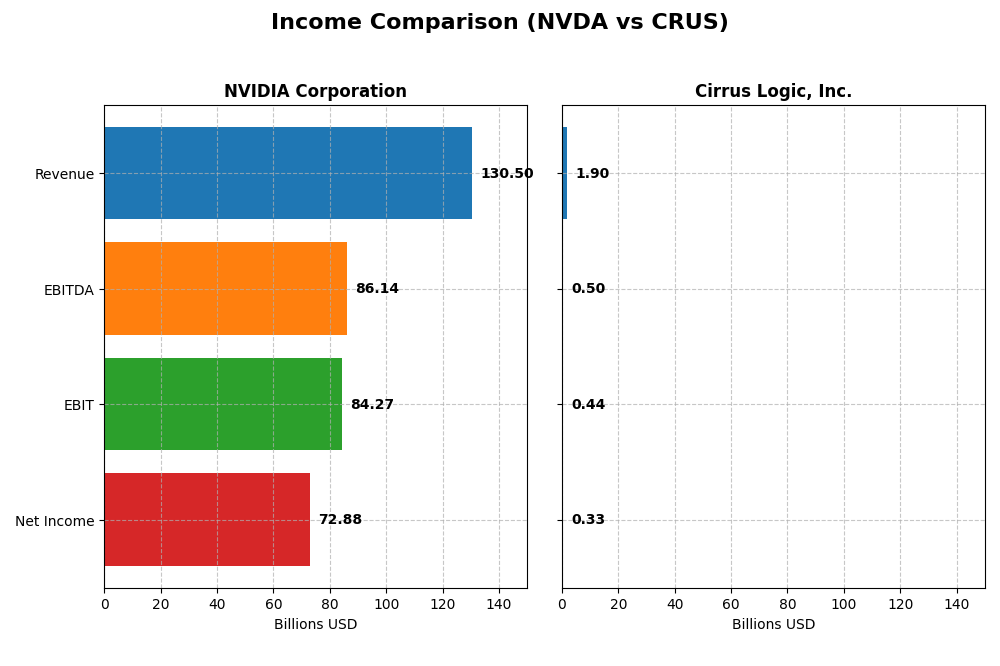
This table presents a side-by-side comparison of key income statement metrics for NVIDIA Corporation and Cirrus Logic, Inc. for the fiscal year 2025.
| Metric | NVIDIA Corporation | Cirrus Logic, Inc. |
|---|---|---|
| Market Cap | 4.46T | 6.35B |
| Revenue | 130.5B | 1.90B |
| EBITDA | 86.1B | 497M |
| EBIT | 84.3B | 445M |
| Net Income | 72.9B | 332M |
| EPS | 2.97 | 6.24 |
| Fiscal Year | 2025 | 2025 |
Income Statement Interpretations
NVIDIA Corporation
NVIDIA exhibited robust growth from 2021 to 2025, with revenue soaring from $16.7B to $130.5B and net income expanding from $4.3B to $72.9B. Margins improved significantly, with gross margin near 75% and net margin at 56% in 2025. The latest year showed exceptional revenue and earnings growth, with net margin and EPS rising sharply, reflecting strong operational leverage and profitability.
Cirrus Logic, Inc.
Cirrus Logic’s revenue increased moderately from $1.37B in 2021 to $1.90B in 2025, while net income grew from $217M to $332M. Margins remained stable and favorable, with a gross margin above 52% and net margin near 17.5% in 2025. The most recent year indicated steady revenue growth of about 6%, alongside solid improvements in EBIT and net margin, supporting consistent earnings expansion.
Which one has the stronger fundamentals?
NVIDIA demonstrates stronger fundamentals with its remarkable revenue and net income growth alongside superior margins, reflecting significant scale and profitability advantages. Cirrus Logic shows stable but more modest growth and margins. Both companies maintain favorable evaluations, yet NVIDIA’s higher growth rates and margin improvements suggest more pronounced financial strength over the period analyzed.
Financial Ratios Comparison
The table below presents the most recent fiscal year financial ratios for NVIDIA Corporation and Cirrus Logic, Inc., allowing for a straightforward comparison of key performance and financial health metrics.
| Ratios | NVIDIA Corporation (2025) | Cirrus Logic, Inc. (2025) |
|---|---|---|
| ROE | 91.87% | 17.01% |
| ROIC | 75.28% | 14.20% |
| P/E | 39.90 | 15.95 |
| P/B | 36.66 | 2.71 |
| Current Ratio | 4.44 | 6.35 |
| Quick Ratio | 3.88 | 4.82 |
| D/E | 0.13 | 0.07 |
| Debt-to-Assets | 9.20% | 6.18% |
| Interest Coverage | 329.77 | 456.97 |
| Asset Turnover | 1.17 | 0.81 |
| Fixed Asset Turnover | 16.16 | 6.62 |
| Payout Ratio | 1.14% | 0% |
| Dividend Yield | 0.03% | 0% |
Interpretation of the Ratios
NVIDIA Corporation
NVIDIA shows strong profitability ratios with a net margin of 55.85%, ROE of 91.87%, and ROIC of 75.28%, signaling excellent efficiency and returns. However, high valuation metrics like a PE of 39.9 and PB of 36.66 pose concerns, along with an unfavorable current ratio of 4.44. NVIDIA pays a low dividend yield of 0.03%, indicating minimal shareholder returns through dividends.
Cirrus Logic, Inc.
Cirrus Logic presents favorable but more moderate ratios, including a net margin of 17.48%, ROE of 17.01%, and ROIC of 14.2%. Valuation ratios such as PE at 15.95 and PB at 2.71 are neutral, suggesting fair pricing. The company does not pay dividends, likely prioritizing reinvestment or growth strategies, supported by favorable debt and liquidity ratios.
Which one has the best ratios?
NVIDIA exhibits more robust profitability and return ratios, offset by high valuation and liquidity concerns. Cirrus Logic’s ratios are generally favorable and balanced, with fewer unfavorable indicators but lower profitability. Both companies have a favorable global ratios opinion, though NVIDIA’s superior returns contrast with Cirrus Logic’s more conservative profile.
Strategic Positioning
This section compares the strategic positioning of NVIDIA Corporation and Cirrus Logic, Inc., including market position, key segments, and exposure to technological disruption:
NVIDIA Corporation
- Dominates semiconductor market with significant scale; faces high competitive pressure due to industry dynamics.
- Diverse segments: Data Center ($115B), Gaming ($11.35B), Automotive ($1.69B), Professional Visualization ($1.88B).
- Invests in AI, HPC, autonomous driving, cloud computing, and advanced graphics, positioning against disruption.
Cirrus Logic, Inc.
- Smaller semiconductor player with moderate competitive pressure in niche markets.
- Focused on Portable Audio ($1.14B) and High-Performance Mixed Signal Products ($759M).
- Concentrates on low-power mixed-signal and audio technologies with limited disruption exposure.
NVIDIA vs Cirrus Logic Positioning
NVIDIA pursues a diversified strategy across multiple high-growth tech segments, enabling scale advantages but greater complexity. Cirrus Logic focuses on specialized audio and mixed-signal markets, offering concentration benefits but narrower growth scope.
Which has the best competitive advantage?
Both companies create value with growing ROIC trends, but NVIDIA’s substantially higher ROIC over WACC and broader market presence suggest a stronger and more durable competitive advantage.
Stock Comparison
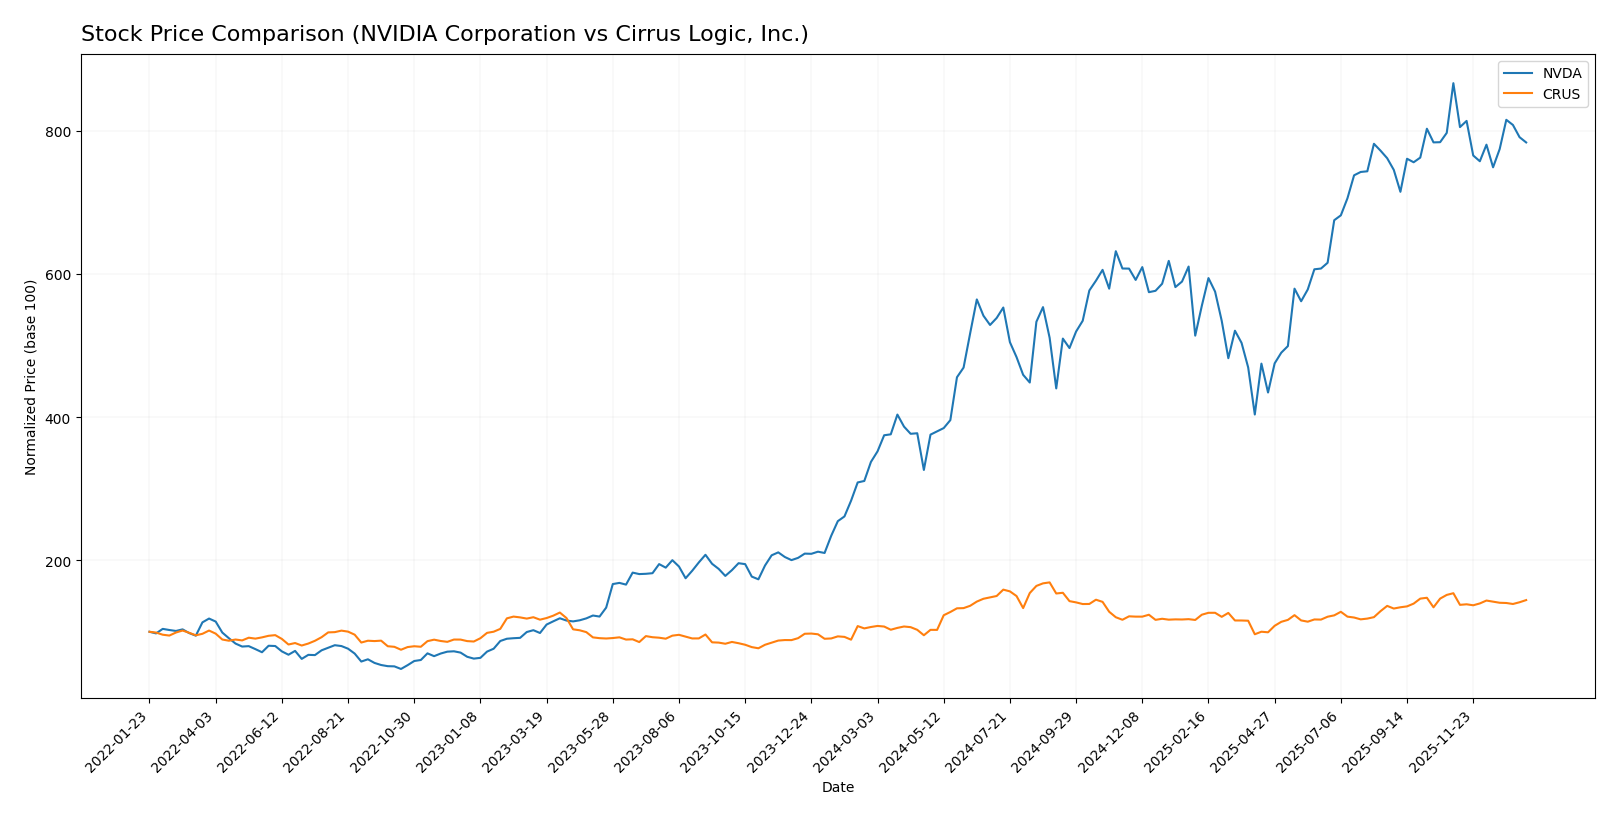
The stock price chart highlights significant bullish trends for NVIDIA Corporation and Cirrus Logic, Inc. over the past 12 months, with notable price appreciation and recent deceleration in upward momentum.
Trend Analysis
NVIDIA Corporation’s stock has experienced a strong bullish trend over the past 12 months, rising by 132.35%, though the price momentum has decelerated. The stock reached a high of 202.49 and a low of 76.2, with recent slight bearish movement of -9.56%.
Cirrus Logic, Inc. showed a bullish trend with a 35.25% price increase over the same period, also with decelerating momentum. The stock’s highest price was 145.69 and lowest 82.02, recently declining by 6.23% in a milder bearish phase.
Comparing the two, NVIDIA’s stock delivered a substantially higher market performance than Cirrus Logic over the past year, despite both experiencing recent downward adjustments.
Target Prices
The target price consensus from verified analysts outlines a positive outlook for both NVIDIA Corporation and Cirrus Logic, Inc.
| Company | Target High | Target Low | Consensus |
|---|---|---|---|
| NVIDIA Corporation | 352 | 140 | 264.34 |
| Cirrus Logic, Inc. | 155 | 95 | 137.5 |
Analysts expect NVIDIA’s stock to rise significantly above its current price of 183.14 USD, indicating strong growth potential. Cirrus Logic’s consensus target also suggests upside from its current price of 124.38 USD, reflecting moderately bullish sentiment.
Analyst Opinions Comparison
This section compares analysts’ ratings and grades for NVIDIA Corporation and Cirrus Logic, Inc.:
Rating Comparison
NVDA Rating
- Rating: B+, rated very favorable overall.
- Discounted Cash Flow Score: 3, indicating moderate valuation based on cash flow.
- ROE Score: 5, very favorable efficiency in generating profit from equity.
- ROA Score: 5, very favorable asset utilization to generate earnings.
- Debt To Equity Score: 3, moderate financial risk and balance sheet strength.
- Overall Score: 3, moderate overall financial standing.
CRUS Rating
- Rating: A-, rated very favorable overall.
- Discounted Cash Flow Score: 4, indicating favorable valuation based on cash flow.
- ROE Score: 4, favorable efficiency in generating profit from equity.
- ROA Score: 5, very favorable asset utilization to generate earnings.
- Debt To Equity Score: 3, moderate financial risk and balance sheet strength.
- Overall Score: 4, favorable overall financial standing.
Which one is the best rated?
Cirrus Logic holds a higher overall score (4 vs. 3) and better discounted cash flow rating than NVIDIA. While NVIDIA scores higher in ROE, Cirrus Logic’s combination of ratings results in a better overall analyst evaluation based strictly on the provided data.
Scores Comparison
Here is a comparison of the Altman Z-Score and Piotroski Score for NVIDIA Corporation and Cirrus Logic, Inc.:
NVIDIA Corporation Scores
- Altman Z-Score: 68.04, indicating a very strong safe zone
- Piotroski Score: 6, reflecting an average financial health
Cirrus Logic, Inc. Scores
- Altman Z-Score: 11.57, also within the safe zone
- Piotroski Score: 7, showing strong financial strength
Which company has the best scores?
Both companies are well within the safe zone according to their Altman Z-Scores, with NVIDIA scoring higher. Cirrus Logic has a stronger Piotroski Score than NVIDIA, indicating better financial strength by that metric.
Grades Comparison
The following presents the recent grades assigned by reputable grading companies for NVIDIA Corporation and Cirrus Logic, Inc.:
NVIDIA Corporation Grades
This table summarizes recent grades given by established financial institutions:
| Grading Company | Action | New Grade | Date |
|---|---|---|---|
| Mizuho | Maintain | Outperform | 2026-01-09 |
| Truist Securities | Maintain | Buy | 2025-12-29 |
| Stifel | Maintain | Buy | 2025-12-29 |
| B of A Securities | Maintain | Buy | 2025-12-26 |
| Baird | Maintain | Outperform | 2025-12-26 |
| Bernstein | Maintain | Outperform | 2025-12-26 |
| Truist Securities | Maintain | Buy | 2025-12-19 |
| Tigress Financial | Maintain | Strong Buy | 2025-12-18 |
| Morgan Stanley | Maintain | Overweight | 2025-12-01 |
| Deutsche Bank | Maintain | Hold | 2025-11-20 |
NVIDIA shows a consistent pattern of Buy and Outperform ratings, with multiple firms maintaining positive outlooks through late 2025 and early 2026.
Cirrus Logic, Inc. Grades
This table captures recent grades from credible grading companies:
| Grading Company | Action | New Grade | Date |
|---|---|---|---|
| Keybanc | Maintain | Overweight | 2025-11-05 |
| Barclays | Maintain | Equal Weight | 2025-11-05 |
| Stifel | Maintain | Buy | 2025-11-05 |
| Benchmark | Maintain | Buy | 2025-11-05 |
| Susquehanna | Maintain | Positive | 2025-10-22 |
| Stifel | Maintain | Buy | 2025-10-17 |
| Stifel | Maintain | Buy | 2025-09-12 |
| Barclays | Maintain | Equal Weight | 2025-05-07 |
| Barclays | Maintain | Equal Weight | 2025-04-22 |
| Stifel | Maintain | Buy | 2025-04-17 |
Cirrus Logic exhibits a mix of Buy and Equal Weight ratings, with no recent downgrades, indicating steady but more moderate confidence from analysts.
Which company has the best grades?
NVIDIA Corporation has received stronger and more frequent Buy and Outperform ratings compared to Cirrus Logic, which shows a more balanced distribution including Equal Weight grades. This difference may influence investors seeking higher conviction in analyst sentiment.
Strengths and Weaknesses
Below is a comparative overview of NVIDIA Corporation and Cirrus Logic, Inc. based on key investment criteria:
| Criterion | NVIDIA Corporation | Cirrus Logic, Inc. |
|---|---|---|
| Diversification | Highly diversified with major revenue from Data Center (115B), Gaming (11.35B), Automotive (1.69B), and Professional Visualization (1.88B) segments | Less diversified, mainly focused on Portable Audio Products (1.14B) and High-Performance Mixed Signal Products (759M) |
| Profitability | Very high profitability: Net margin 55.85%, ROIC 75.28%, ROE 91.87% | Moderate profitability: Net margin 17.48%, ROIC 14.2%, ROE 17.01% |
| Innovation | Strong innovation with a durable competitive advantage reflected by very favorable moat and rapidly growing ROIC (340% increase) | Moderate innovation with stable, slightly growing ROIC (10% increase) and favorable moat |
| Global presence | Global leader with extensive market penetration in multiple technology sectors | Niche market player with limited diversification and smaller scale |
| Market Share | Dominant in GPU and data center markets, significant growth in automotive AI chips | Smaller market share with focus on audio-related semiconductor products |
NVIDIA’s key strengths lie in its diversified revenue streams, exceptional profitability, and strong innovation moat, making it a robust choice for investors seeking growth and stability. Cirrus Logic offers steady profitability and a favorable moat but is more specialized and less diversified, which may entail higher sector-specific risks.
Risk Analysis
The table below summarizes key risk metrics for NVIDIA Corporation and Cirrus Logic, Inc. based on the most recent 2025 financial data:
| Metric | NVIDIA Corporation (NVDA) | Cirrus Logic, Inc. (CRUS) |
|---|---|---|
| Market Risk | High beta 2.31, price volatility between 86.62-212.19 USD | Moderate beta 1.08, price range 75.83-136.92 USD |
| Debt level | Low debt-to-equity 0.13, debt-to-assets 9.2% (favorable) | Very low debt-to-equity 0.07, debt-to-assets 6.18% (favorable) |
| Regulatory Risk | Moderate, operates globally including sensitive markets like China | Moderate, international sales but smaller scale |
| Operational Risk | Complex product lines and global supply chains, 36K employees | Smaller scale, 1.6K employees, less diversification |
| Environmental Risk | Moderate, semiconductor manufacturing impacts and energy use | Moderate, focus on low-power mixed-signal solutions |
| Geopolitical Risk | Elevated due to exposure in US-China tech tensions | Moderate, less direct geopolitical exposure |
In synthesis, NVIDIA faces the highest market risk due to its elevated beta and global scale, with geopolitical tensions particularly impactful on its semiconductor supply chain. Its low debt level and strong interest coverage mitigate financial risk. Cirrus Logic has lower market and geopolitical risks but shows some operational concentration and moderate regulatory exposure. For both, managing supply chain and geopolitical uncertainties remains critical.
Which Stock to Choose?
NVIDIA Corporation (NVDA) shows a strong income evolution with revenue growth of 114.2% over the last year and a net margin of 55.85%, supported by highly favorable profitability ratios including ROE at 91.87%. Its low debt levels and a very favorable overall rating (B+) reflect solid financial health and a very favorable economic moat with a ROIC significantly exceeding its WACC.
Cirrus Logic, Inc. (CRUS) presents a more moderate income growth of 5.99% recently, with a net margin of 17.48%. Financial ratios are mostly favorable with a solid ROE of 17.01%, low debt, and a very favorable rating (A-). The company also demonstrates a very favorable moat with a growing ROIC above WACC, though its scale and growth metrics are less pronounced than NVDA’s.
For investors, NVDA’s robust income growth and strong profitability could appeal to those with a growth-oriented profile seeking companies with durable competitive advantages, while CRUS might appear more suitable for investors prioritizing moderate growth and stability with a favorable risk profile. Both stocks show favorable ratings and moats, indicating strong fundamentals but differing in scale and growth dynamics.
Disclaimer: Investment carries a risk of loss of initial capital. The past performance is not a reliable indicator of future results. Be sure to understand risks before making an investment decision.
Go Further
I encourage you to read the complete analyses of NVIDIA Corporation and Cirrus Logic, Inc. to enhance your investment decisions: