Home > Comparison > Technology > CRUS vs NVEC
The strategic rivalry between Cirrus Logic, Inc. and NVE Corporation shapes the semiconductor sector’s innovation frontier. Cirrus Logic operates as a fabless semiconductor powerhouse specializing in mixed-signal processing solutions, while NVE Corporation pioneers spintronic nanotechnology devices. This head-to-head embodies a contest between established scale and niche technological innovation. This analysis seeks to identify which trajectory offers superior risk-adjusted returns for a diversified portfolio navigating the evolving tech landscape.
Table of contents
Companies Overview
Cirrus Logic and NVE Corporation represent distinct yet vital forces in the semiconductor industry.
Cirrus Logic, Inc.: Mixed-Signal Audio and Power Innovator
Cirrus Logic dominates the mixed-signal semiconductor market with low-power, high-precision audio and power solutions. Its revenue engine centers on integrated circuits that combine ADCs, DACs, and digital signal processors, powering smartphones, AR/VR, and automotive audio systems. In 2026, the company sharpens its focus on expanding SoundClear technology to enhance user audio experiences across mobile and industrial applications.
NVE Corporation: Spintronics Pioneer for Industrial IoT
NVE Corporation leads in spintronic sensor technology, leveraging electron spin to innovate data acquisition and transmission devices. Its core revenue derives from sensors and couplers serving factory automation, medical devices, and the industrial IoT. In 2026, NVE emphasizes R&D and licensing of magnetoresistive memory tech, seeking to strengthen its foothold in niche, high-tech markets despite its smaller scale.
Strategic Collision: Similarities & Divergences
Both firms claim semiconductor innovation but diverge in philosophy: Cirrus Logic pursues a broad mixed-signal ecosystem, while NVE bets on specialized spintronic applications. Their primary battleground lies in industrial and IoT segments, where precision and low power consumption matter most. Cirrus offers a larger, diversified profile; NVE presents a focused, niche play with higher volatility and growth risk.
Income Statement Comparison
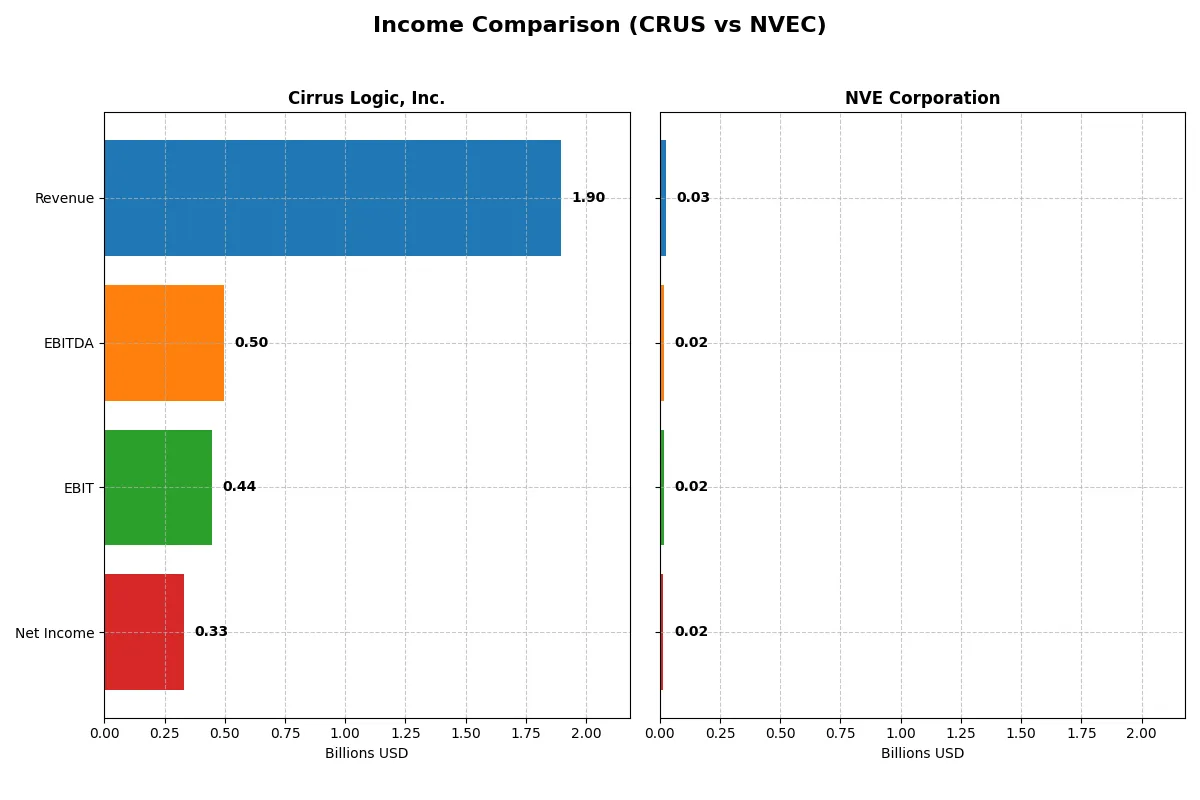
This data dissects the core profitability and scalability of both corporate engines to reveal who dominates the bottom line:
| Metric | Cirrus Logic, Inc. (CRUS) | NVE Corporation (NVEC) |
|---|---|---|
| Revenue | 1.90B | 26M |
| Cost of Revenue | 900M | 4.2M |
| Operating Expenses | 586M | 5.6M |
| Gross Profit | 996M | 22M |
| EBITDA | 497M | 16M |
| EBIT | 445M | 16M |
| Interest Expense | 0.9M | 0 |
| Net Income | 332M | 15M |
| EPS | 6.24 | 3.12 |
| Fiscal Year | 2025 | 2025 |
Income Statement Analysis: The Bottom-Line Duel
This income statement comparison reveals the true efficiency and profitability of Cirrus Logic, Inc. and NVE Corporation’s corporate engines.
Cirrus Logic, Inc. Analysis
Cirrus Logic’s revenue rose steadily to $1.9B in 2025, with net income climbing to $331M. Its gross margin holds firm at 52.5%, reflecting solid cost control. Net margin improved to 17.5%, driven by a 22% jump in EPS and nearly 22% EBIT growth, signaling robust operational momentum and efficiency gains.
NVE Corporation Analysis
NVE Corporation posted $26M revenue in 2025, down 13% from the prior year, with net income at $15M. Despite this, it sustains an impressive 83.6% gross margin and 58.2% net margin, underscoring its high profitability. However, recent declines in top-line and EBIT indicate challenges to sustaining growth momentum.
Margin Strength vs. Growth Momentum
Cirrus Logic delivers superior revenue growth and expanding net margins, outpacing NVE’s 21% revenue rise over five years. NVE’s margins remain exceptional but recent revenue contraction dampens its growth profile. For investors, Cirrus Logic’s balanced growth and margin expansion present a more compelling income statement trajectory.
Financial Ratios Comparison
These vital ratios act as a diagnostic tool to expose the underlying fiscal health, valuation premiums, and capital efficiency of the companies compared below:
| Ratios | Cirrus Logic, Inc. (CRUS) | NVE Corporation (NVEC) |
|---|---|---|
| ROE | 17.0% | 24.2% |
| ROIC | 14.2% | 21.1% |
| P/E | 15.9 | 20.5 |
| P/B | 2.71 | 4.95 |
| Current Ratio | 6.35 | 28.40 |
| Quick Ratio | 4.82 | 22.03 |
| D/E | 0.07 | 0.01 |
| Debt-to-Assets | 6.18% | 1.43% |
| Interest Coverage | 457.0 | 0 |
| Asset Turnover | 0.81 | 0.40 |
| Fixed Asset Turnover | 6.62 | 8.91 |
| Payout Ratio | 0 | 128% |
| Dividend Yield | 0% | 6.28% |
| Fiscal Year | 2025 | 2025 |
Efficiency & Valuation Duel: The Vital Signs
Financial ratios act as the company’s DNA, exposing operational strengths and hidden risks essential for informed investment decisions.
Cirrus Logic, Inc.
Cirrus Logic delivers solid profitability with a 17% ROE and a 17.5% net margin, showing operational efficiency above sector averages. Its P/E of 15.95 and P/B of 2.71 indicate a fairly valued stock, neither cheap nor stretched. The company retains earnings for R&D, reflecting a growth-focused capital allocation without dividends.
NVE Corporation
NVE Corporation boasts superior profitability, with a 24.2% ROE and an exceptional 58.2% net margin. Despite a higher P/E of 20.46, it trades at a rich P/B of 4.95, signaling an expensive valuation. NVE balances shareholder returns with a 6.28% dividend yield, complementing its strong cash generation and efficient capital use.
Valuation Discipline vs. High-Profit Premium
Both companies show favorable ratios, but Cirrus offers a more balanced valuation with efficient returns. NVE excels in profitability but at a stretched price and higher risk. Value-oriented investors may prefer Cirrus’s steadier profile, while growth seekers might lean toward NVE’s robust margins and dividends.
Which one offers the Superior Shareholder Reward?
I compare Cirrus Logic (CRUS) and NVE Corporation (NVEC) by their shareholder return strategies. CRUS pays no dividends, reinvesting nearly all free cash flow into growth, with a 0% payout ratio. NVEC yields 4.5%–6.3%, with payout ratios exceeding 100%, signaling aggressive dividend policies supported by strong free cash flow coverage (~90%). CRUS runs minimal buybacks, while NVEC maintains steady buybacks alongside dividends, enhancing total return. NVEC’s model, combining high dividend yield and buybacks, appears more sustainable long term given robust operating margins and cash flow. I conclude NVEC offers a superior total return profile in 2026, balancing income and capital appreciation better than CRUS’s all-growth approach.
Comparative Score Analysis: The Strategic Profile
The radar chart reveals the fundamental DNA and trade-offs of Cirrus Logic, Inc. and NVE Corporation, spotlighting their financial strengths and market positioning:
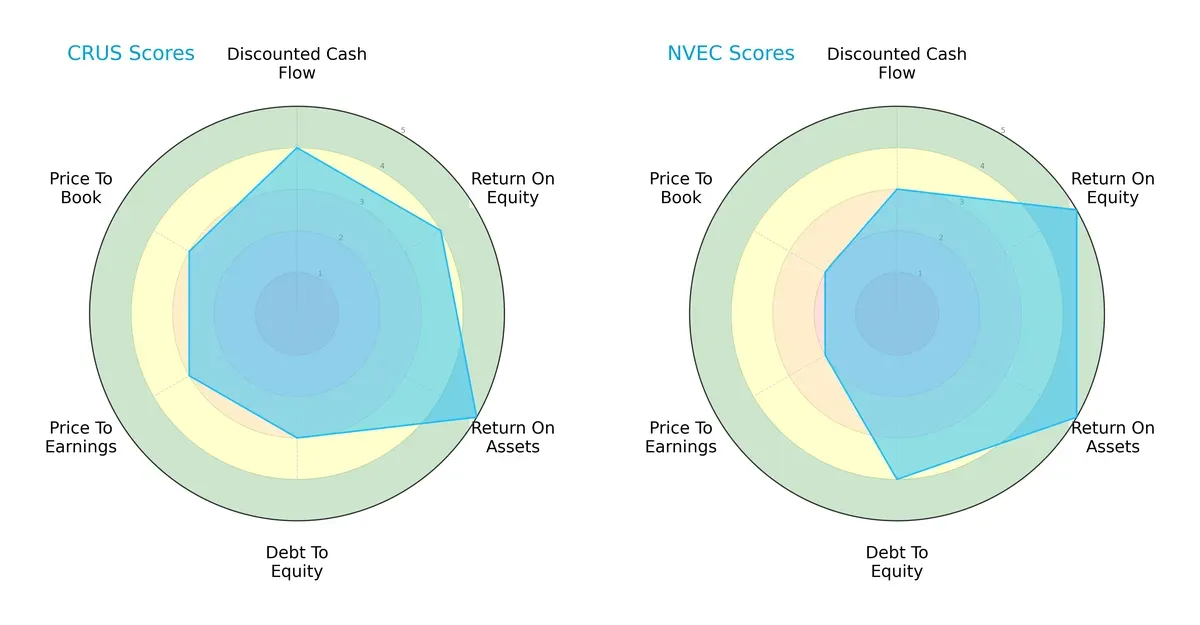
Cirrus Logic shows a balanced profile with strong DCF (4), ROE (4), and ROA (5) scores, but moderate leverage and valuation metrics (3 each). NVE Corporation excels in ROE (5), ROA (5), and has better debt management (4) but lags in DCF (3) and valuation (2). Cirrus Logic depends on a more consistent cash flow valuation, while NVE leverages operational efficiency and lower financial risk.
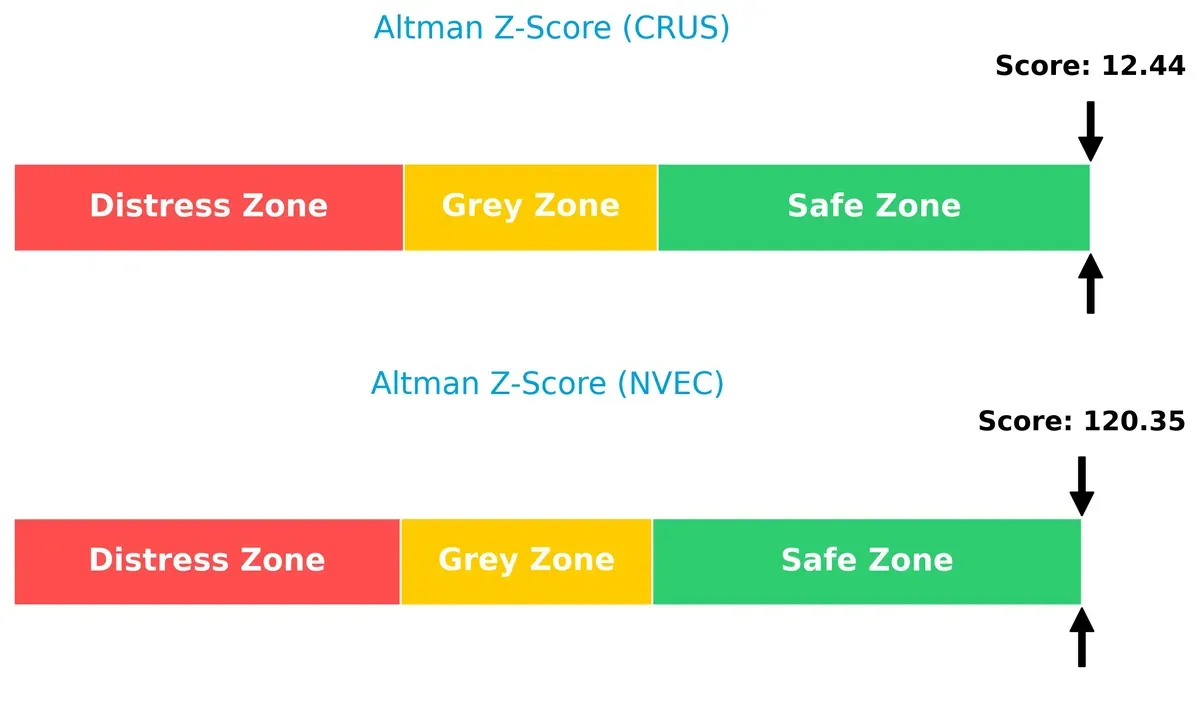
Bankruptcy Risk: Solvency Showdown
The Altman Z-Score gap strongly favors NVE Corporation, scoring 120.4 versus Cirrus Logic’s 12.4, indicating both firms are in the safe zone but NVE’s financial resilience is significantly higher:
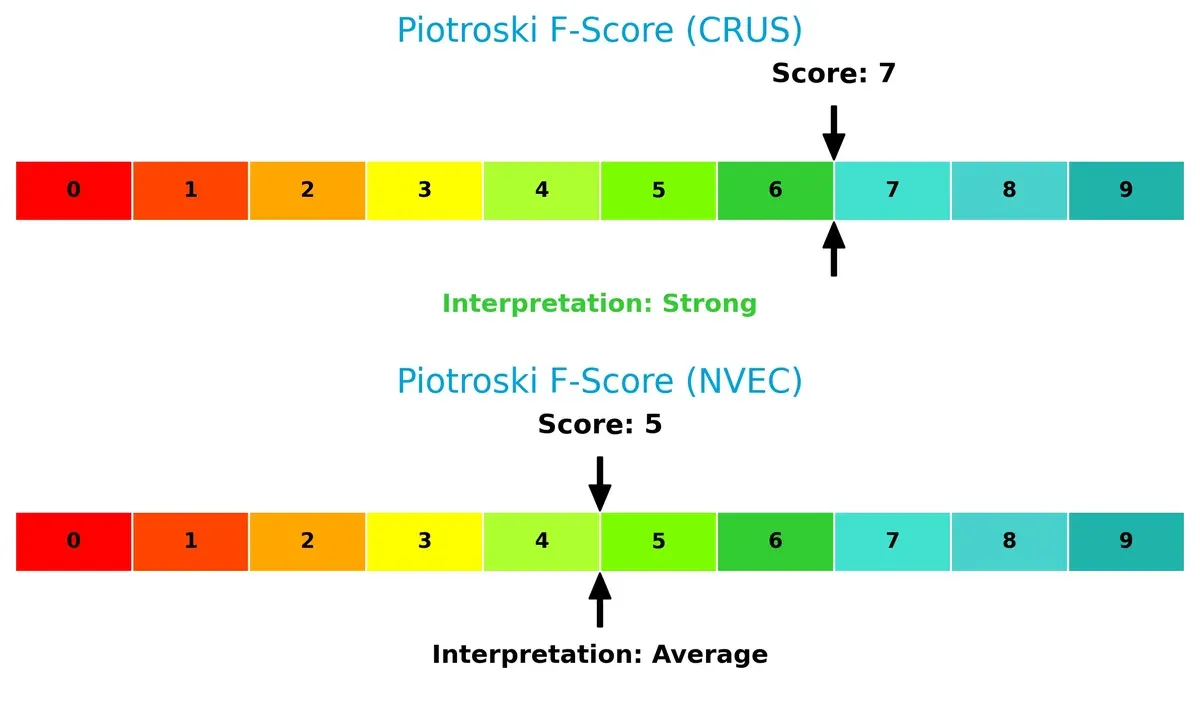
Financial Health: Quality of Operations
Cirrus Logic’s Piotroski F-Score of 7 suggests robust internal financial metrics, outperforming NVE Corporation’s average score of 5, which signals potential red flags in operational efficiency or profitability:
How are the two companies positioned?
This section dissects the operational DNA of Cirrus Logic and NVE Corporation by comparing their revenue distribution and internal strengths and weaknesses. The final goal is to confront their economic moats and identify which model delivers the most resilient, sustainable competitive advantage today.
Revenue Segmentation: The Strategic Mix
This visual comparison dissects how Cirrus Logic, Inc. and NVE Corporation diversify their income streams and reveals their primary sector bets:
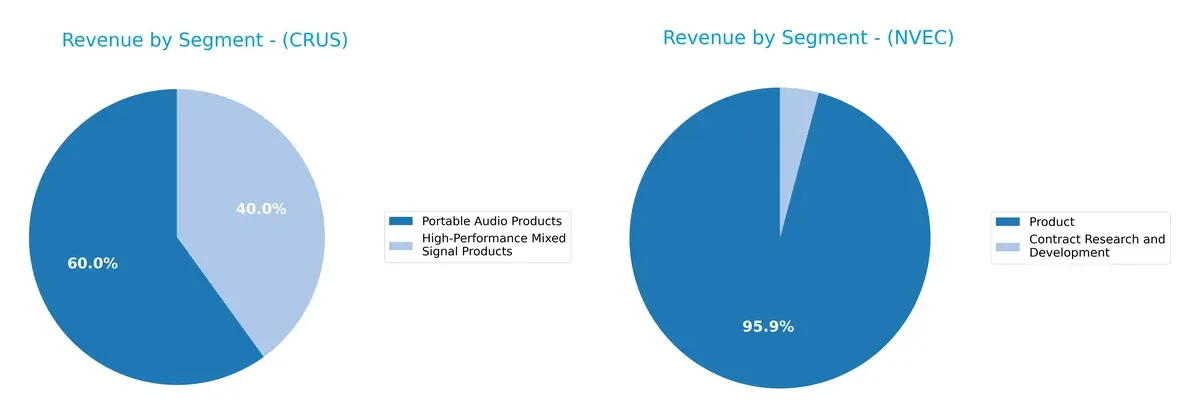
Cirrus Logic anchors its revenue in Portable Audio Products, generating $1.14B in 2025, with High-Performance Mixed Signal Products contributing $759M. This mix shows moderate diversification but leans heavily on audio. NVE Corporation dwarfs Cirrus in concentration risk, with Product revenue at $25.9M dominating and Contract Research and Development trailing at just $1.1M. Cirrus’s strategy pivots on ecosystem lock-in in audio, while NVE relies on a narrower product base, increasing vulnerability to market shifts.
Strengths and Weaknesses Comparison
This table compares the strengths and weaknesses of Cirrus Logic and NVE Corporation:
Cirrus Logic Strengths
- Balanced revenue from Portable Audio and High-Performance Mixed Signal Products
- Favorable profitability with 17.48% net margin and 17.01% ROE
- Strong fixed asset turnover of 6.62
- Low debt-to-assets at 6.18% and excellent interest coverage of 495.45
NVE Corporation Strengths
- Superior profitability with 58.22% net margin and 24.19% ROE
- Very low debt-to-assets at 1.43% and infinite interest coverage
- High fixed asset turnover of 8.91
- Dividend yield of 6.28% supports income investing
Cirrus Logic Weaknesses
- High current ratio of 6.35 suggests inefficient asset use
- Zero dividend yield limits income appeal
- Neutral price multiples (PE 15.95, PB 2.71)
- Moderate asset turnover of 0.81
NVE Corporation Weaknesses
- Extremely high current ratio of 28.4 signals excessive liquidity
- Unfavorable PB ratio at 4.95 indicates potentially overvalued equity
- Low asset turnover at 0.4 may reflect asset underutilization
- Neutral PE multiple at 20.46
Cirrus Logic demonstrates solid profitability with efficient use of fixed assets but faces liquidity inefficiencies. NVE Corporation excels in profitability and capital structure but shows signs of excess liquidity and valuation concerns. These factors shape strategic priorities around capital allocation and operational efficiency.
The Moat Duel: Analyzing Competitive Defensibility
A structural moat is the crucial barrier protecting long-term profits from relentless competitive pressure and market entry threats:
Cirrus Logic, Inc.: Intangible Assets Powering Audio Innovation
I see Cirrus Logic’s moat rooted in proprietary audio processing technology and integrated mixed-signal ICs. This drives stable 23.5% EBIT margins and 17.5% net margins. Expansion into AR/VR and automotive audio in 2026 could strengthen its market foothold.
NVE Corporation: Cost Advantage in Spintronics Niche
NVE’s moat lies in its specialized spintronic sensor technology, carving a narrow but highly profitable niche. With an 82% gross margin and 62% EBIT margin, it outperforms peers on capital efficiency. However, recent revenue decline signals caution; 2026 innovation in IoT markets may spark recovery.
Moat Strength Showdown: Proprietary Tech vs. Specialized Spintronics
Both firms exhibit durable moats with ROICs well above WACC, but NVE’s 11.7% ROIC premium and 44.7% ROIC growth eclipse Cirrus’s 5.4% and 10.2%. Yet Cirrus’s broader market exposure offers more resilient defense. Cirrus stands better poised to sustain market share in evolving semiconductor landscapes.
Which stock offers better returns?
The past year saw Cirrus Logic, Inc. gain strong momentum with a 40.9% price rise, while NVE Corporation declined by 18.9%, highlighting divergent trading dynamics.
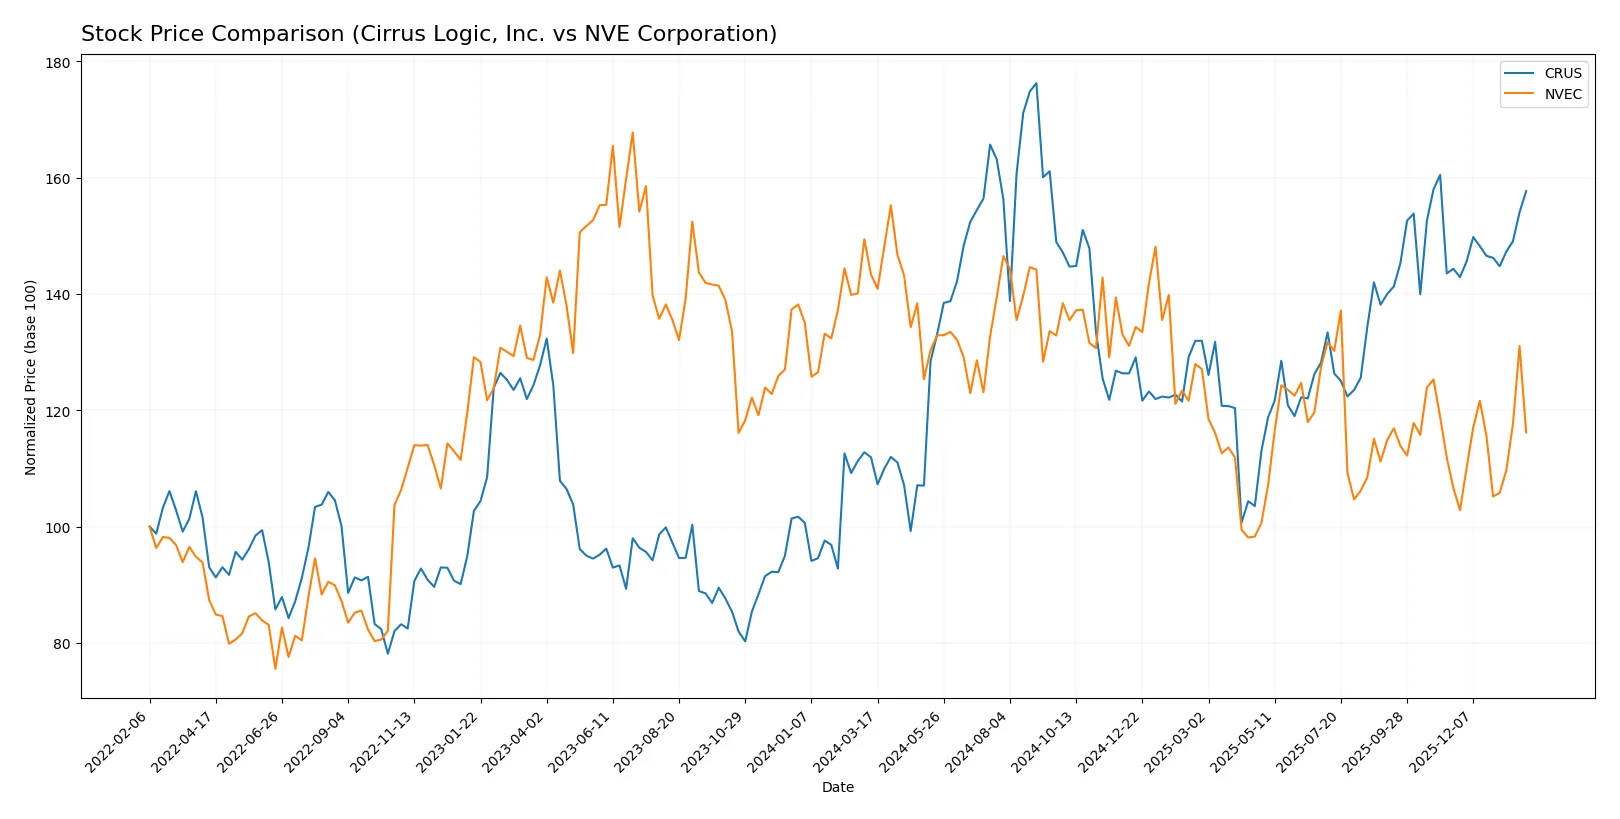
Trend Comparison
Cirrus Logic, Inc. shows a bullish 40.9% price gain over 12 months with accelerating momentum and a high volatility of 14.44%. The stock peaked at 145.69 and bottomed at 82.02.
NVE Corporation’s stock declined 18.9% over the same period, marking a bearish trend despite accelerating price movement and moderate volatility at 7.6%. Its range spanned 56.99 to 90.18.
Cirrus Logic, Inc. significantly outperformed NVE Corporation, delivering the highest market returns with sustained acceleration and stronger buyer dominance.
Target Prices
Analysts show a moderately bullish outlook for Cirrus Logic, Inc., reflecting confidence in its semiconductor niche.
| Company | Target Low | Target High | Consensus |
|---|---|---|---|
| Cirrus Logic, Inc. | 100 | 155 | 138.75 |
The consensus target of 138.75 exceeds the current price of 130.34, suggesting upside potential. For NVE Corporation, no verified target price data is available from recognized analysts.

Don’t Let Luck Decide Your Entry Point
Optimize your entry points with our advanced ProRealTime indicators. You’ll get efficient buy signals with precise price targets for maximum performance. Start outperforming now!
How do institutions grade them?
The following grades summarize the latest institutional assessments for Cirrus Logic, Inc. and NVE Corporation:
Cirrus Logic, Inc. Grades
This table lists recent grades assigned by reputable financial institutions to Cirrus Logic, Inc.:
| Grading Company | Action | New Grade | Date |
|---|---|---|---|
| Keybanc | Maintain | Overweight | 2025-11-05 |
| Barclays | Maintain | Equal Weight | 2025-11-05 |
| Benchmark | Maintain | Buy | 2025-11-05 |
| Stifel | Maintain | Buy | 2025-11-05 |
| Susquehanna | Maintain | Positive | 2025-10-22 |
| Stifel | Maintain | Buy | 2025-10-17 |
| Stifel | Maintain | Buy | 2025-09-12 |
| Barclays | Maintain | Equal Weight | 2025-05-07 |
| Barclays | Maintain | Equal Weight | 2025-04-22 |
| Stifel | Maintain | Buy | 2025-04-17 |
NVE Corporation Grades
No reliable institutional grades are available for NVE Corporation.
Which company has the best grades?
Cirrus Logic, Inc. consistently receives positive grades including multiple “Buy” and “Overweight” ratings. NVE Corporation lacks current institutional grades, creating less clarity for investors. This disparity may influence confidence and portfolio decisions.
Risks specific to each company
The following categories identify the critical pressure points and systemic threats facing both firms in the 2026 market environment:
1. Market & Competition
Cirrus Logic, Inc.
- Faces intense competition in the semiconductor audio segment with pressure from integrated rivals and fast innovation cycles.
NVE Corporation
- Operates in a niche spintronics market but risks losing ground if larger players adopt similar technologies faster.
2. Capital Structure & Debt
Cirrus Logic, Inc.
- Maintains low leverage (debt/equity 0.07) and strong interest coverage (495x), indicating financial stability.
NVE Corporation
- Extremely low debt levels (debt/equity 0.01) and infinite interest coverage, signaling very conservative capital structure.
3. Stock Volatility
Cirrus Logic, Inc.
- Moderate beta of 1.08 suggests average market volatility, aligned with tech sector norms.
NVE Corporation
- Higher beta at 1.20 indicates greater stock price sensitivity and risk compared to peers.
4. Regulatory & Legal
Cirrus Logic, Inc.
- Exposed to global trade regulations affecting semiconductor supply chains and IP protections.
NVE Corporation
- Faces similar regulatory risks but smaller scale may limit legal resource buffer.
5. Supply Chain & Operations
Cirrus Logic, Inc.
- Relies on multiple suppliers for complex IC components, vulnerable to chip shortages and logistic disruptions.
NVE Corporation
- Smaller operation with more specialized supply needs, possibly less diversified but more agile.
6. ESG & Climate Transition
Cirrus Logic, Inc.
- Increasing pressure to improve energy efficiency in products and manufacturing processes.
NVE Corporation
- Faces challenges integrating sustainable practices in emerging spintronics tech.
7. Geopolitical Exposure
Cirrus Logic, Inc.
- Global sales expose it to US-China tensions impacting semiconductor exports.
NVE Corporation
- More concentrated US market focus reduces but does not eliminate geopolitical risks.
Which company shows a better risk-adjusted profile?
Cirrus Logic’s most pressing risk lies in its competitive semiconductor market, where rapid innovation cycles demand continuous investment. NVE’s greatest risk is its stock’s higher volatility, which can amplify investor uncertainty despite strong capital health. Cirrus Logic offers a more balanced risk-adjusted profile, supported by a robust capital structure and moderate market risk. Notably, Cirrus’s high current ratio (6.35) signals liquidity strength but also suggests potential inefficiency in asset use, warranting cautious monitoring.
Final Verdict: Which stock to choose?
Cirrus Logic’s superpower lies in its robust value creation driven by steadily growing returns on invested capital. It operates with exceptional capital efficiency and strong profitability, though its high current ratio signals excess liquidity that might not be optimally deployed. It suits investors targeting aggressive growth with a focus on operational excellence.
NVE Corporation commands a strategic moat through its remarkable net margins and durable competitive advantage highlighted by a soaring ROIC well above its cost of capital. Its fortress-like balance sheet and recurring cash flow offer superior financial safety compared to Cirrus Logic. It fits well within a GARP portfolio seeking growth tempered by resilience.
If you prioritize capital efficiency and consistent earnings growth, Cirrus Logic outshines as the compelling choice due to its operational momentum and value creation. However, if you seek financial stability and superior margins with a durable moat, NVE offers better stability and a premium risk profile. Both present favorable investment scenarios but cater to distinct investor avatars.
Disclaimer: Investment carries a risk of loss of initial capital. The past performance is not a reliable indicator of future results. Be sure to understand risks before making an investment decision.
Go Further
I encourage you to read the complete analyses of Cirrus Logic, Inc. and NVE Corporation to enhance your investment decisions: