Micron Technology, Inc. (MU) and Cirrus Logic, Inc. (CRUS) are two prominent players in the semiconductor industry, each specializing in distinct yet overlapping technology niches. Micron focuses on memory and storage solutions, while Cirrus Logic excels in mixed-signal processing and audio technologies. This comparison sheds light on their innovation strategies and market positions, helping you identify which company offers the most compelling investment opportunity in 2026. Let’s explore their potential together.
Table of contents
Companies Overview
I will begin the comparison between Micron Technology, Inc. and Cirrus Logic, Inc. by providing an overview of these two companies and their main differences.
Micron Technology Overview
Micron Technology, Inc. is a leading designer and manufacturer of memory and storage products worldwide. Founded in 1978 and headquartered in Boise, Idaho, Micron operates through four business units focusing on DRAM, NAND, and NOR memory products. Its offerings serve diverse markets including cloud servers, enterprise, mobile devices, automotive, and industrial sectors, marketed via direct sales and distribution partners.
Cirrus Logic Overview
Cirrus Logic, Inc. is a fabless semiconductor company specializing in low-power, high-precision mixed-signal processing solutions. Established in 1984 and based in Austin, Texas, Cirrus provides audio and mixed-signal products used in smartphones, laptops, automotive entertainment, and industrial applications. It markets its portfolio through direct sales, external representatives, and distributors, emphasizing audio enhancement technologies and power management ICs.
Key similarities and differences
Both companies operate in the semiconductor industry and serve technology markets with specialized products. Micron focuses on memory and storage solutions with a broad market reach, whereas Cirrus Logic specializes in mixed-signal processing and audio-related ICs. Micron is significantly larger, with over 48K employees and a market cap above 373B, compared to Cirrus’s 1.6K employees and a market cap near 6.3B. Their sales and product strategies diverge accordingly.
Income Statement Comparison
The table below presents a side-by-side comparison of key income statement metrics for Micron Technology, Inc. and Cirrus Logic, Inc. for their most recent fiscal years.

| Metric | Micron Technology, Inc. (MU) | Cirrus Logic, Inc. (CRUS) |
|---|---|---|
| Market Cap | 373B | 6.3B |
| Revenue | 37.4B | 1.9B |
| EBITDA | 18.5B | 497M |
| EBIT | 10.1B | 445M |
| Net Income | 8.5B | 332M |
| EPS | 7.65 | 6.24 |
| Fiscal Year | 2025 | 2025 |
Income Statement Interpretations
Micron Technology, Inc.
Micron Technology exhibited strong revenue growth from 2021 to 2025, increasing from $27.7B to $37.4B, with net income recovering from a significant loss in 2023 to $8.54B in 2025. Margins improved notably, with gross margin near 40% and net margin at 22.8% in 2025. The latest year showed substantial earnings and margin expansion, signaling a robust turnaround.
Cirrus Logic, Inc.
Cirrus Logic’s revenue rose steadily from $1.37B in 2021 to $1.90B in 2025, with net income growing to $331.5M. Its gross margin remained strong at 52.5%, while net margin improved to 17.5%. The most recent year saw moderate revenue growth of 6%, but continued favorable margin and earnings growth, reflecting stable operational performance.
Which one has the stronger fundamentals?
Both companies display favorable income statement fundamentals, with Micron showing exceptional earnings turnaround and margin expansion, while Cirrus Logic maintains consistently high margins and steady income growth. Micron’s scale and rapid improvement contrast with Cirrus Logic’s steady, margin-rich growth, presenting two distinct profiles of financial strength in the semiconductor sector.
Financial Ratios Comparison
The table below presents the most recent key financial ratios for Micron Technology, Inc. (MU) and Cirrus Logic, Inc. (CRUS) for their respective latest fiscal years, providing a snapshot of their profitability, liquidity, leverage, efficiency, and dividend metrics.
| Ratios | Micron Technology, Inc. (2025) | Cirrus Logic, Inc. (2025) |
|---|---|---|
| ROE | 15.8% | 17.0% |
| ROIC | 12.1% | 14.2% |
| P/E | 15.9 | 15.9 |
| P/B | 2.51 | 2.71 |
| Current Ratio | 2.52 | 6.35 |
| Quick Ratio | 1.79 | 4.82 |
| D/E (Debt-to-Equity) | 0.28 | 0.07 |
| Debt-to-Assets | 18.5% | 6.2% |
| Interest Coverage | 20.7 | 457.0 |
| Asset Turnover | 0.45 | 0.81 |
| Fixed Asset Turnover | 0.79 | 6.62 |
| Payout Ratio | 6.1% | 0% |
| Dividend Yield | 0.38% | 0% |
Interpretation of the Ratios
Micron Technology, Inc.
Micron Technology shows mostly favorable ratios, including a strong net margin of 22.84% and a robust ROE of 15.76%, indicating efficient profitability and equity use. However, its asset turnover ratios are weaker, suggesting less efficient asset utilization. The dividend yield is low at 0.38%, reflecting a modest payout with potential concerns over sustainability given the payout and free cash flow coverage.
Cirrus Logic, Inc.
Cirrus Logic’s ratios are largely favorable, with a solid ROE of 17.01% and a notable interest coverage ratio of 495.45, signaling strong financial health. Its current ratio is very high at 6.35, which may indicate excess liquidity but also inefficiency. The company does not pay dividends, likely prioritizing reinvestment or growth, consistent with its zero dividend yield and strong free cash flow generation.
Which one has the best ratios?
Both companies present a favorable overall ratio profile with 57.14% favorable metrics. Micron excels in profitability metrics but faces challenges in asset turnover and dividend yield. Cirrus Logic benefits from excellent interest coverage and asset turnover but has a very high current ratio and no dividend payout. The choice depends on investor preferences for dividend income versus reinvestment strategy.
Strategic Positioning
This section compares the strategic positioning of Micron Technology, Inc. and Cirrus Logic, Inc. across Market position, Key segments, and Exposure to technological disruption:
Micron Technology, Inc.
- Large market cap of $373B with significant competitive pressure in semiconductors.
- Diverse segments including DRAM, NAND, mobile, storage, and embedded memory products.
- Exposure to memory technology advances and cloud, automotive, and industrial markets.
Cirrus Logic, Inc.
- Smaller $6.3B market cap with moderate competitive pressure in fabless semiconductors.
- Focused on portable audio and high-performance mixed-signal products for consumer and industrial uses.
- Exposure to mixed-signal processing and audio enhancement technologies in consumer electronics.
Micron Technology, Inc. vs Cirrus Logic, Inc. Positioning
Micron exhibits a diversified product portfolio across multiple memory segments, supporting broad market coverage but facing intense competition. Cirrus Logic maintains a more concentrated focus on audio and mixed-signal ICs, benefiting from niche specialization but with narrower market scope.
Which has the best competitive advantage?
Cirrus Logic shows a very favorable moat with ROIC well above WACC and consistent growth, indicating a durable competitive advantage. Micron has a slightly favorable moat with growing profitability but currently sheds value relative to its cost of capital.
Stock Comparison
The following chart illustrates the strong bullish momentum of Micron Technology, Inc. (MU) with significant price acceleration, contrasted with Cirrus Logic, Inc. (CRUS), which shows a more moderate overall uptrend but recent weakening in price performance.
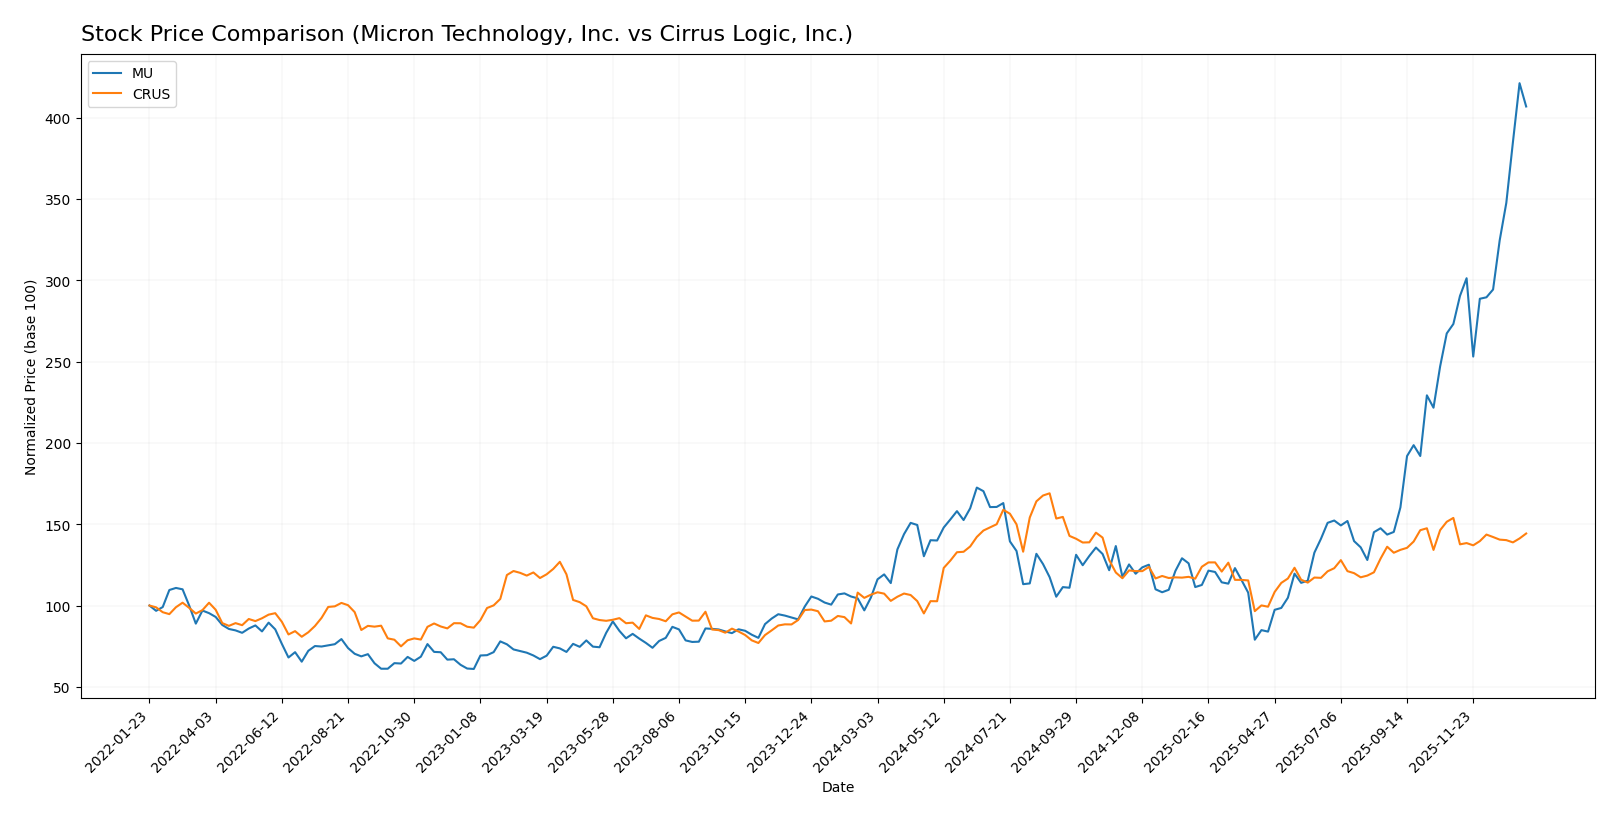
Trend Analysis
Micron Technology, Inc. (MU) exhibited a robust bullish trend over the past 12 months, with a 287.62% price increase and accelerating momentum. The stock showed high volatility, with prices ranging from 64.72 to 345.09.
Cirrus Logic, Inc. (CRUS) also experienced a bullish trend over the same period, rising 35.25%, but with deceleration in price gains recently and a slight downturn of -6.23% in the last months.
Comparing both, MU delivered the highest market performance with strong acceleration, while CRUS showed moderate growth and recent weakness.
Target Prices
The target price consensus for Micron Technology, Inc. and Cirrus Logic, Inc. reflects positive analyst expectations.
| Company | Target High | Target Low | Consensus |
|---|---|---|---|
| Micron Technology, Inc. | 450 | 190 | 328.22 |
| Cirrus Logic, Inc. | 155 | 95 | 137.5 |
Analysts expect both stocks to trade near or above current prices, with Micron’s consensus slightly below its $333.35 price and Cirrus Logic’s consensus well above its $124.38 price, suggesting potential upside.
Analyst Opinions Comparison
This section compares analysts’ ratings and grades for Micron Technology, Inc. (MU) and Cirrus Logic, Inc. (CRUS):
Rating Comparison
MU Rating
- Rating: B, classified as Very Favorable by analysts.
- Discounted Cash Flow Score: 1, indicating a Very Unfavorable valuation level.
- ROE Score: 4, reflecting a Favorable efficiency in generating shareholder profit.
- ROA Score: 5, showing Very Favorable asset utilization.
- Debt To Equity Score: 3, a Moderate financial risk level.
- Overall Score: 3, a Moderate overall financial standing.
CRUS Rating
- Rating: A-, classified as Very Favorable by analysts.
- Discounted Cash Flow Score: 4, indicating a Favorable valuation level.
- ROE Score: 4, reflecting a Favorable efficiency in generating shareholder profit.
- ROA Score: 5, showing Very Favorable asset utilization.
- Debt To Equity Score: 3, a Moderate financial risk level.
- Overall Score: 4, a Favorable overall financial standing.
Which one is the best rated?
Based strictly on the data, CRUS holds a higher overall score (4 vs. 3) and a stronger discounted cash flow score (4 vs. 1) than MU, indicating it is rated better overall by analysts.
Scores Comparison
The scores comparison between Micron Technology, Inc. (MU) and Cirrus Logic, Inc. (CRUS) is as follows:
MU Scores
- Altman Z-Score: 10.5, indicating a safe zone with low bankruptcy risk.
- Piotroski Score: 7, classified as strong financial health.
CRUS Scores
- Altman Z-Score: 11.9, indicating a safe zone with low bankruptcy risk.
- Piotroski Score: 7, classified as strong financial health.
Which company has the best scores?
Both MU and CRUS have Altman Z-Scores placing them firmly in the safe zone, with CRUS slightly higher. Their Piotroski Scores are equal, indicating similarly strong financial health based on the given data.
Grades Comparison
Here is a detailed comparison of the most recent grades and ratings for Micron Technology, Inc. and Cirrus Logic, Inc.:
Micron Technology, Inc. Grades
The following table summarizes recent grades assigned to Micron Technology, Inc. by reputable grading companies:
| Grading Company | Action | New Grade | Date |
|---|---|---|---|
| Keybanc | Maintain | Overweight | 2026-01-13 |
| B of A Securities | Maintain | Buy | 2026-01-13 |
| Lynx Global | Maintain | Buy | 2026-01-12 |
| Mizuho | Maintain | Outperform | 2026-01-09 |
| UBS | Maintain | Buy | 2026-01-07 |
| Piper Sandler | Maintain | Overweight | 2026-01-07 |
| Piper Sandler | Maintain | Overweight | 2025-12-18 |
| Barclays | Maintain | Overweight | 2025-12-18 |
| Keybanc | Maintain | Overweight | 2025-12-18 |
| Wolfe Research | Maintain | Outperform | 2025-12-18 |
Micron Technology’s grades consistently indicate a strong positive outlook, with multiple “Buy,” “Overweight,” and “Outperform” ratings maintained over recent months.
Cirrus Logic, Inc. Grades
The following table summarizes recent grades assigned to Cirrus Logic, Inc. by reputable grading companies:
| Grading Company | Action | New Grade | Date |
|---|---|---|---|
| Keybanc | Maintain | Overweight | 2025-11-05 |
| Barclays | Maintain | Equal Weight | 2025-11-05 |
| Stifel | Maintain | Buy | 2025-11-05 |
| Benchmark | Maintain | Buy | 2025-11-05 |
| Susquehanna | Maintain | Positive | 2025-10-22 |
| Stifel | Maintain | Buy | 2025-10-17 |
| Stifel | Maintain | Buy | 2025-09-12 |
| Barclays | Maintain | Equal Weight | 2025-05-07 |
| Barclays | Maintain | Equal Weight | 2025-04-22 |
| Stifel | Maintain | Buy | 2025-04-17 |
Cirrus Logic’s grades show a positive but more mixed trend, with several “Buy” ratings supported by “Equal Weight” and “Positive” assessments from notable firms.
Which company has the best grades?
Micron Technology, Inc. has received more consistently positive grades, predominantly “Buy,” “Overweight,” and “Outperform,” indicating stronger analyst confidence compared to Cirrus Logic, Inc., which has more varied ratings including “Equal Weight.” This divergence may influence investors’ perceptions of relative growth potential and risk exposure between the two companies.
Strengths and Weaknesses
Below is a comparison of key strengths and weaknesses between Micron Technology, Inc. (MU) and Cirrus Logic, Inc. (CRUS) based on their most recent financial and operational data.
| Criterion | Micron Technology, Inc. (MU) | Cirrus Logic, Inc. (CRUS) |
|---|---|---|
| Diversification | Strong product diversification with DRAM and NAND segments generating $28.6B and $8.5B in 2025, respectively. | More concentrated in audio and mixed-signal products, with portable audio leading at $1.14B in 2025. |
| Profitability | Favorable net margin at 22.84%, ROIC of 12.12%, but WACC at 10.52% slightly high. | Favorable net margin at 17.48%, higher ROIC of 14.2%, and lower WACC at 8.72%. |
| Innovation | Growing ROIC trend (+8.2%), indicating improving efficiency but overall slightly favorable moat status. | Very favorable moat with strong ROIC vs WACC gap (+5.48%) and robust innovation reflected in high fixed asset turnover (6.62). |
| Global presence | Large global footprint with extensive DRAM and NAND markets, though asset turnover is weak (0.45). | More niche global presence focused on specialized audio markets, better asset turnover (0.81). |
| Market Share | Major player in memory products with significant scale advantages. | Smaller market share but with durable competitive advantage in mixed-signal audio. |
Key takeaways: Micron Technology boasts strong scale and improving profitability but faces challenges in asset efficiency. Cirrus Logic shows a very favorable competitive position with higher capital efficiency and innovation focus, though it operates in a narrower market segment. Investors should weigh MU’s diversification against CRUS’s competitive moat and operational efficiency.
Risk Analysis
Below is a comparative table highlighting key risks for Micron Technology, Inc. (MU) and Cirrus Logic, Inc. (CRUS) based on the most recent data from 2025:
| Metric | Micron Technology, Inc. (MU) | Cirrus Logic, Inc. (CRUS) |
|---|---|---|
| Market Risk | High beta 1.503, volatile price range (61.54-351.23) | Moderate beta 1.084, narrower range (75.83-136.92) |
| Debt level | Low debt/equity 0.28, debt to assets 18.45% (favorable) | Very low debt/equity 0.07, debt to assets 6.18% (favorable) |
| Regulatory Risk | Moderate, semiconductor industry subject to export controls and trade tensions | Moderate, fabless semiconductor supply chain exposure |
| Operational Risk | Scale complexity with 48K employees and multiple business units | Smaller scale (1.6K employees), fabless model reduces manufacturing risk |
| Environmental Risk | Moderate, energy-intensive semiconductor production | Lower, fabless model with less direct manufacturing impact |
| Geopolitical Risk | Elevated, exposure to US-China tensions impacting supply chains | Moderate, global sales but less manufacturing exposure |
In synthesis, the most likely and impactful risks for both companies revolve around market volatility and geopolitical tensions, particularly US-China relations affecting semiconductor supply chains. Micron’s larger scale and manufacturing footprint expose it to higher operational and environmental risks, while Cirrus Logic’s fabless model mitigates some manufacturing and environmental exposure. Both maintain strong balance sheets, reducing financial risk.
Which Stock to Choose?
Micron Technology, Inc. (MU) shows a strong income growth with a 48.85% revenue increase in one year and favorable profitability ratios, including a 22.84% net margin and 15.76% ROE. Its financial structure is solid, with low debt (debt-to-assets 18.45%) and a current ratio of 2.52, supported by a very favorable rating of B and a slightly favorable MOAT status due to growing ROIC but ROIC below WACC.
Cirrus Logic, Inc. (CRUS) reports steady income growth with a 5.99% revenue rise over one year and favorable profit margins, including a 17.48% net margin and 17.01% ROE. Its conservative debt profile (debt-to-assets 6.18%) and very favorable ratings (A-) align with a very favorable MOAT rating, reflecting efficient capital use and durable competitive advantage.
Investors focused on growth might find MU’s strong income momentum and improving profitability appealing, while those prioritizing financial stability and competitive durability may view CRUS’s consistent value creation and very favorable MOAT as more attractive. The choice could depend on risk tolerance and investment strategy.
Disclaimer: Investment carries a risk of loss of initial capital. The past performance is not a reliable indicator of future results. Be sure to understand risks before making an investment decision.
Go Further
I encourage you to read the complete analyses of Micron Technology, Inc. and Cirrus Logic, Inc. to enhance your investment decisions: