In the dynamic world of industrials, Cintas Corporation and Axon Enterprise, Inc. stand out with distinct yet overlapping market roles. Cintas specializes in corporate uniforms and facility services, while Axon leads in law enforcement technology and digital evidence management. Both companies emphasize innovation within their sectors, making this comparison vital for investors seeking growth and stability. Join me as we analyze which company presents the most compelling investment opportunity today.
Table of contents
Companies Overview
I will begin the comparison between Cintas Corporation and Axon Enterprise, Inc. by providing an overview of these two companies and their main differences.
Cintas Corporation Overview
Cintas Corporation specializes in providing corporate identity uniforms and related business services, primarily serving clients in the United States, Canada, and Latin America. Founded in 1968 and headquartered in Cincinnati, Ohio, it operates through segments such as Uniform Rental and Facility Services, First Aid and Safety Services, and others, targeting both small companies and major corporations. The company is a key player in the specialty business services industry.
Axon Enterprise, Inc. Overview
Axon Enterprise, Inc., based in Scottsdale, Arizona, develops and sells conducted energy devices under the TASER brand and offers hardware and cloud-based software solutions for law enforcement. Founded in 1993, Axon operates in the aerospace and defense sector, focusing on products like TASER devices, body cameras, and digital evidence management software. Its sales channels include direct sales, distribution partners, and online platforms.
Key similarities and differences
Both Cintas and Axon operate within the industrial sector but serve distinct markets—Cintas focuses on business services involving uniforms and facility maintenance, whereas Axon targets law enforcement with advanced defense technologies and software solutions. Cintas has a significantly larger workforce and market capitalization, while Axon emphasizes innovation in public safety technology with a higher beta, indicating greater stock volatility.
Income Statement Comparison
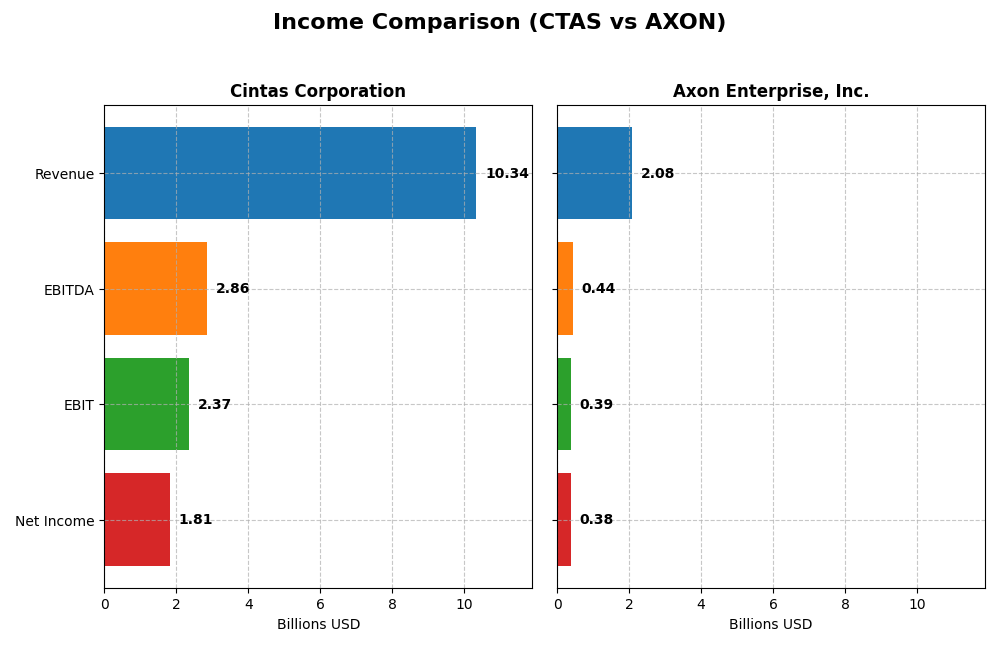
The table below presents a side-by-side comparison of key income statement metrics for Cintas Corporation and Axon Enterprise, Inc. for their most recent fiscal years.
| Metric | Cintas Corporation (2025) | Axon Enterprise, Inc. (2024) |
|---|---|---|
| Market Cap | 74.5B | 44.5B |
| Revenue | 10.3B | 2.08B |
| EBITDA | 2.86B | 437M |
| EBIT | 2.37B | 389M |
| Net Income | 1.81B | 377M |
| EPS | 4.48 | 4.98 |
| Fiscal Year | 2025 | 2024 |
Income Statement Interpretations
Cintas Corporation
Cintas Corporation demonstrated steady revenue growth from $7.1B in 2021 to $10.3B in 2025, with net income rising from $1.1B to $1.8B. Margins remained strong and stable, with gross margin around 50% and net margin improving to 17.5%. In 2025, revenue growth slowed to 7.75%, but EBITDA and net margin expanded, signaling efficient cost control and profitability gains.
Axon Enterprise, Inc.
Axon Enterprise showed rapid revenue growth, surging from $681M in 2020 to $2.08B in 2024, with net income improving from a loss to $377M. Margins are favorable, with a gross margin near 60% and net margin at 18.1%. In 2024, revenue jumped 33.4%, while operating expenses grew at the same pace, slightly pressuring operating leverage despite strong EBIT and EPS growth.
Which one has the stronger fundamentals?
Both companies present favorable income statements overall, with Cintas showing consistent growth and margin stability, reflecting mature operational efficiency. Axon’s fundamentals highlight rapid expansion and margin improvement, albeit with higher expense growth impacting operating leverage. Cintas offers steadiness, while Axon exhibits dynamic growth but with more variability in expense control.
Financial Ratios Comparison
Below is a comparison of the most recent financial ratios for Cintas Corporation and Axon Enterprise, Inc., reflecting data from their latest fiscal years.
| Ratios | Cintas Corporation (CTAS) FY 2025 | Axon Enterprise, Inc. (AXON) FY 2024 |
|---|---|---|
| ROE | 38.7% | 16.2% |
| ROIC | 22.9% | 1.7% |
| P/E | 50.4 | 119.4 |
| P/B | 19.5 | 19.3 |
| Current Ratio | 2.09 | 1.37 |
| Quick Ratio | 1.82 | 1.21 |
| D/E (Debt-to-Equity) | 0.57 | 0.60 |
| Debt-to-Assets | 27.0% | 31.3% |
| Interest Coverage | 23.3 | 8.2 |
| Asset Turnover | 1.05 | 0.47 |
| Fixed Asset Turnover | 5.51 | 8.42 |
| Payout Ratio | 33.7% | 0% |
| Dividend Yield | 0.67% | 0% |
Interpretation of the Ratios
Cintas Corporation
Cintas displays a generally favorable ratio profile with strong profitability indicators, including a net margin of 17.53% and a return on equity of 38.69%. The company maintains a solid current ratio of 2.09 and good interest coverage at 23.39, signaling financial stability. However, valuation ratios like P/E and P/B are relatively high, indicating potential overvaluation. Cintas pays dividends with a modest yield of 0.67%, showing consistent shareholder returns but a payout that may limit yield expansion.
Axon Enterprise, Inc.
Axon exhibits mixed ratio strength, with a favorable net margin of 18.1% but weaker returns on invested capital at 1.66% and an unfavorable weighted average cost of capital at 10.09%. The firm’s liquidity is adequate, though current ratio is neutral at 1.37. Valuation metrics such as P/E and P/B remain high, suggesting premium pricing. Axon does not pay dividends, focusing on reinvestment and R&D, which aligns with its growth-oriented strategy and absence of shareholder distributions.
Which one has the best ratios?
Cintas Corporation holds a more favorable overall ratio profile with 64.29% favorable ratios versus Axon’s 35.71%, reflecting stronger profitability, liquidity, and financial health. Axon faces challenges with higher valuation multiples and weaker returns on capital, alongside a lack of dividends. Thus, Cintas appears more robust based on the current ratio assessments.
Strategic Positioning
This section compares the strategic positioning of Cintas Corporation and Axon Enterprise, Inc. regarding Market position, Key segments, and Exposure to technological disruption:
Cintas Corporation
- Market leader in specialty business services facing moderate competitive pressure in uniform and safety sectors.
- Diverse segments including uniform rental, facility, first aid, safety, fire protection, and direct sales.
- Limited exposure to technological disruption, mainly traditional uniform and facility services with incremental innovation.
Axon Enterprise, Inc.
- Competes in aerospace & defense with innovative TASER and software products, under high market competition.
- Focused on TASER devices and software/sensors for law enforcement digital evidence and situational awareness.
- High exposure to technological disruption through cloud-based software, digital evidence management, and IoT.
Cintas vs Axon Positioning
Cintas shows a diversified business model spanning multiple service segments, offering stability across uniform rental and safety services. Axon concentrates on TASER products and advanced law enforcement technology, emphasizing innovation but narrower market focus.
Which has the best competitive advantage?
Cintas demonstrates a very favorable moat with strong value creation and durable profitability. Axon, despite growing profitability, is currently shedding value, indicating a weaker competitive advantage based on ROIC vs WACC analysis.
Stock Comparison
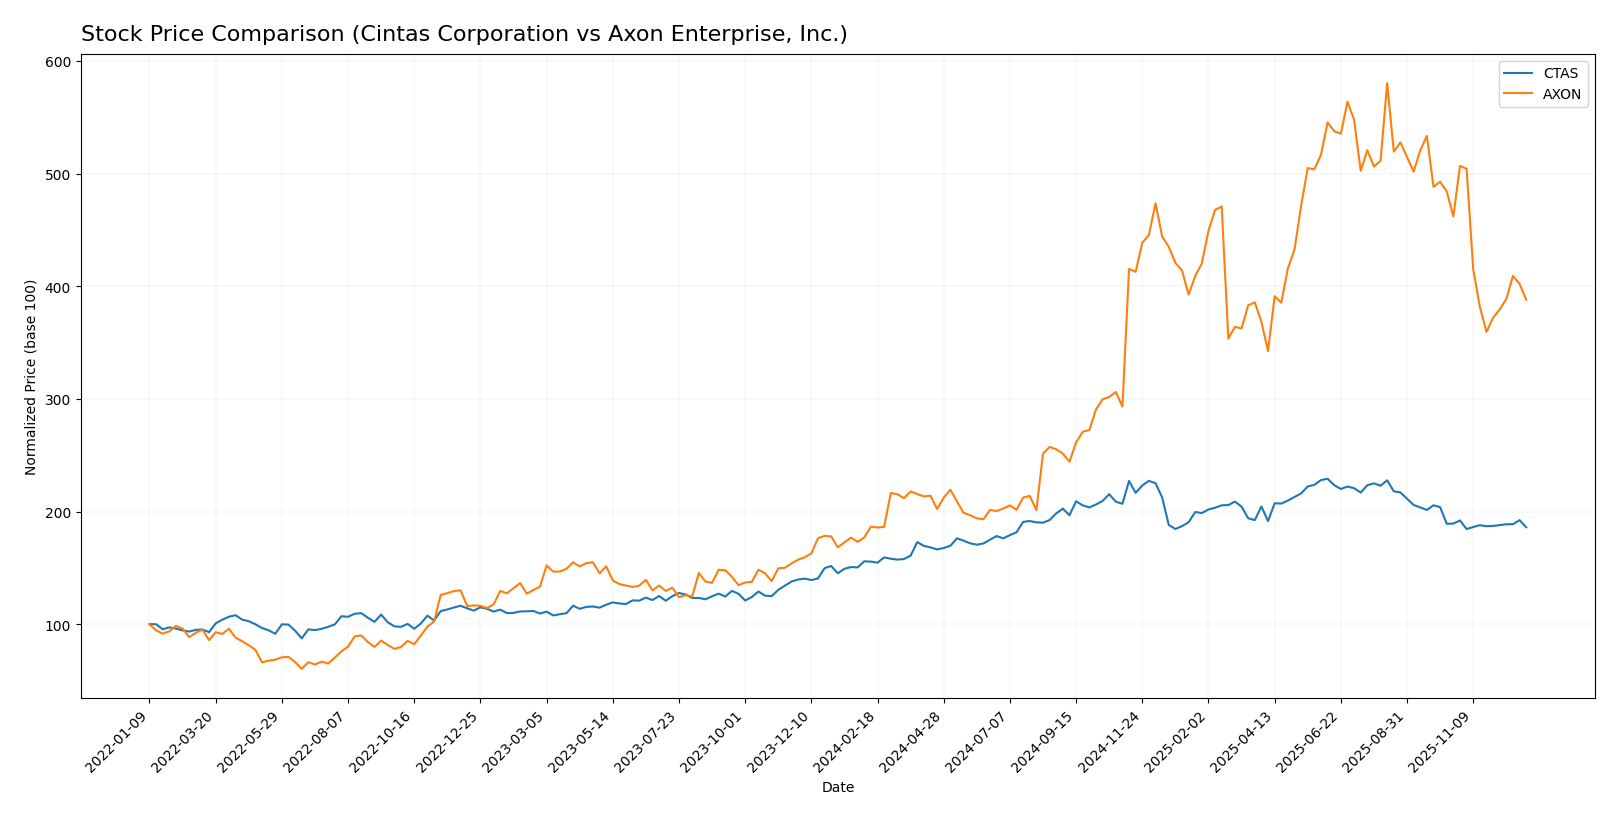
The stock prices of Cintas Corporation (CTAS) and Axon Enterprise, Inc. (AXON) have exhibited significant bullish trends over the past 12 months, with both showing deceleration in momentum and marked fluctuations in trading volumes and price ranges.
Trend Analysis
Cintas Corporation’s stock price increased by 19.62% over the past year, indicating a bullish trend with deceleration in price momentum. The highest price reached was 227.66, and the lowest was 153.67, with volatility reflected by a 19.63 standard deviation. Recent trends show a slight negative change of -1.71% with low slope, suggesting stabilization.
Axon Enterprise’s stock soared by 107.93% over the same period, also bullish but with decelerating acceleration. Price volatility is significantly higher, with a 177.08 standard deviation and price ranging from 269.8 to 842.5. Recent months saw a sharper decline of -15.99% with a steep negative slope, indicating increased short-term weakness.
Comparing the two, Axon Enterprise delivered the highest market performance with a 107.93% annual increase, far surpassing Cintas Corporation’s 19.62% gain despite recent volatility and seller dominance in trading volume.
Target Prices
Analysts present a generally optimistic target consensus for both Cintas Corporation and Axon Enterprise, Inc.
| Company | Target High | Target Low | Consensus |
|---|---|---|---|
| Cintas Corporation | 235 | 184 | 210.83 |
| Axon Enterprise, Inc. | 900 | 713 | 823.88 |
The consensus target prices for Cintas and Axon are notably above their current trading prices of $184.88 and $563.45 respectively, indicating potential upside according to analyst estimates.
Analyst Opinions Comparison
This section compares analysts’ ratings and grades for Cintas Corporation and Axon Enterprise, Inc.:
Rating Comparison
Cintas Corporation Rating
- Rating: B+ indicating a very favorable assessment.
- Discounted Cash Flow Score: Moderate score of 3 showing average valuation.
- ROE Score: Very favorable 5, signaling strong profit generation from equity.
- ROA Score: Very favorable 5, reflecting effective asset utilization.
- Debt To Equity Score: Moderate 3, indicating balanced financial risk.
- Overall Score: Moderate 3, summarizing average financial health.
Axon Enterprise, Inc. Rating
- Rating: C+ representing a moderate assessment.
- Discounted Cash Flow Score: Moderate score of 3 indicating similar valuation.
- ROE Score: Moderate 3, showing average efficiency in generating profit.
- ROA Score: Moderate 3, reflecting average asset use effectiveness.
- Debt To Equity Score: Moderate 2, slightly higher financial risk.
- Overall Score: Moderate 2, indicating somewhat weaker financial health.
Which one is the best rated?
Based on the provided data, Cintas Corporation holds a higher overall rating (B+) and stronger scores in ROE and ROA than Axon Enterprise, which has a lower overall rating (C+) and moderate financial metrics. This indicates Cintas is generally better rated.
Scores Comparison
Here is a comparison of the Altman Z-Score and Piotroski Score for Cintas Corporation and Axon Enterprise, Inc.:
CTAS Scores
- Altman Z-Score: 17.03, indicating a safe zone.
- Piotroski Score: 8, classified as very strong.
AXON Scores
- Altman Z-Score: 8.68, indicating a safe zone.
- Piotroski Score: 4, classified as average.
Which company has the best scores?
Cintas Corporation shows higher scores for both the Altman Z-Score and Piotroski Score, indicating stronger financial health compared to Axon Enterprise, Inc., based strictly on the provided data.
Grades Comparison
Here is the comparison of the latest available grades from reputable grading companies for the two companies:
Cintas Corporation Grades
The following table summarizes recent grades assigned to Cintas Corporation by established financial institutions:
| Grading Company | Action | New Grade | Date |
|---|---|---|---|
| Citigroup | Maintain | Sell | 2025-12-22 |
| Wells Fargo | Maintain | Equal Weight | 2025-12-19 |
| Baird | Maintain | Neutral | 2025-12-19 |
| RBC Capital | Maintain | Sector Perform | 2025-12-19 |
| UBS | Maintain | Buy | 2025-12-19 |
| Morgan Stanley | Maintain | Equal Weight | 2025-12-17 |
| Wells Fargo | Maintain | Equal Weight | 2025-11-25 |
| Citigroup | Maintain | Sell | 2025-09-26 |
| JP Morgan | Maintain | Overweight | 2025-09-25 |
| RBC Capital | Maintain | Sector Perform | 2025-09-25 |
Overall, Cintas Corporation shows a mixed rating trend with multiple “Sell” and “Equal Weight” grades, alongside some “Buy” and “Overweight” ratings.
Axon Enterprise, Inc. Grades
The following table presents the latest grades for Axon Enterprise, Inc. from well-known grading firms:
| Grading Company | Action | New Grade | Date |
|---|---|---|---|
| Morgan Stanley | Maintain | Overweight | 2025-12-17 |
| Barclays | Maintain | Overweight | 2025-11-06 |
| Goldman Sachs | Maintain | Buy | 2025-11-05 |
| Piper Sandler | Maintain | Overweight | 2025-11-05 |
| UBS | Maintain | Neutral | 2025-11-05 |
| JMP Securities | Maintain | Market Outperform | 2025-09-29 |
| Needham | Maintain | Buy | 2025-09-24 |
| B of A Securities | Maintain | Buy | 2025-08-06 |
| UBS | Maintain | Neutral | 2025-08-05 |
| Raymond James | Maintain | Outperform | 2025-08-05 |
Axon Enterprise, Inc. consistently receives positive ratings, predominantly “Buy,” “Overweight,” and “Outperform,” indicating generally favorable analyst views.
Which company has the best grades?
Axon Enterprise, Inc. has received consistently stronger grades compared to Cintas Corporation, which features a more mixed and cautious outlook. This contrast may reflect differing growth prospects or risk perceptions, potentially influencing investor confidence and portfolio positioning.
Strengths and Weaknesses
Below is a summary table highlighting key strengths and weaknesses of Cintas Corporation (CTAS) and Axon Enterprise, Inc. (AXON) based on their recent financial and operational data.
| Criterion | Cintas Corporation (CTAS) | Axon Enterprise, Inc. (AXON) |
|---|---|---|
| Diversification | Highly diversified with multiple segments including Uniform Rental (7.98B), First Aid & Safety (1.22B), Fire Protection (818M), and Direct Sales (329M) | Moderately diversified; main revenue from Software & Sensors (951M) and TASER devices (613M) |
| Profitability | Strong profitability: Net margin 17.5%, ROIC 22.95%, ROE 38.7% | Moderate profitability: Net margin 18.1%, ROE 16.2%, but ROIC low at 1.66% and negative value creation |
| Innovation | Stable with consistent value creation and growing ROIC (+45%) indicating effective capital use | High innovation potential with rapidly growing ROIC (+583%) but currently destroying value (ROIC < WACC) |
| Global presence | Extensive North American and global facility services footprint | Growing global presence focused on law enforcement and security technology markets |
| Market Share | Leading market share in uniform rental and facility services | Expanding share in law enforcement tech with strong brand in TASER and body cams |
Key takeaways: Cintas exhibits a durable competitive advantage with strong profitability and diversified revenue streams, making it a safer, value-creating investment. Axon shows promising innovation and growth potential but currently struggles to generate excess returns, signaling higher risk and need for cautious evaluation.
Risk Analysis
Below is a comparison of key risk factors for Cintas Corporation (CTAS) and Axon Enterprise, Inc. (AXON) as of the most recent fiscal years.
| Metric | Cintas Corporation (CTAS) | Axon Enterprise, Inc. (AXON) |
|---|---|---|
| Market Risk | Beta 0.96 – Moderate market volatility exposure | Beta 1.40 – Higher volatility and sensitivity to market swings |
| Debt level | Debt-to-Equity 0.57 – Moderate leverage, interest coverage 23.4x (strong) | Debt-to-Equity 0.60 – Moderate leverage, interest coverage 54.7x (very strong) |
| Regulatory Risk | Moderate – operates in services with safety regulations | Elevated – Aerospace & Defense sector faces complex regulations |
| Operational Risk | Moderate – large employee base (46.5K), stable operations | Moderate – technology-dependent, smaller workforce (4.1K) |
| Environmental Risk | Low to moderate – facility services may have environmental impact | Low – primarily technology and software products |
| Geopolitical Risk | Low – mainly North America focused | Moderate – international sales expose to geopolitical tensions |
Cintas shows moderate market and operational risks with manageable debt and strong liquidity, while Axon faces higher market volatility and regulatory risks due to its defense industry exposure. Axon’s elevated valuation metrics and lower efficiency scores add to investment caution. Both companies are financially stable with low bankruptcy risk, but Axon’s geopolitical and regulatory risks make it more sensitive to external shocks.
Which Stock to Choose?
Cintas Corporation (CTAS) shows steady income growth with a 45.3% rise over five years and a favorable net margin of 17.53%. Its financial ratios are mostly favorable, highlighting strong profitability and manageable debt, supported by a very favorable B+ rating and a durable competitive moat.
Axon Enterprise, Inc. (AXON) exhibits rapid income growth with 205.8% revenue increase over five years and a net margin of 18.1%. However, its financial ratios reveal several unfavorable metrics, including high valuation multiples and weaker capital efficiency, reflected in a moderate C+ rating and a slightly unfavorable moat due to value destruction.
Investors focused on stability and quality might find CTAS’s consistent profitability, strong financial health, and favorable rating appealing, while those seeking high growth potential and willing to tolerate higher risk might view AXON’s accelerated income growth and improving profitability as attractive, despite its current financial challenges.
Disclaimer: Investment carries a risk of loss of initial capital. The past performance is not a reliable indicator of future results. Be sure to understand risks before making an investment decision.
Go Further
I encourage you to read the complete analyses of Cintas Corporation and Axon Enterprise, Inc. to enhance your investment decisions: