Home > Comparison > Financial Services > WRB vs CINF
The strategic rivalry between W. R. Berkley Corporation and Cincinnati Financial Corporation shapes the competitive landscape of the Property & Casualty insurance sector. W. R. Berkley operates a diversified global insurance and reinsurance model, while Cincinnati Financial focuses on a broad mix of commercial, personal, and life insurance products domestically. This analysis will assess which firm’s operational approach offers superior risk-adjusted returns for a balanced investment portfolio in 2026.

Table of contents
Companies Overview
W. R. Berkley Corporation and Cincinnati Financial Corporation stand as major players in the U.S. property and casualty insurance market.
W. R. Berkley Corporation: Specialty Commercial Lines Innovator
W. R. Berkley Corporation operates primarily as a commercial lines insurance writer with a global footprint. It generates revenue by underwriting diverse commercial insurance products, from premises liability to cyber risk solutions. In 2026, its strategic focus remains on expanding specialty coverages and enhancing reinsurance capabilities to manage risk more effectively.
Cincinnati Financial Corporation: Comprehensive Insurance and Investment Provider
Cincinnati Financial Corporation delivers broad insurance solutions across commercial, personal, and excess lines. It also integrates life insurance and investment management into its revenue model. The company’s 2026 strategy emphasizes diversified insurance offerings and leveraging its investment segment to stabilize returns amid market volatility.
Strategic Collision: Similarities & Divergences
Both firms pursue a broad insurance mandate, but Berkley leans towards niche commercial specialty lines, while Cincinnati balances personal and commercial portfolios with investments. Their primary battleground lies in commercial casualty and property insurance. Berkley’s risk-focused underwriting contrasts with Cincinnati’s diversified asset base, shaping distinct risk-reward profiles for investors.
Income Statement Comparison
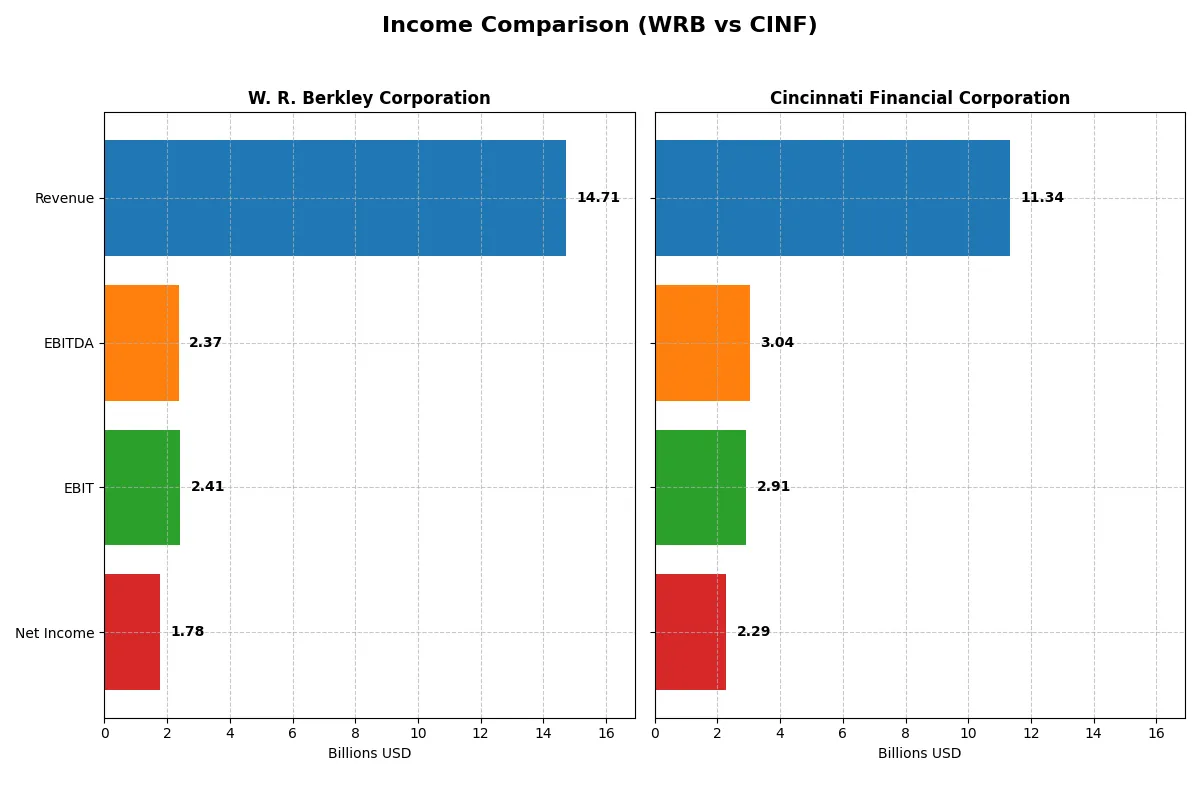
This data dissects the core profitability and scalability of both corporate engines to reveal who dominates the bottom line:
| Metric | W. R. Berkley Corporation (WRB) | Cincinnati Financial Corporation (CINF) |
|---|---|---|
| Revenue | 14.7B | 11.3B |
| Cost of Revenue | 11.8B | 5.7B |
| Operating Expenses | 579M | 2.7B |
| Gross Profit | 2.9B | 5.6B |
| EBITDA | 2.4B | 3.0B |
| EBIT | 2.4B | 2.9B |
| Interest Expense | 127M | 53M |
| Net Income | 1.8B | 2.3B |
| EPS | 4.48 | 14.65 |
| Fiscal Year | 2025 | 2024 |
Income Statement Analysis: The Bottom-Line Duel
This income statement comparison uncovers which company runs its business engine with greater profitability and efficiency.
W. R. Berkley Corporation Analysis
W. R. Berkley Corporation grew revenue from $9.5B in 2021 to $14.7B in 2025, with net income surging from $1.0B to $1.33B. Its gross margin hovers near 20%, showing stable cost control, while net margin at 12.1% reflects solid bottom-line discipline. Despite a slight dip in gross profit last year, EBIT margin remains favorable at 16.35%, signaling resilient operational efficiency.
Cincinnati Financial Corporation Analysis
Cincinnati Financial expanded revenue from $7.5B in 2020 to $11.3B in 2024, with net income jumping from $1.2B to $2.29B. It boasts a robust gross margin of 49.4% and a net margin exceeding 20%, indicating excellent cost management and premium pricing power. The company’s EBIT margin at 25.68% and strong double-digit growth in EPS and net income highlight accelerating profitability momentum.
Margin Strength vs. Profit Growth
Cincinnati Financial outperforms W. R. Berkley on margins and bottom-line growth, reflecting superior profitability and efficiency. While Berkley has steady revenue and EPS growth, Cincinnati’s higher margins and faster net income expansion mark it as the clearer fundamental winner. For investors, Cincinnati’s profile offers greater earnings leverage and margin strength in this comparison.
Financial Ratios Comparison
These vital ratios act as a diagnostic tool to expose the underlying fiscal health, valuation premiums, and capital efficiency of the companies compared below:
| Ratios | W. R. Berkley Corporation (WRB) | Cincinnati Financial Corporation (CINF) |
|---|---|---|
| ROE | 20.9% (2024) | 16.4% (2024) |
| ROIC | N/A | 91.7% (2024) |
| P/E | 13.3 (2024) | 9.81 (2024) |
| P/B | 2.79 (2024) | 1.61 (2024) |
| Current Ratio | N/A | N/A |
| Quick Ratio | N/A | N/A |
| D/E (Debt-to-Equity) | 0.34 (2024) | 0.06 (2024) |
| Debt-to-Assets | 7.0% (2024) | 2.4% (2024) |
| Interest Coverage | 17.8 (2024) | 53.9 (2024) |
| Asset Turnover | 0.34 (2024) | 0.31 (2024) |
| Fixed Asset Turnover | 28.5 (2024) | 53.0 (2024) |
| Payout ratio | 30.3% (2024) | 21.4% (2024) |
| Dividend yield | 2.27% (2024) | 2.18% (2024) |
| Fiscal Year | 2024 | 2024 |
Efficiency & Valuation Duel: The Vital Signs
Financial ratios serve as a company’s DNA, unlocking insights into hidden risks and operational performance that shapes investor decisions.
W. R. Berkley Corporation
WRB posts a favorable net margin of 12.1% but reports an unfavorable ROE at 0%, signaling weak shareholder profitability. Its P/E ratio of 15.63 is neutral, suggesting the stock is fairly valued. The firm supports shareholders with a 2.64% dividend yield, reflecting steady income over aggressive growth.
Cincinnati Financial Corporation
CINF shines with a robust 20.22% net margin and a strong 16.45% ROE, indicating efficient capital use. Its low P/E of 9.81 marks the stock as attractively priced. The company balances growth and returns, offering a 2.18% dividend yield alongside a highly favorable ROIC of 9168%, showing excellent reinvestment effectiveness.
Operational Strength vs. Valuation Appeal
CINF delivers superior profitability and a more favorable valuation multiple, underpinning stronger operational efficiency. WRB provides a modest dividend but lags in shareholder returns. Investors prioritizing robust capital returns may prefer CINF’s profile, while those seeking stable dividends might lean toward WRB.
Which one offers the Superior Shareholder Reward?
I compare W. R. Berkley Corporation (WRB) and Cincinnati Financial Corporation (CINF) by their dividend yields, payout ratios, and buyback intensity. WRB yields 2.64% with a 41% payout, balancing dividends and buybacks, enhancing sustainable returns. CINF yields slightly less at 2.18%, with a 21% payout, signaling more retained earnings for growth. Both maintain robust free cash flow coverage above 90%, but CINF’s lower leverage and higher profit margins suggest stronger capital allocation efficiency. WRB’s higher payout and buyback activity provide steadier income, but CINF’s reinvestment edge favors long-term value. In 2026, I find CINF offers a superior total return profile due to its sustainable growth and efficient capital deployment.
Comparative Score Analysis: The Strategic Profile
The radar chart reveals the fundamental DNA and trade-offs of W. R. Berkley Corporation and Cincinnati Financial Corporation:
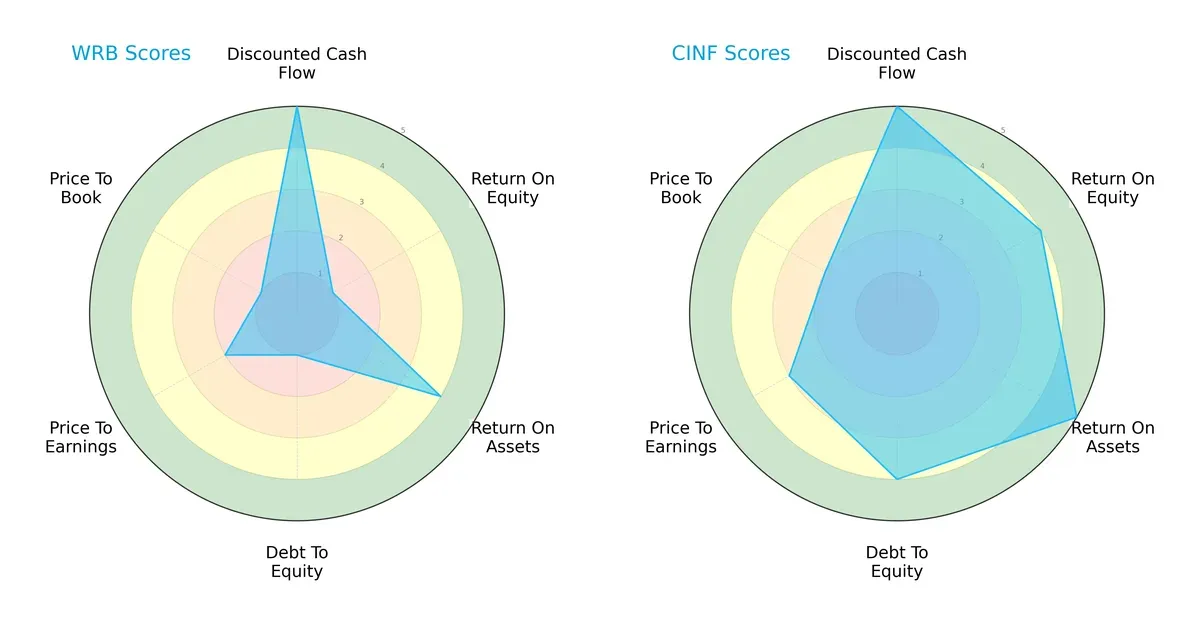
I observe Cincinnati Financial dominates with a balanced profile: strong ROE (4), ROA (5), and debt management (4). W. R. Berkley relies heavily on DCF strength (5) but struggles with ROE (1) and debt control (1). Cincinnati offers more consistent financial health and valuation metrics.
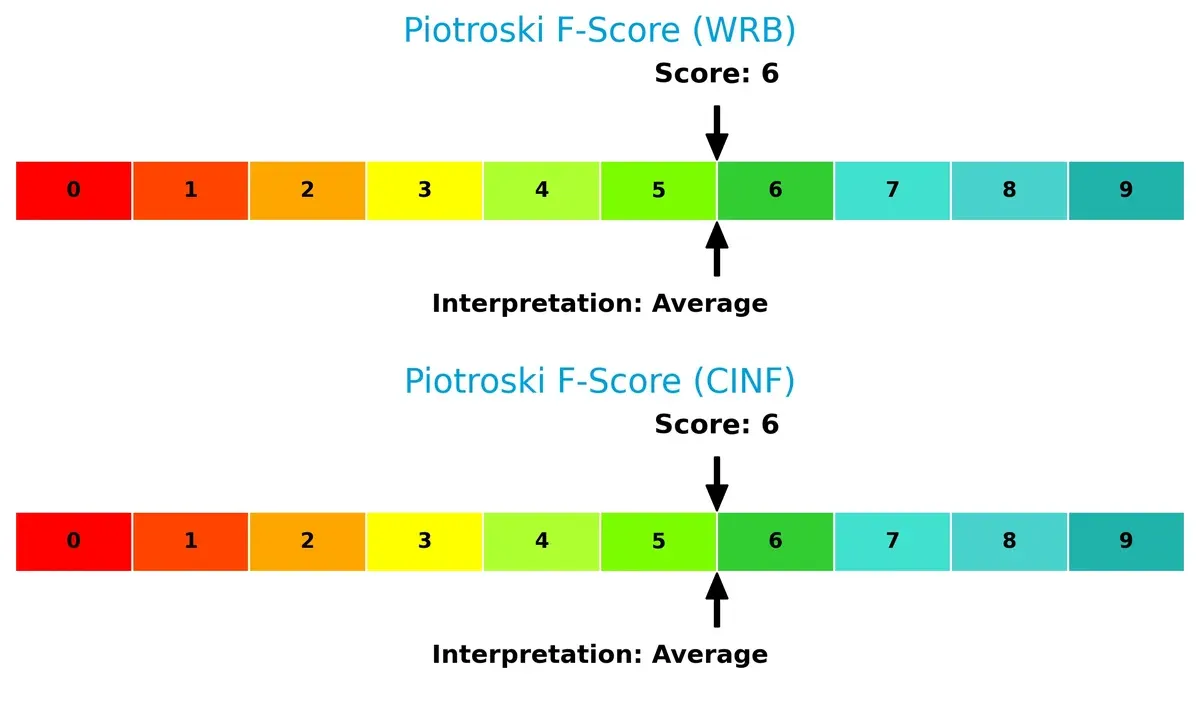
Financial Health: Quality of Operations
Both companies score a 6 on the Piotroski F-Score, indicating average financial strength. Neither shows immediate red flags, but investors should watch for improvements to reach strong health levels:
Bankruptcy Risk: Solvency Showdown
Altman Z-Score is only available for Cincinnati Financial, which sits at 1.66 in the distress zone. This warns of moderate bankruptcy risk under current economic conditions. Without WRB’s Z-Score, I cannot compare solvency directly:
How are the two companies positioned?
This section dissects the operational DNA of WRB and CINF by comparing their revenue distribution and internal strengths and weaknesses. The goal is to confront their economic moats to identify which model offers the most resilient competitive advantage today.
Revenue Segmentation: The Strategic Mix
This visual comparison dissects how W. R. Berkley Corporation and Cincinnati Financial Corporation diversify income streams and where their primary sector bets lie:
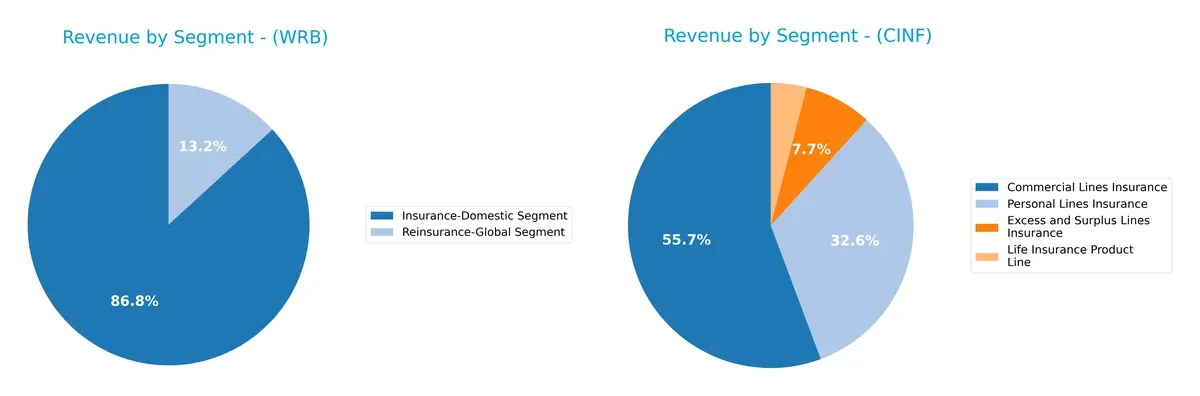
W. R. Berkley anchors revenue in its Insurance-Domestic segment with $11.2B in 2024, dwarfing its $1.7B Reinsurance-Global segment. Cincinnati Financial presents a more balanced portfolio, with $4.5B Commercial Lines and $2.6B Personal Lines insurance revenue. WRB’s heavy reliance on domestic insurance signals concentration risk but strong market specialization. CINF’s diversified insurance mix mitigates sector volatility, enhancing resilience through multiple insurance lines.
Strengths and Weaknesses Comparison
This table compares the Strengths and Weaknesses of W. R. Berkley Corporation and Cincinnati Financial Corporation:
WRB Strengths
- Strong domestic insurance revenue above 11B USD
- Favorable net margin at 12.1%
- Low debt to assets ratio
- High interest coverage ratio at 18.95
- Dividend yield at 2.64%
CINF Strengths
- Higher net margin at 20.22%
- Strong ROE at 16.45% and ROIC far exceeding WACC
- Favorable PE ratio at 9.81
- Significant fixed asset turnover at 52.98
- Low debt to assets at 2.4%
- High interest coverage at 54.92
- Dividend yield at 2.18%
WRB Weaknesses
- Unfavorable ROE and ROIC at 0%
- Missing WACC data
- Poor liquidity ratios (current and quick ratios at 0)
- Unfavorable asset and fixed asset turnover
- Neutral PE ratio
CINF Weaknesses
- Unfavorable liquidity ratios (current and quick ratios at 0)
- Asset turnover low at 0.31
- Neutral PB ratio
Both companies show strengths in profitability and debt management, but WRB’s lack of liquidity and returns metrics contrast with CINF’s robust capital efficiency. This comparison highlights the strategic importance of improving liquidity and asset utilization for WRB.
The Moat Duel: Analyzing Competitive Defensibility
A structural moat is the only reliable shield guarding long-term profits from relentless competitive pressure. Let’s break down the moat quality of two insurance giants:
W. R. Berkley Corporation: Diversified Specialty Underwriting Moat
WRB leverages specialized underwriting expertise and diversified commercial lines to stabilize margins and sustain a 12% net margin. Its moat lacks clear ROIC data, but steady revenue growth and product expansion suggest moderate resilience in 2026.
Cincinnati Financial Corporation: Capital Efficiency and Margin Powerhouse
CINF’s moat stems from superior capital allocation, reflected in an ROIC vastly exceeding WACC by 9161 bps and a strong 20% net margin. Its growing ROIC trend confirms durable profitability, with 2026 prospects brightened by expanding personal and commercial insurance segments.
Capital Efficiency vs. Specialty Expertise: The Moat Verdict
CINF exhibits a deeper moat, proven by its exceptional ROIC spread and margin expansion, signaling robust value creation. WRB’s moat, while stable, lacks the same capital efficiency, making Cincinnati Financial better equipped to defend market share amid rising competition.
Which stock offers better returns?
The past year shows clear bullish trends for both stocks, with W. R. Berkley’s growth slowing recently, while Cincinnati Financial maintains steady gains amid shifting trading volumes.
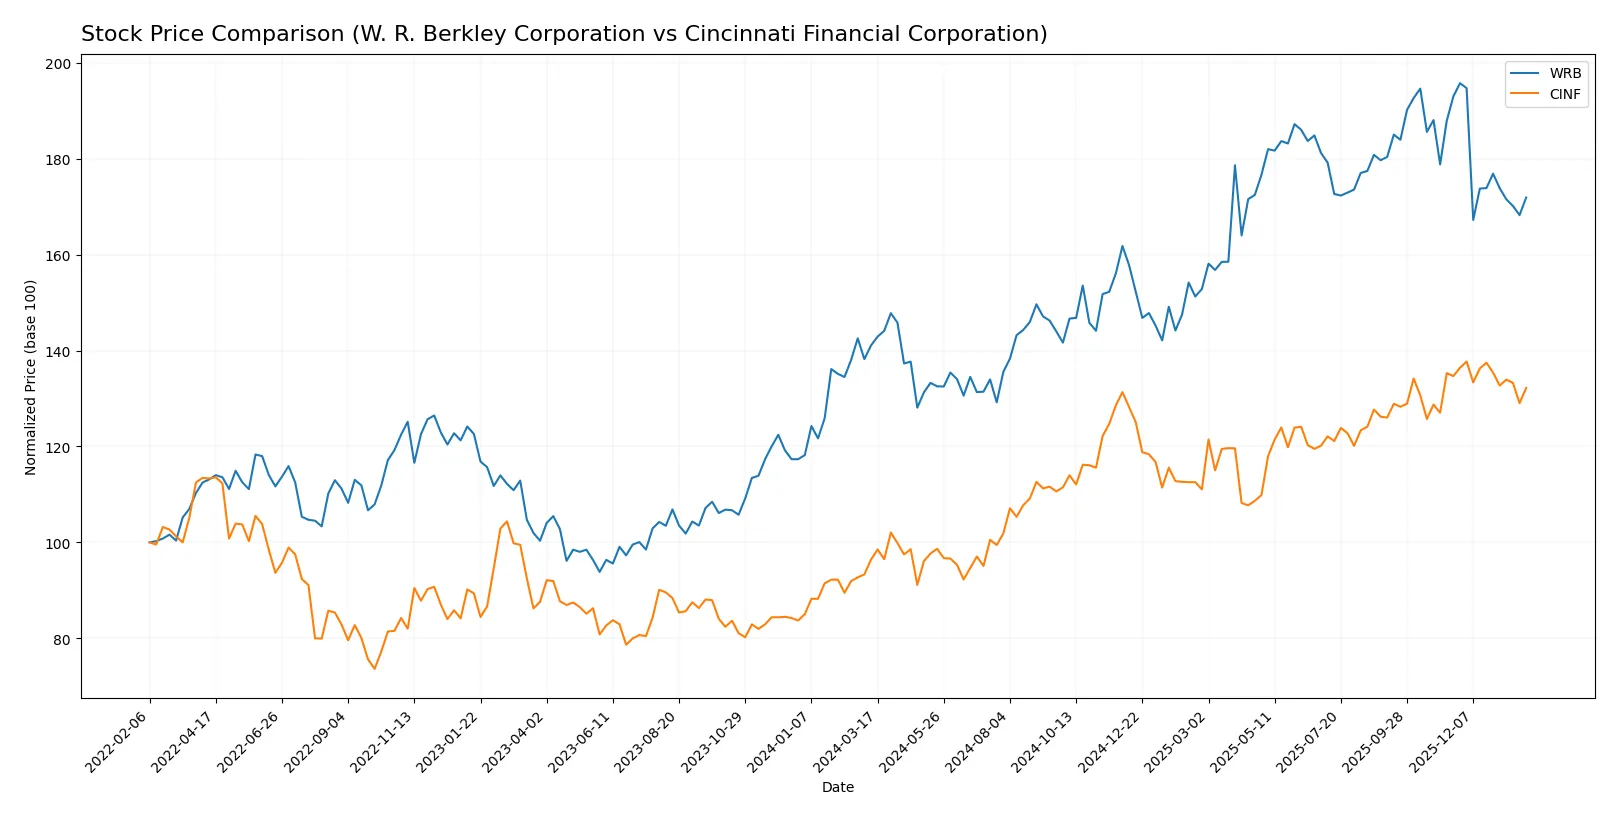
Trend Comparison
W. R. Berkley’s stock rose 21.88% over the past year, signaling a bullish trend despite decelerating momentum and a recent 10.94% decline since November 2025. Volatility measured by 7.84% standard deviation.
Cincinnati Financial gained 37.17% over the same period, also bullish but decelerating. Recent price change is a mild 1.84% dip, with higher volatility at 15.35% standard deviation reflecting larger price swings.
Cincinnati Financial delivered the highest market performance with 37.17% growth versus W. R. Berkley’s 21.88%, demonstrating stronger overall gains despite recent minor pullbacks.
Target Prices
Analysts present a clear consensus on target prices for W. R. Berkley Corporation and Cincinnati Financial Corporation.
| Company | Target Low | Target High | Consensus |
|---|---|---|---|
| W. R. Berkley Corporation | 64 | 87 | 72.55 |
| Cincinnati Financial Corporation | 157 | 175 | 166 |
The target consensus for W. R. Berkley suggests a modest upside from its current 68.58 price. Cincinnati Financial’s target consensus indicates a stronger upside potential versus its 160.89 market price.

Don’t Let Luck Decide Your Entry Point
Optimize your entry points with our advanced ProRealTime indicators. You’ll get efficient buy signals with precise price targets for maximum performance. Start outperforming now!
How do institutions grade them?
Below is a comparison of recent institutional grades for W. R. Berkley Corporation and Cincinnati Financial Corporation:
W. R. Berkley Corporation Grades
The following table shows recent grade actions from reputable grading companies for W. R. Berkley Corporation.
| Grading Company | Action | New Grade | Date |
|---|---|---|---|
| Truist Securities | Maintain | Buy | 2026-01-28 |
| Wells Fargo | Maintain | Equal Weight | 2026-01-27 |
| Jefferies | Maintain | Hold | 2026-01-27 |
| Mizuho | Maintain | Neutral | 2026-01-27 |
| B of A Securities | Maintain | Neutral | 2026-01-27 |
| TD Cowen | Downgrade | Sell | 2026-01-20 |
| Cantor Fitzgerald | Maintain | Overweight | 2026-01-14 |
| Wells Fargo | Maintain | Equal Weight | 2026-01-13 |
| Barclays | Maintain | Underweight | 2026-01-08 |
| Evercore ISI Group | Downgrade | Underperform | 2026-01-07 |
Cincinnati Financial Corporation Grades
This table summarizes recent grades from credible grading companies for Cincinnati Financial Corporation.
| Grading Company | Action | New Grade | Date |
|---|---|---|---|
| Keefe, Bruyette & Woods | Maintain | Outperform | 2026-01-06 |
| Piper Sandler | Maintain | Neutral | 2025-12-22 |
| Keefe, Bruyette & Woods | Maintain | Outperform | 2025-11-04 |
| B of A Securities | Maintain | Buy | 2025-10-28 |
| B of A Securities | Maintain | Buy | 2025-10-13 |
| Keefe, Bruyette & Woods | Maintain | Outperform | 2025-10-06 |
| Keefe, Bruyette & Woods | Maintain | Outperform | 2025-08-05 |
| Roth Capital | Maintain | Buy | 2025-07-29 |
| Keefe, Bruyette & Woods | Maintain | Outperform | 2025-07-09 |
| Keefe, Bruyette & Woods | Maintain | Outperform | 2025-04-09 |
Which company has the best grades?
Cincinnati Financial Corporation consistently receives higher grades, mainly “Outperform” and “Buy,” compared to W. R. Berkley’s mixed ratings including downgrades. Investors may interpret this as stronger institutional confidence in Cincinnati Financial.
Risks specific to each company
The following categories identify the critical pressure points and systemic threats facing both firms in the 2026 market environment:
1. Market & Competition
W. R. Berkley Corporation
- Faces intense competition in commercial insurance and reinsurance segments with global exposure risks.
Cincinnati Financial Corporation
- Diversified across commercial, personal, and life insurance lines, leveraging a broader product mix to mitigate competitive pressure.
2. Capital Structure & Debt
W. R. Berkley Corporation
- Maintains a favorable debt profile with strong interest coverage but shows gaps in liquidity ratios.
Cincinnati Financial Corporation
- Exhibits low debt-to-equity and strong interest coverage, indicating a robust and conservative capital structure.
3. Stock Volatility
W. R. Berkley Corporation
- Low beta (0.388) suggests lower volatility, appealing for risk-averse investors.
Cincinnati Financial Corporation
- Moderate beta (0.673) indicates higher sensitivity to market swings but still below market average.
4. Regulatory & Legal
W. R. Berkley Corporation
- Subject to complex international and U.S. insurance regulations, increasing compliance costs and legal risks.
Cincinnati Financial Corporation
- Primarily U.S.-focused with regulatory risks concentrated domestically, potentially easier to manage.
5. Supply Chain & Operations
W. R. Berkley Corporation
- Operational risks stem from underwriting diverse and specialty insurance products globally.
Cincinnati Financial Corporation
- Operational efficiency benefits from a balanced portfolio but relies heavily on U.S. market conditions.
6. ESG & Climate Transition
W. R. Berkley Corporation
- Faces pressures on underwriting environmental and climate-related risks amid increasing regulatory expectations.
Cincinnati Financial Corporation
- ESG integration advancing, but exposure to climate risk remains a critical focus for long-term stability.
7. Geopolitical Exposure
W. R. Berkley Corporation
- International operations expose it to geopolitical uncertainties and currency fluctuations.
Cincinnati Financial Corporation
- Concentrated U.S. operations limit geopolitical risk but increase exposure to domestic policy shifts.
Which company shows a better risk-adjusted profile?
W. R. Berkley’s most impactful risk is its uneven liquidity ratios combined with international geopolitical exposure. Cincinnati Financial’s key risk lies in its moderate stock volatility and domestic regulatory environment. Cincinnati Financial demonstrates a better risk-adjusted profile, underscored by superior capital structure and profitability metrics, despite its Altman Z-Score indicating distress risk. This juxtaposition signals the need for cautious monitoring but favors Cincinnati’s operational and financial resilience.
Final Verdict: Which stock to choose?
W. R. Berkley Corporation’s superpower lies in its resilient cash flow generation and disciplined capital allocation. Its point of vigilance is the limited visibility on return on invested capital, which clouds its competitive edge clarity. WRB might suit investors seeking exposure in an aggressive growth portfolio with moderate risk tolerance.
Cincinnati Financial Corporation boasts a robust strategic moat, reflected in its soaring ROIC well above its cost of capital, signaling durable competitive advantage. It presents a more conservative risk profile compared to WRB, making it appealing for growth-at-a-reasonable-price (GARP) portfolios prioritizing stability and value creation.
If you prioritize durable competitive advantage and financial efficiency, Cincinnati Financial outshines WRB with its superior ROIC and consistent profitability. However, if you seek growth potential with a willingness to tolerate some uncertainty in capital returns, WRB offers an attractive scenario. Both require careful risk assessment aligned with your investment horizon.
Disclaimer: Investment carries a risk of loss of initial capital. The past performance is not a reliable indicator of future results. Be sure to understand risks before making an investment decision.
Go Further
I encourage you to read the complete analyses of W. R. Berkley Corporation and Cincinnati Financial Corporation to enhance your investment decisions: