Home > Comparison > Financial Services > TRV vs CINF
The strategic rivalry between The Travelers Companies, Inc. and Cincinnati Financial Corporation shapes the competitive landscape of the Property & Casualty insurance sector. Travelers operates as a large, diversified insurer with broad commercial and personal lines, while Cincinnati focuses on niche segments including life insurance and surplus lines. This analysis explores their contrasting operational models and growth trajectories to identify which company offers superior risk-adjusted returns for a balanced portfolio.

Table of contents
Companies Overview
The Travelers Companies, Inc. and Cincinnati Financial Corporation command significant shares of the U.S. property and casualty insurance market.
The Travelers Companies, Inc.: Insurance Powerhouse with Broad Reach
The Travelers Companies, Inc. stands as a leading provider in commercial and personal property and casualty insurance. It generates revenue through three key segments: Business Insurance, Bond & Specialty Insurance, and Personal Insurance. In 2026, its strategic focus emphasizes diversified risk management and expanding commercial accounts across small to large businesses, leveraging brokers and wholesale agents to deepen market penetration.
Cincinnati Financial Corporation: Diversified Insurer with Investment Edge
Cincinnati Financial Corporation operates as a versatile insurer offering commercial, personal, excess and surplus lines, life insurance, and investment services. Its core revenue stems from commercial and personal lines insurance, supplemented by life insurance and fixed-maturity investments. The company’s 2026 strategy prioritizes broadening commercial casualty coverage and enhancing investment income to complement underwriting profits.
Strategic Collision: Similarities & Divergences
Both firms dominate the property and casualty insurance space but differ in scope and diversification. Travelers emphasizes a segmented, specialized approach with strong broker networks. Cincinnati blends insurance with a significant investment portfolio, creating a hybrid model. They primarily compete in commercial insurance lines, yet Travelers targets scale while Cincinnati balances underwriting and investment returns. Their distinct strategies shape divergent risk exposures and growth trajectories.
Income Statement Comparison
The following data dissects the core profitability and scalability of both corporate engines to reveal who dominates the bottom line:
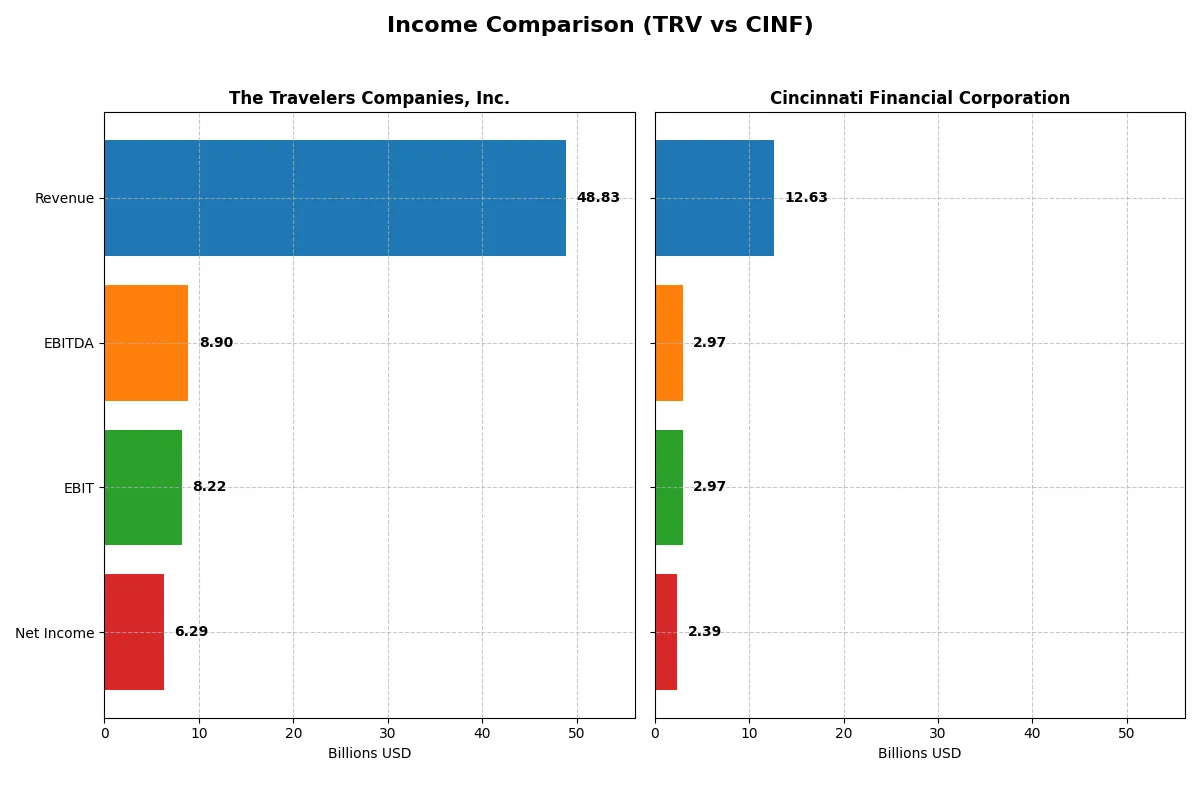
| Metric | The Travelers Companies, Inc. (TRV) | Cincinnati Financial Corporation (CINF) |
|---|---|---|
| Revenue | 48.8B | 12.6B |
| Cost of Revenue | 27.2B | 6.3B |
| Operating Expenses | 13.8B | 3.4B |
| Gross Profit | 21.6B | 6.3B |
| EBITDA | 8.9B | 3.0B |
| EBIT | 8.2B | 3.0B |
| Interest Expense | 425M | 5.3M |
| Net Income | 6.3B | 2.4B |
| EPS | 27.84 | 15.17 |
| Fiscal Year | 2025 | 2025 |
Income Statement Analysis: The Bottom-Line Duel
This income statement comparison reveals which company operates with superior efficiency and profit generation in 2025.
The Travelers Companies, Inc. Analysis
TRV’s revenue rose steadily to $48.8B in 2025, with net income jumping to $6.3B, reflecting strong momentum. Its gross margin surged to 44.25%, and net margin improved to 12.88%, signaling robust cost control despite rising operating expenses. TRV demonstrates impressive earnings growth and margin expansion, highlighting operational efficiency.
Cincinnati Financial Corporation Analysis
CINF increased revenue to $12.6B in 2025, growing 11.4% year-over-year, but net income declined to $2.4B, with net margin dropping to 18.95%. Gross margin remains strong at 50.12%, yet net margin and EPS growth faltered, indicating pressure on profitability despite top-line gains. Operating expenses rose in line with revenue, dampening net income momentum.
Margin Expansion vs. Revenue Growth Resilience
TRV outperforms with a 71.7% net income growth over five years and expanding margins, reflecting superior profit efficiency. CINF delivers solid revenue gains but suffers margin contraction and negative net income growth overall. For investors prioritizing sustained earnings power and margin improvement, TRV’s profile appears more attractive.
Financial Ratios Comparison
These vital ratios serve as a diagnostic tool to expose underlying fiscal health, valuation premiums, and capital efficiency for a clear comparative view:
| Ratios | The Travelers Companies, Inc. (TRV) | Cincinnati Financial Corporation (CINF) |
|---|---|---|
| ROE | 19.1% | 15.0% |
| ROIC | 12.0% | 56.1% |
| P/E | 10.3 | 10.8 |
| P/B | 2.0 | 1.6 |
| Current Ratio | 0.23 | 5.93 |
| Quick Ratio | 0.23 | 5.93 |
| D/E | 0.28 | 0.05 |
| Debt-to-Assets | 6.4% | 2.1% |
| Interest Coverage | 18.3x | 560.0x |
| Asset Turnover | 0.34 | 0.31 |
| Fixed Asset Turnover | 0.0 | 57.7 |
| Payout ratio | 15.6% | 22.9% |
| Dividend yield | 1.5% | 2.1% |
| Fiscal Year | 2025 | 2025 |
Efficiency & Valuation Duel: The Vital Signs
Financial ratios serve as a company’s DNA, exposing hidden risks and operational strengths critical to investment decisions.
The Travelers Companies, Inc.
The Travelers Companies delivers a strong 19.12% ROE and solid 12.88% net margin, indicating efficient profitability. Its P/E of 10.34 suggests a reasonably priced stock, neither stretched nor expensive. The company yields a modest 1.51% dividend, balancing shareholder returns with reinvestment in stable operations. However, a low current ratio of 0.23 flags liquidity concerns.
Cincinnati Financial Corporation
Cincinnati Financial posts a robust 18.95% net margin and a 15.04% ROE, reflecting effective profit generation. Its P/E of 10.77 is slightly higher but remains attractive given a very favorable 56.09% ROIC. The firm offers a 2.13% dividend yield, rewarding shareholders while maintaining healthy capital discipline. Its strong quick ratio of 5.93 signals excellent short-term financial health.
Robust Profitability vs. Superior Capital Efficiency
Cincinnati Financial edges ahead with superior ROIC and a stronger liquidity profile, despite a slightly higher P/E. Travelers shows consistent profitability but carries liquidity risks. Investors seeking capital efficiency and dividend income may lean toward Cincinnati, while those valuing stable operations might consider Travelers’ profile.
Which one offers the Superior Shareholder Reward?
I compare The Travelers Companies, Inc. (TRV) and Cincinnati Financial Corporation (CINF) on dividend yield, payout ratio, and buybacks. TRV yields ~1.5% with a payout ratio near 16%, supported by strong free cash flow and consistent buybacks fueling shareholder returns. CINF offers a higher yield around 2.1%, with a payout ratio near 23%, balancing dividends with moderate buybacks. TRV’s lower payout and robust cash flow coverage suggest a more sustainable distribution during market cycles. CINF’s higher margin and yield appeal but carry higher payout risk. I find TRV’s disciplined capital allocation yields a superior total return profile for 2026 investors.
Comparative Score Analysis: The Strategic Profile
The radar chart reveals the fundamental DNA and trade-offs of The Travelers Companies, Inc. and Cincinnati Financial Corporation:
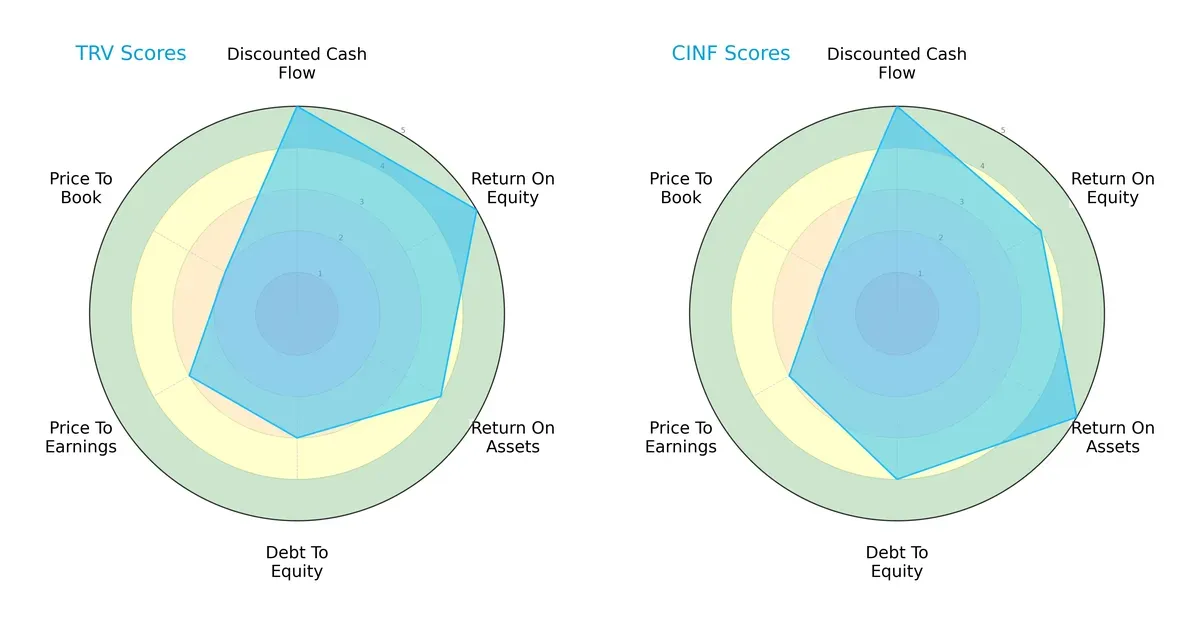
Both firms share a very favorable DCF score of 5, signaling strong cash flow projections. Travelers (TRV) leads in return on equity with a perfect score of 5, while Cincinnati (CINF) excels in return on assets at 5. Cincinnati also maintains a stronger debt-to-equity profile (4 vs. 3), reflecting a more conservative balance sheet. Both show moderate valuation scores (P/E 3, P/B 2), indicating similar market pricing. Overall, Travelers leans on equity efficiency, while Cincinnati balances asset utilization and leverage more evenly.
Bankruptcy Risk: Solvency Showdown
The Altman Z-Scores place both firms in the distress zone but reveal a notable gap:
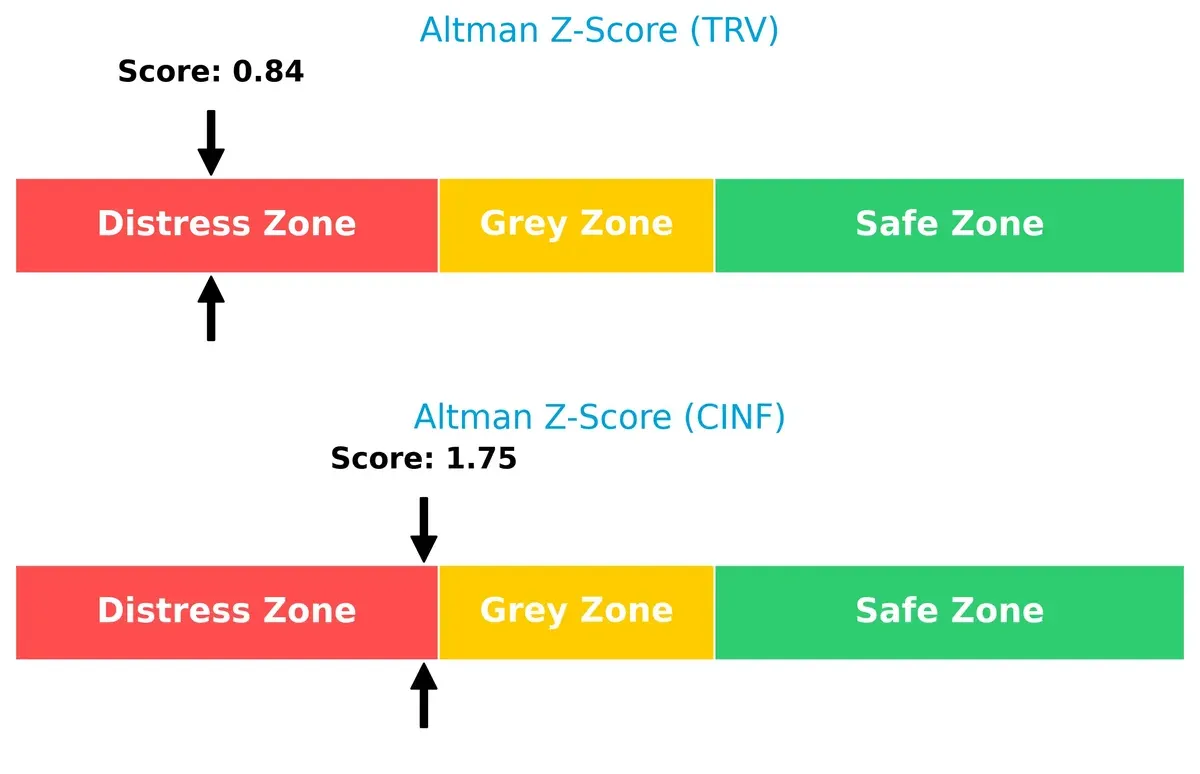
Travelers scores 0.84, signaling higher bankruptcy risk, whereas Cincinnati’s 1.75 score is nearly double, indicating moderately better solvency. Historically, firms below 1.8 face serious financial challenges, so both require close monitoring amid economic fluctuations.
Financial Health: Quality of Operations
Piotroski F-Scores show both companies in strong financial health with a score of 7 each:
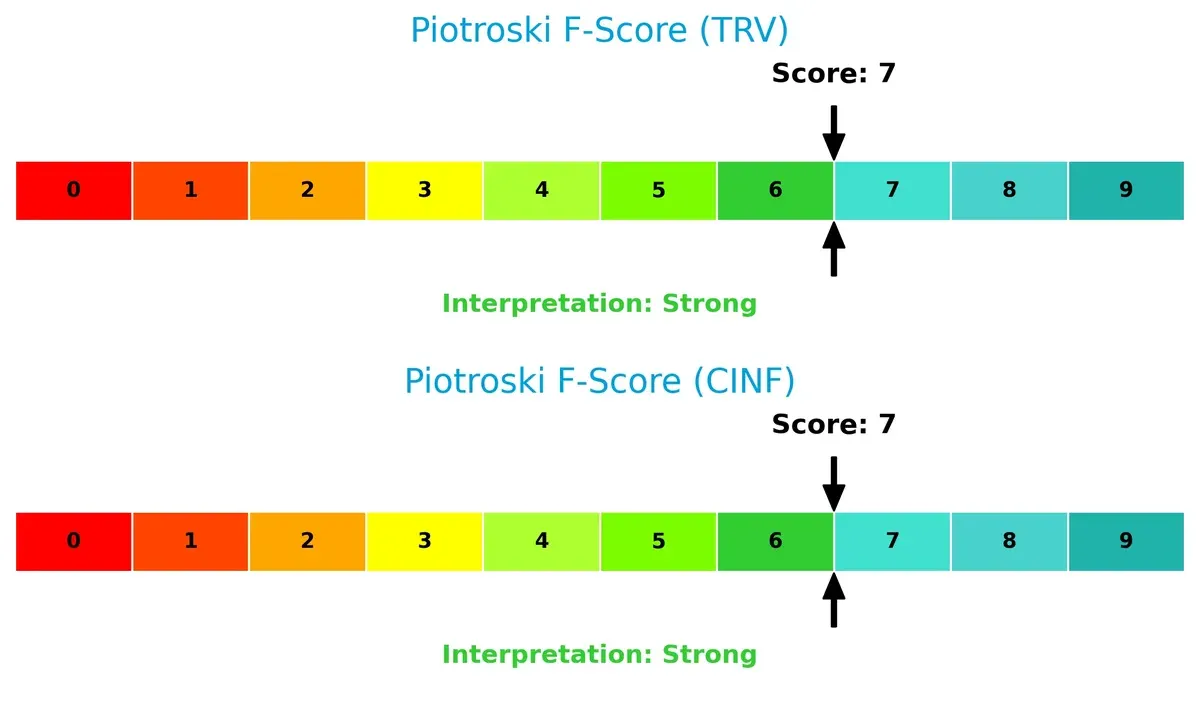
This suggests solid internal operations and profitability for both. No immediate red flags appear in their fundamentals, but the identical scores underscore the need to watch how each firm executes capital allocation in volatile markets.
How are the two companies positioned?
This section dissects TRV and CINF’s operational DNA by comparing their revenue distribution and internal dynamics, including strengths and weaknesses. The goal is to confront their economic moats and identify which model offers the most resilient competitive advantage today.
Revenue Segmentation: The Strategic Mix
This visual comparison dissects how The Travelers Companies, Inc. and Cincinnati Financial Corporation diversify income streams and reveals their primary sector bets:
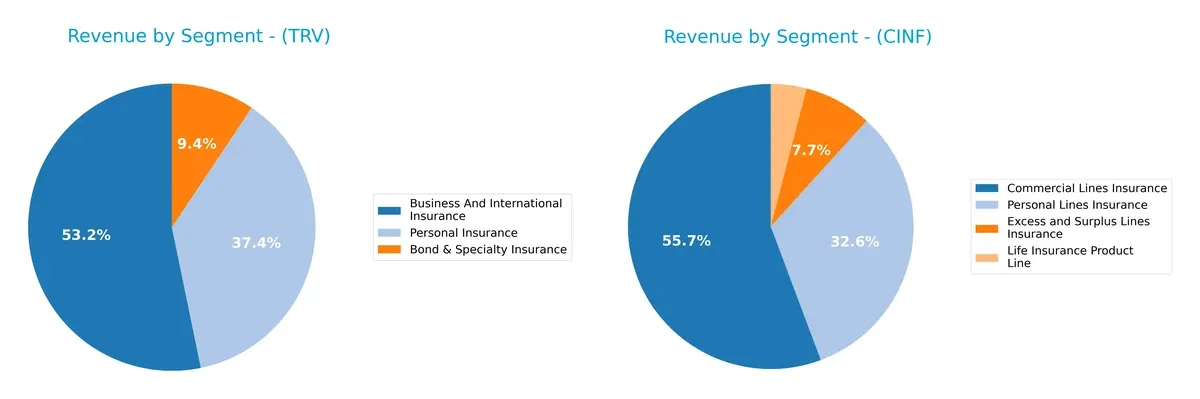
Travelers anchors revenue in Business and International Insurance at $26B, with Personal Insurance and Bond & Specialty Insurance trailing at $18B and $4.6B. Cincinnati Financial shows a more balanced mix, with Commercial Lines Insurance at $4.5B and Personal Lines Insurance at $2.6B, plus smaller contributions from Excess and Surplus Lines and Life Insurance. Travelers’ concentration signals infrastructure dominance but increases risk exposure, while Cincinnati’s spread suggests prudent diversification.
Strengths and Weaknesses Comparison
This table compares the Strengths and Weaknesses of The Travelers Companies, Inc. and Cincinnati Financial Corporation:
TRV Strengths
- Diversified revenue across Bond & Specialty, Business, and Personal Insurance
- Favorable profitability with 12.88% net margin and 19.12% ROE
- Strong capital structure with low debt-to-assets at 6.45%
- Global presence including significant U.S., Canada, and Non-U.S. operations
CINF Strengths
- High profitability with 18.95% net margin and exceptional 56.09% ROIC
- Strong liquidity with current and quick ratios at 5.93
- Very low debt levels at 5% DE ratio and 2.1% debt-to-assets
- Dividend yield of 2.13% and strong asset turnover at 57.68
TRV Weaknesses
- Low liquidity with current and quick ratios at 0.23, a red flag
- Asset turnover is weak at 0.34, limiting operational efficiency
- Fixed asset turnover is zero, suggesting underutilized assets
CINF Weaknesses
- Current ratio flagged unfavorable despite strong quick ratio, indicating possible inventory issues
- Asset turnover of 0.31 is low, reducing revenue generation efficiency
Both companies show solid profitability and low leverage, but TRV’s liquidity and asset efficiency lag behind CINF’s robust operational metrics. CINF’s high ROIC and liquidity bolster its financial resilience, while TRV’s broader geographic diversification supports steady revenue streams. These contrasts suggest different strategic priorities: TRV focuses on scale and diversification, whereas CINF emphasizes operational efficiency and capital strength.
The Moat Duel: Analyzing Competitive Defensibility
A structural moat protects long-term profits from relentless competition and market forces. It is the firm’s key defense mechanism:
The Travelers Companies, Inc.: Intangible Assets Moat
I see Travelers’ moat in its trusted brand and underwriting expertise. This drives stable margins and a growing ROIC, supported by diversified insurance lines. New specialty products in 2026 may deepen its advantage.
Cincinnati Financial Corporation: Cost Advantage Moat
Cincinnati’s moat stems from disciplined expense management and efficient capital use, delivering superior margins versus Travelers. Despite slower EBIT growth, its lean operations offer resilience and potential in niche markets.
Intangible Brand Strength vs. Operational Efficiency
Both firms show very favorable moats with growing ROICs, but Cincinnati’s exceptional cost advantage delivers a wider moat. Yet, Travelers’ brand equity positions it better to defend market share amid evolving risks.
Which stock offers better returns?
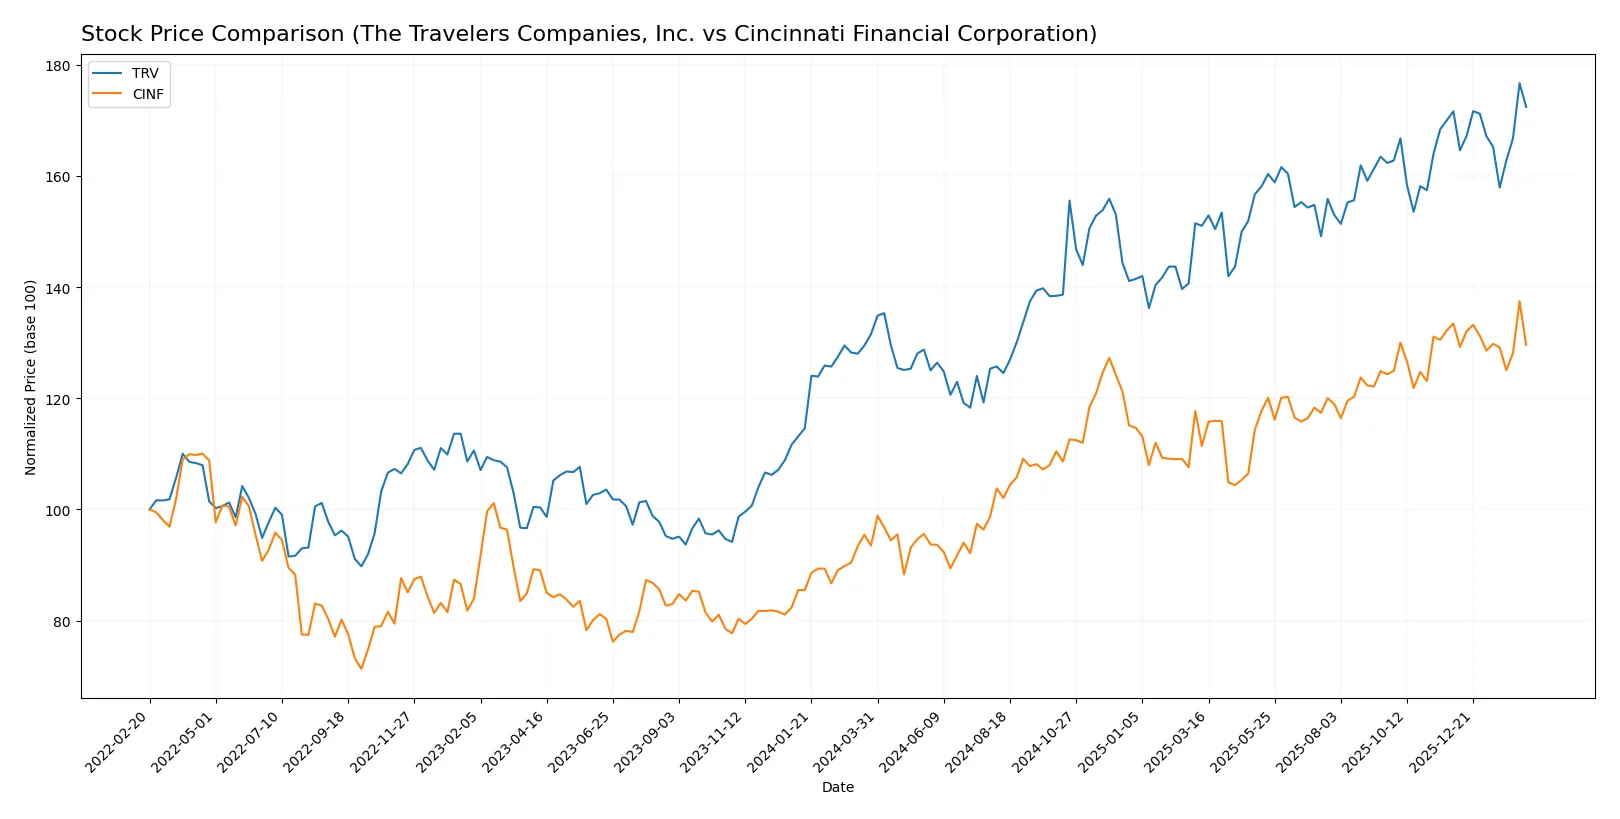
Over the past 12 months, The Travelers Companies, Inc. and Cincinnati Financial Corporation showed strong bullish trends with significant price gains but recent deceleration in momentum.
Trend Comparison
The Travelers Companies, Inc. gained 31.08% over the past year, maintaining a bullish trend with decelerating momentum and a high volatility of 25.57%. Its recent trend is neutral with a minor 0.46% increase.
Cincinnati Financial Corporation rose 38.62% in the same period, also bullish with decelerating momentum and lower volatility at 15.43%. Recently, it experienced a bearish trend with a 2.88% decline.
Cincinnati Financial Corporation delivered stronger market performance overall but has shown recent weakness, while Travelers remains more stable in the short term.
Target Prices
Analysts present a bullish consensus for both Travelers and Cincinnati Financial, indicating upside potential from current prices.
| Company | Target Low | Target High | Consensus |
|---|---|---|---|
| The Travelers Companies, Inc. | 304 | 317 | 312.75 |
| Cincinnati Financial Corporation | 157 | 175 | 166 |
The Travelers consensus target at $313 implies roughly a 6% upside from the $294 current price. Cincinnati Financial shows a 2% upside from $163 to $166 consensus. Analysts expect moderate growth reflecting stable sector fundamentals.

Don’t Let Luck Decide Your Entry Point
Optimize your entry points with our advanced ProRealTime indicators. You’ll get efficient buy signals with precise price targets for maximum performance. Start outperforming now!
How do institutions grade them?
Here are the latest institutional grades for The Travelers Companies, Inc. and Cincinnati Financial Corporation:
The Travelers Companies, Inc. Grades
This table summarizes recent grades assigned to Travelers by recognized financial institutions.
| Grading Company | Action | New Grade | Date |
|---|---|---|---|
| Cantor Fitzgerald | Maintain | Overweight | 2026-02-02 |
| Citigroup | Maintain | Sell | 2026-01-27 |
| Keefe, Bruyette & Woods | Maintain | Outperform | 2026-01-23 |
| Roth Capital | Maintain | Buy | 2026-01-23 |
| Mizuho | Maintain | Neutral | 2026-01-22 |
| Wells Fargo | Maintain | Equal Weight | 2026-01-22 |
| Cantor Fitzgerald | Maintain | Overweight | 2026-01-14 |
| Wells Fargo | Maintain | Equal Weight | 2026-01-13 |
| Barclays | Maintain | Equal Weight | 2026-01-08 |
| JP Morgan | Maintain | Underweight | 2026-01-07 |
Cincinnati Financial Corporation Grades
Below is a summary of recent grades from credible grading firms for Cincinnati Financial.
| Grading Company | Action | New Grade | Date |
|---|---|---|---|
| Keefe, Bruyette & Woods | Maintain | Outperform | 2026-01-06 |
| Piper Sandler | Maintain | Neutral | 2025-12-22 |
| Keefe, Bruyette & Woods | Maintain | Outperform | 2025-11-04 |
| B of A Securities | Maintain | Buy | 2025-10-28 |
| B of A Securities | Maintain | Buy | 2025-10-13 |
| Keefe, Bruyette & Woods | Maintain | Outperform | 2025-10-06 |
| Keefe, Bruyette & Woods | Maintain | Outperform | 2025-08-05 |
| Roth Capital | Maintain | Buy | 2025-07-29 |
| Keefe, Bruyette & Woods | Maintain | Outperform | 2025-07-09 |
| Keefe, Bruyette & Woods | Maintain | Outperform | 2025-04-09 |
Which company has the best grades?
Cincinnati Financial consistently earns “Outperform” and “Buy” ratings from respected firms. Travelers shows more grade variability, including “Sell” and “Underweight” ratings. Investors may view Cincinnati as more favored by analysts, potentially reflecting stronger confidence.
Risks specific to each company
In 2026’s challenging market environment, these categories expose critical pressure points and systemic threats for The Travelers Companies, Inc. and Cincinnati Financial Corporation:
1. Market & Competition
The Travelers Companies, Inc.
- Operates in a competitive P&C insurance space with broad commercial and personal segments; faces pressure from digital disruptors and pricing wars.
Cincinnati Financial Corporation
- Focuses on diverse insurance lines including life and surplus lines; competes with strong regional players, leveraging niche market strength.
2. Capital Structure & Debt
The Travelers Companies, Inc.
- Maintains moderate leverage (D/E 0.28) and low debt-to-assets (6.45%), with strong interest coverage (19.34x), reflecting conservative capital use.
Cincinnati Financial Corporation
- Exhibits very low leverage (D/E 0.05) and minimal debt burden (2.1%), with extremely high interest coverage (559.62x), signaling robust financial stability.
3. Stock Volatility
The Travelers Companies, Inc.
- Beta of 0.52 indicates lower sensitivity to market swings, potentially offering defensive qualities.
Cincinnati Financial Corporation
- Slightly higher beta at 0.65 suggests moderate volatility relative to the market, implying a bit more risk exposure.
4. Regulatory & Legal
The Travelers Companies, Inc.
- Faces complex regulatory scrutiny across multiple insurance lines and jurisdictions, increasing compliance costs and legal risks.
Cincinnati Financial Corporation
- Navigates regulatory landscape with fewer business lines; however, life insurance segment adds complexity and compliance demands.
5. Supply Chain & Operations
The Travelers Companies, Inc.
- Operationally challenged by low asset turnover (0.34) and poor current/quick ratios (0.23), indicating working capital constraints.
Cincinnati Financial Corporation
- Strong liquidity (current and quick ratios at 5.93) and high fixed asset turnover (57.68) suggest efficient operations and capital deployment.
6. ESG & Climate Transition
The Travelers Companies, Inc.
- Exposure to climate risks in property insurance; must manage transition risks amid evolving ESG regulations and stakeholder expectations.
Cincinnati Financial Corporation
- Also faces climate-related underwriting risks; ESG efforts critical to sustain reputation and meet investor demands.
7. Geopolitical Exposure
The Travelers Companies, Inc.
- International presence subjects it to geopolitical volatility, including regulatory changes and trade tensions.
Cincinnati Financial Corporation
- Primarily U.S.-focused, limiting direct geopolitical exposure but vulnerable to domestic political and regulatory shifts.
Which company shows a better risk-adjusted profile?
The Travelers grapples with operational liquidity and international exposure risks, while Cincinnati Financial excels in capital structure and operational efficiency. Cincinnati’s minimal debt and strong liquidity create a superior risk-adjusted profile. Notably, Travelers’ Altman Z-score signals distress risk, underscoring its financial vulnerability.
Final Verdict: Which stock to choose?
The Travelers Companies, Inc. (TRV) stands out as a cash machine with a proven ability to generate value above its cost of capital. Its superpower lies in sustainable profitability and improving returns on invested capital. A point of vigilance is its weak liquidity position, signaling potential short-term stress. TRV suits an Aggressive Growth portfolio seeking strong income with some risk tolerance.
Cincinnati Financial Corporation (CINF) commands a strategic moat through exceptional capital efficiency and a robust balance sheet that outshines TRV’s in safety. Its fortress-like financials and higher margins underpin a durable competitive advantage. CINF fits a GARP portfolio focused on stable growth with lower volatility and solid capital returns.
If you prioritize high-value creation and expanding profitability, TRV is the compelling choice due to its accelerating ROIC and favorable income trends. However, if you seek better stability and superior capital allocation efficiency, CINF offers a safer harbor with a very favorable moat and stronger liquidity. Each stock appeals to distinct investor profiles balancing growth versus safety.
Disclaimer: Investment carries a risk of loss of initial capital. The past performance is not a reliable indicator of future results. Be sure to understand risks before making an investment decision.
Go Further
I encourage you to read the complete analyses of The Travelers Companies, Inc. and Cincinnati Financial Corporation to enhance your investment decisions: