Home > Comparison > Financial Services > ALL vs CINF
The strategic rivalry between The Allstate Corporation and Cincinnati Financial Corporation shapes the landscape of the Property and Casualty insurance sector. Allstate operates as a diversified financial services powerhouse with extensive service lines and broad distribution. Cincinnati Financial focuses on specialized insurance segments with a leaner operational model. This analysis pits their contrasting approaches to risk and growth, aiming to identify which trajectory offers superior risk-adjusted returns for a well-rounded portfolio.

Table of contents
Companies Overview
The Allstate Corporation and Cincinnati Financial Corporation hold key positions in the U.S. property and casualty insurance market.
The Allstate Corporation: Diversified Insurance Leader
The Allstate Corporation dominates as a property and casualty insurer in the U.S. and Canada. It generates revenue through private passenger auto, homeowners, specialty auto, and commercial lines insurance. In 2026, its strategic focus emphasizes expanding protection services, including roadside assistance and identity protection, broadening its footprint beyond traditional insurance products.
Cincinnati Financial Corporation: Specialized Insurer with Investment Edge
Cincinnati Financial Corporation serves the U.S. market with a concentrated portfolio of commercial and personal lines insurance alongside life products. Its core revenue engines span commercial casualty, property, personal auto, and life insurance, supported by fixed-income and equity investments. The company’s 2026 strategy centers on strengthening excess and surplus lines insurance, targeting niche commercial risks and investment income.
Strategic Collision: Similarities & Divergences
Both firms prioritize property and casualty insurance but diverge sharply in scope and scale. Allstate pursues a broad, integrated ecosystem blending traditional insurance with consumer protection services. Cincinnati focuses on specialized commercial coverage and investment returns. Their battleground is commercial lines market share, where Allstate’s scale meets Cincinnati’s niche expertise. This contrast yields distinct risk profiles: Allstate’s diversification versus Cincinnati’s focused underwriting and investment discipline.
Income Statement Comparison
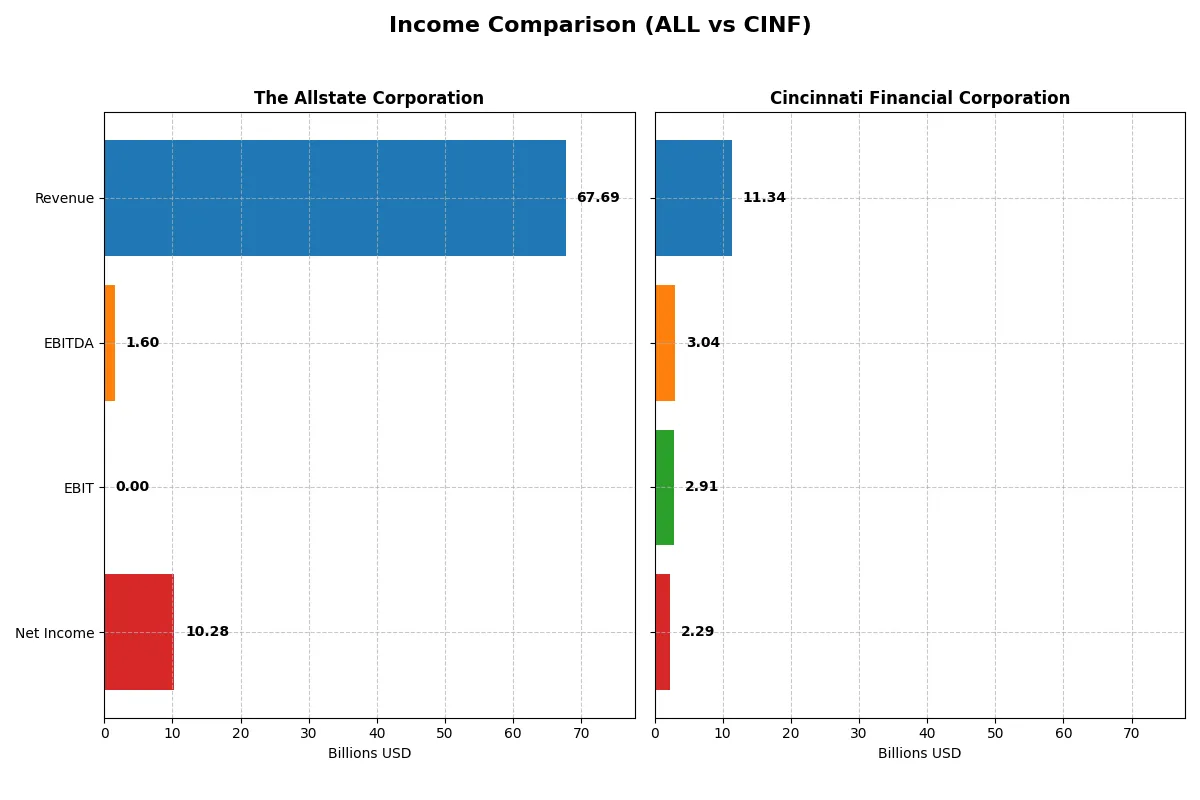
This data dissects the core profitability and scalability of both corporate engines to reveal who dominates the bottom line:
| Metric | The Allstate Corporation (ALL) | Cincinnati Financial Corporation (CINF) |
|---|---|---|
| Revenue | 67.7B | 11.3B |
| Cost of Revenue | 0 | 5.7B |
| Operating Expenses | 0 | 2.7B |
| Gross Profit | 0 | 5.6B |
| EBITDA | 1.6B | 3.0B |
| EBIT | 0 | 2.9B |
| Interest Expense | 399M | 53M |
| Net Income | 10.3B | 2.3B |
| EPS | 38.56 | 14.65 |
| Fiscal Year | 2025 | 2024 |
Income Statement Analysis: The Bottom-Line Duel
This income statement comparison reveals the true efficiency and profitability of two distinct insurance giants over recent years.
The Allstate Corporation Analysis
Allstate’s revenue grew from 48.7B in 2021 to 67.7B in 2025, marking a 39% rise. Its net income rebounded sharply from a -1.3B loss in 2022 to 10.3B in 2025. Despite zero reported gross profit in 2025, Allstate maintains a net margin of 15.2%, reflecting improved cost control and a robust bottom line momentum.
Cincinnati Financial Corporation Analysis
Cincinnati Financial posted steady revenue growth from 7.5B in 2020 to 11.3B in 2024, a 50% increase. Its net income climbed from 1.2B to 2.3B in the same period, with a high net margin of 20.2%. Cincinnati sustains impressive gross (49.4%) and EBIT margins (25.7%), signaling consistent operational efficiency and solid profitability growth.
Margin Power vs. Revenue Scale
Cincinnati leads with superior gross and EBIT margins, showcasing operational efficiency. Allstate, however, outpaces in revenue scale and net income growth, recovering strongly from prior losses. For investors, Cincinnati offers steady profitability, while Allstate presents high-growth potential fueled by scale and margin improvement.
Financial Ratios Comparison
These vital ratios act as a diagnostic tool to expose the underlying fiscal health, valuation premiums, and capital efficiency of each company:
| Ratios | The Allstate Corporation (ALL) | Cincinnati Financial Corporation (CINF) |
|---|---|---|
| ROE | 21.77% | 16.45% |
| ROIC | 4.12% | 91.68% |
| P/E | 10.92 | 9.81 |
| P/B | 2.38 | 1.61 |
| Current Ratio | 0 | 0 |
| Quick Ratio | 0 | 0 |
| D/E | 0.38 | 0.06 |
| Debt-to-Assets | 7.24% | 2.40% |
| Interest Coverage | 14.40 | 53.92 |
| Asset Turnover | 0.57 | 0.31 |
| Fixed Asset Turnover | 94.94 | 52.98 |
| Payout ratio | 23.12% | 21.38% |
| Dividend yield | 2.12% | 2.18% |
| Fiscal Year | 2024 | 2024 |
Efficiency & Valuation Duel: The Vital Signs
Ratios serve as a company’s DNA, uncovering hidden risks and operational strengths that raw numbers alone cannot reveal.
The Allstate Corporation
Allstate shows a strong ROE at 21.77%, signaling solid shareholder profitability, while net margin at 7.35% remains neutral. Its P/E of 10.92 suggests a fair valuation, neither stretched nor cheap. The 2.12% dividend yield rewards shareholders, highlighting a balanced capital allocation between payouts and reinvestment.
Cincinnati Financial Corporation
Cincinnati Financial posts a robust net margin of 20.22% and a respectable ROE of 16.45%, reflecting operational efficiency. Its P/E ratio stands at 9.81, indicating a slightly cheaper valuation than Allstate. A 2.18% dividend yield coupled with a favorable debt profile demonstrates prudent financial management and shareholder returns.
Robust Profitability vs. Balanced Valuation
Cincinnati Financial outperforms Allstate on profitability and capital structure with more favorable ratios overall. Allstate offers higher ROE but at a slightly elevated valuation. Investors prioritizing strong margins and conservative leverage may prefer Cincinnati’s profile, while those focused on return on equity might lean toward Allstate.
Which one offers the Superior Shareholder Reward?
I compare The Allstate Corporation (ALL) and Cincinnati Financial Corporation (CINF) by their 2024 dividend yields, payout ratios, and buyback intensity. ALL yields 2.12% with a 23.1% payout ratio, showing strong free cash flow coverage and moderate buybacks supporting shareholder returns. CINF yields 2.18% with a 21.4% payout ratio, also backed by robust free cash flow and a disciplined buyback program. Historically, CINF’s higher net margin (20.2% vs. ALL’s 7.3%) and lower leverage suggest more sustainable distributions. I see CINF’s balanced approach delivering a more attractive total return profile for 2026 investors.
Comparative Score Analysis: The Strategic Profile
The radar chart below reveals the fundamental DNA and trade-offs of The Allstate Corporation and Cincinnati Financial Corporation:
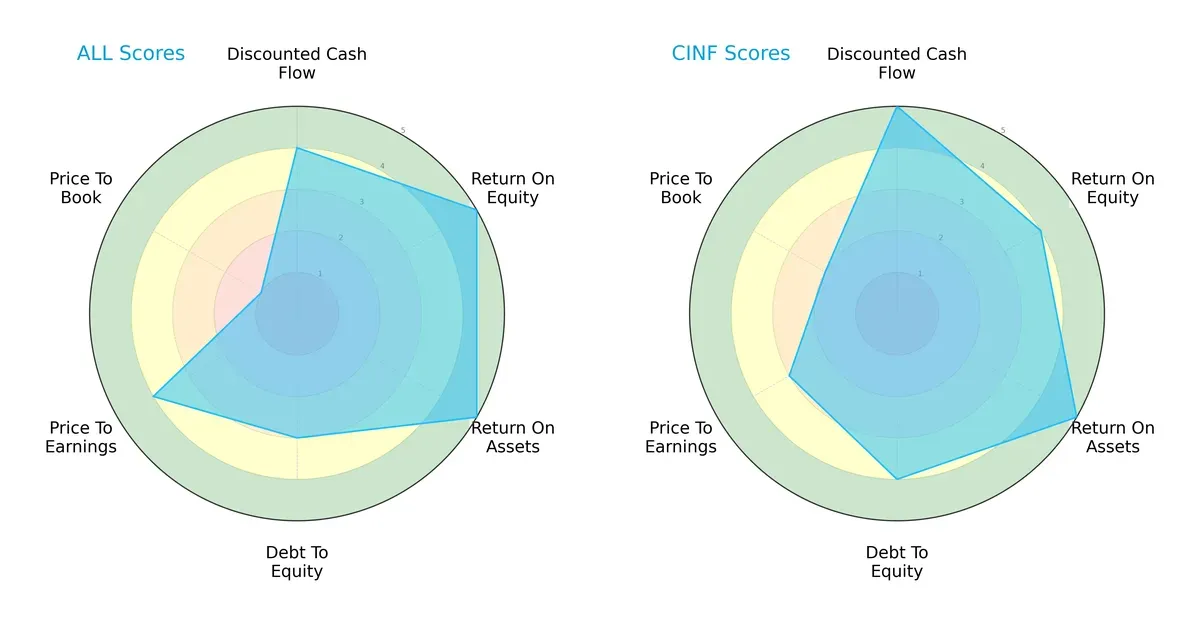
The Allstate Corporation excels in return on equity (5) and return on assets (5), showing operational efficiency. Cincinnati Financial leads in discounted cash flow (5) and maintains a stronger debt-to-equity position (4). Allstate’s very low price-to-book score (1) signals valuation concerns, while Cincinnati’s scores are more balanced, indicating a diversified edge in valuation and leverage management.
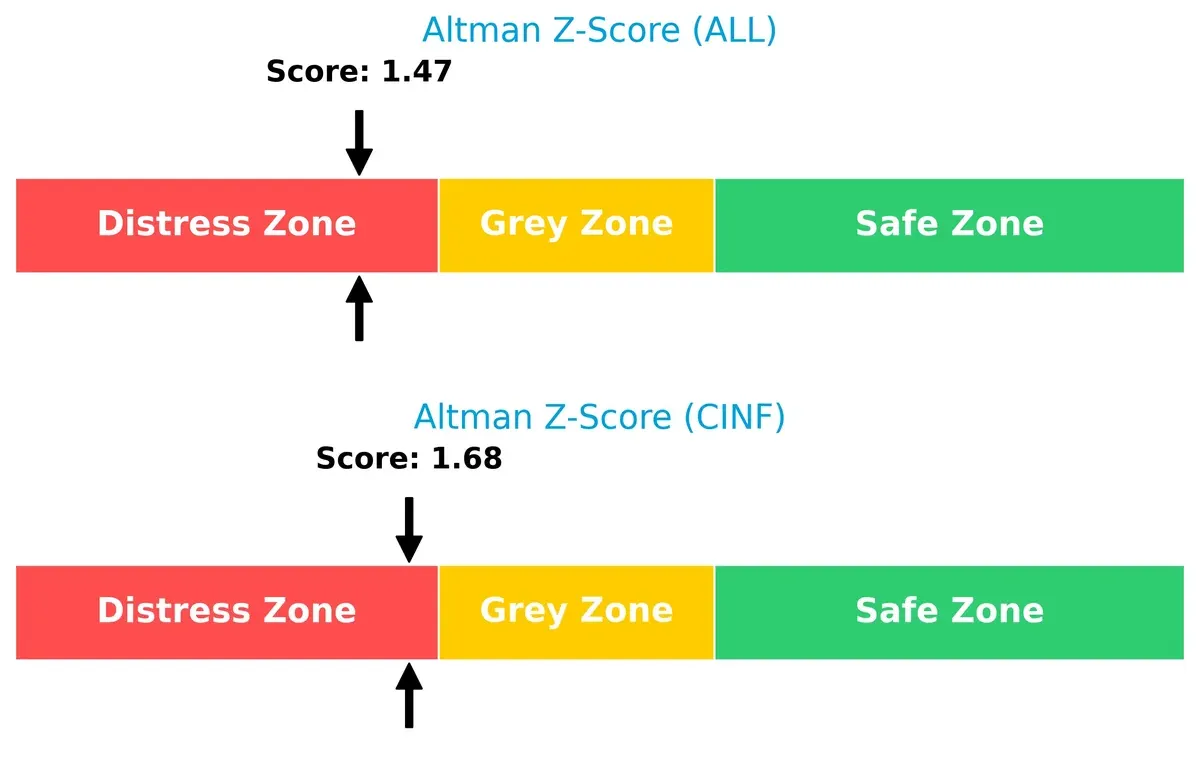
Bankruptcy Risk: Solvency Showdown
Both firms reside in the distress zone, but Cincinnati Financial’s slightly higher Altman Z-Score (1.68 vs. 1.47) suggests marginally better resilience in this cycle:
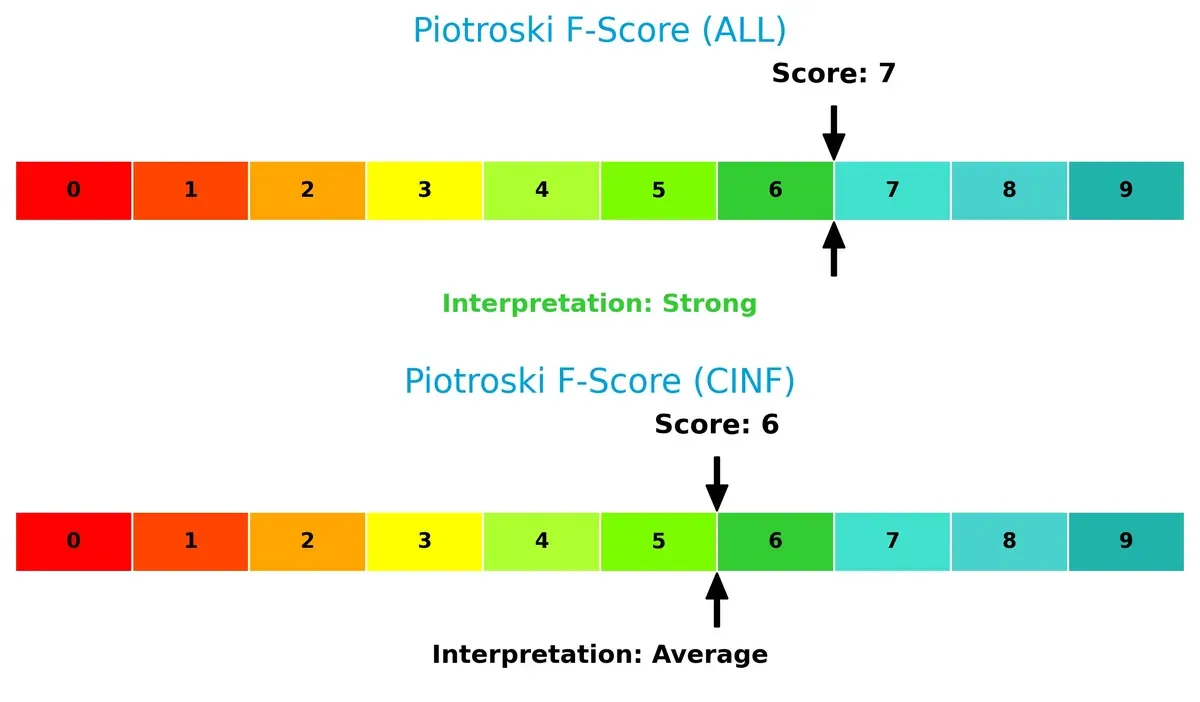
Financial Health: Quality of Operations
The Allstate Corporation’s Piotroski F-Score of 7 indicates strong financial health, outperforming Cincinnati Financial’s average score of 6. This suggests Allstate has fewer internal red flags in profitability and efficiency:
How are the two companies positioned?
This section dissects the operational DNA of Allstate and Cincinnati by comparing their revenue distribution and internal dynamics. The goal is to confront their economic moats to identify which model offers the most resilient, sustainable competitive advantage today.
Revenue Segmentation: The Strategic Mix
This visual comparison dissects how The Allstate Corporation and Cincinnati Financial Corporation diversify their income streams and where their primary sector bets lie:
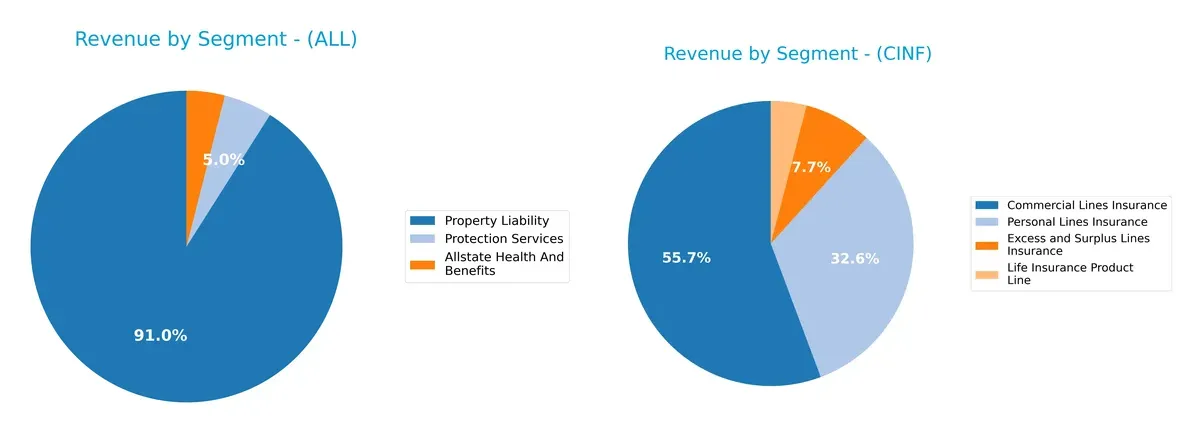
The Allstate Corporation anchors its revenue with a dominant Property Liability segment at $58.3B in 2024, dwarfing its Health and Benefits ($2.5B) and Protection Services ($3.2B). Cincinnati Financial shows a more balanced mix, with $4.5B from Commercial Lines Insurance and $2.6B from Personal Lines Insurance. Allstate’s concentration signals infrastructure dominance but elevates concentration risk. Cincinnati’s diversification reduces risk and supports steady ecosystem lock-in across insurance lines.
Strengths and Weaknesses Comparison
This table compares the strengths and weaknesses of The Allstate Corporation and Cincinnati Financial Corporation:
ALL Strengths
- Diversified insurance segments including Property Liability and Health Benefits
- Favorable ROE at 21.77%
- Low debt-to-assets at 7.24%
- Strong fixed asset turnover at 94.94
- Dividend yield of 2.12%
CINF Strengths
- High net margin at 20.22%
- Excellent ROIC at 9168% exceeding WACC
- Favorable interest coverage at 54.92
- Low debt-to-assets at 2.4%
- Dividend yield of 2.18%
ALL Weaknesses
- Unfavorable current and quick ratios at 0
- Unfavorable interest coverage at 0
- Neutral net margin at 7.35%
- Unavailable WACC data limits cost of capital assessment
- Moderate asset turnover at 0.57
CINF Weaknesses
- Unfavorable current and quick ratios at 0
- Lower asset turnover at 0.31
- Neutral PB ratio at 1.61
The Allstate Corporation demonstrates solid profitability and asset efficiency but faces liquidity and capital structure concerns. Cincinnati Financial boasts superior profitability and capital efficiency but shows weaker asset utilization and liquidity metrics. These factors will influence both firms’ strategic focuses in risk management and growth initiatives.
The Moat Duel: Analyzing Competitive Defensibility
A structural moat is the only true defense against competitors eroding long-term profits. Here’s the moat face-off between two insurers:
The Allstate Corporation: Brand and Distribution Network Moat
Allstate leverages a vast agency and call center network creating significant switching costs. Its stable net margin of 15% reflects this advantage, yet declining ROIC signals emerging pressure. New product lines in protection services could deepen its moat if managed well in 2026.
Cincinnati Financial Corporation: Capital Efficiency and Underwriting Excellence
Cincinnati’s moat centers on superior capital allocation and underwriting discipline, demonstrated by a robust ROIC well above WACC and a strong 20% net margin. Its growing ROIC trend confirms sustained value creation, with opportunities to expand commercial lines and life insurance further.
Distribution Footprint vs. Capital Mastery
Cincinnati’s growing ROIC and efficient capital use establish a deeper moat compared to Allstate’s weakening profitability signals. I see Cincinnati better equipped to defend its market share amid evolving insurance dynamics.
Which stock offers better returns?
The past year shows notable bullish trends for both stocks, with The Allstate Corporation and Cincinnati Financial Corporation posting strong gains amid slowing momentum.
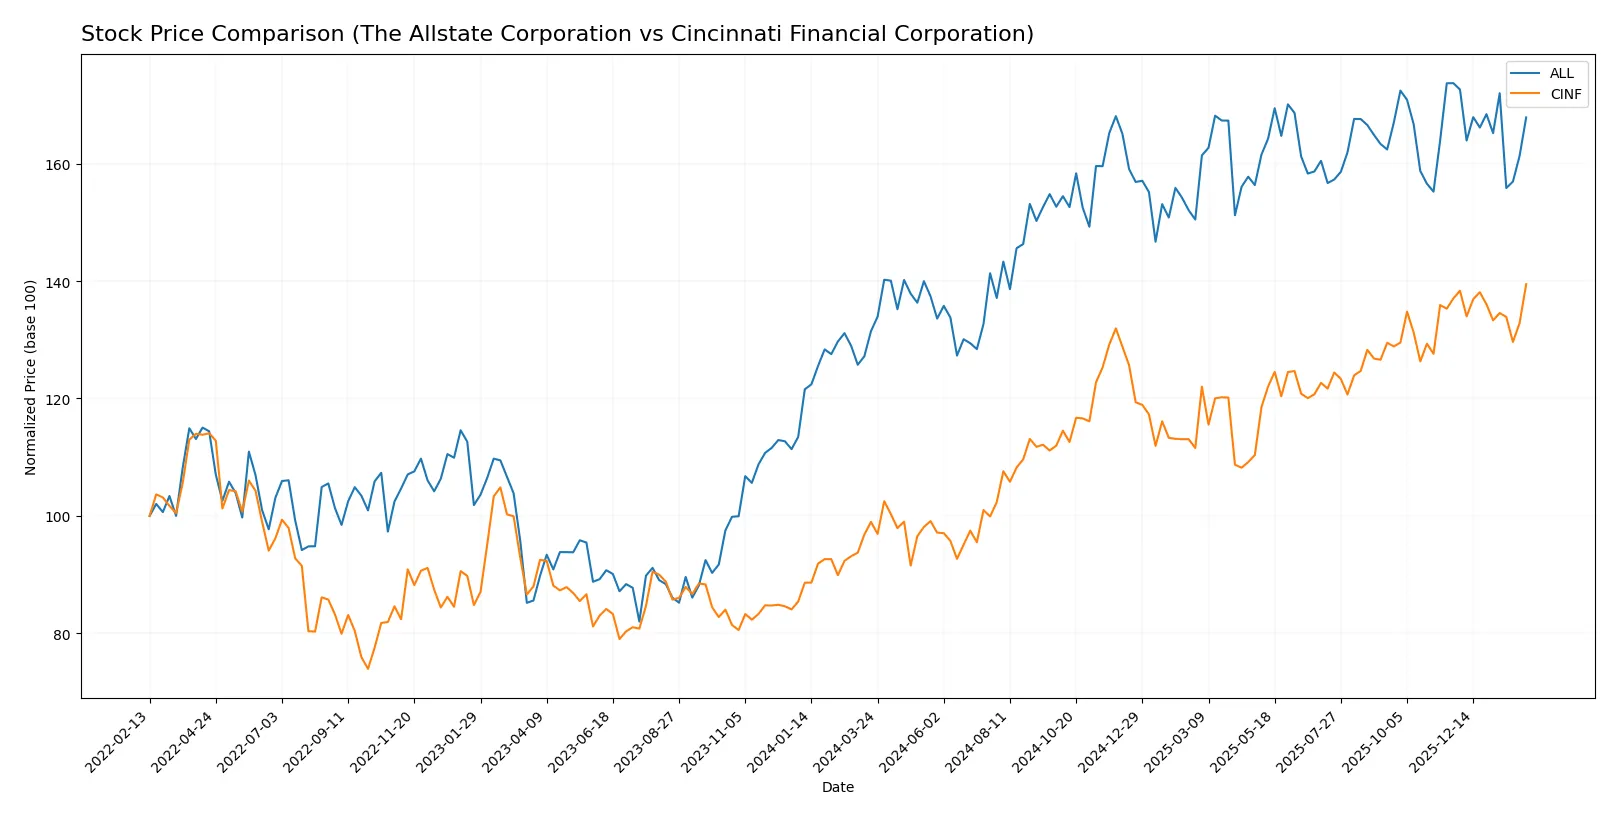
Trend Comparison
The Allstate Corporation’s stock rose 27.7% over the past 12 months, showing a bullish trend with decelerating momentum and a high volatility of 15.05%. Recent months reveal a mild bearish pullback of -3.36%.
Cincinnati Financial Corporation’s stock gained 40.9% in the same period, also bullish but decelerating. It exhibits slightly higher volatility at 15.39%. Recent price action remains neutral with a modest 1.76% increase.
Cincinnati Financial outperformed The Allstate Corporation with a stronger overall gain and steadier recent trend, delivering the highest market performance over the last year.
Target Prices
Analysts present a positive outlook with clear target price ranges for both companies.
| Company | Target Low | Target High | Consensus |
|---|---|---|---|
| The Allstate Corporation | 215 | 255 | 234 |
| Cincinnati Financial Corporation | 157 | 175 | 166 |
The consensus targets for The Allstate Corporation and Cincinnati Financial Corporation exceed their current prices, implying expected appreciation. This suggests analysts generally anticipate further upside in these insurance stocks.

Don’t Let Luck Decide Your Entry Point
Optimize your entry points with our advanced ProRealTime indicators. You’ll get efficient buy signals with precise price targets for maximum performance. Start outperforming now!
How do institutions grade them?
The Allstate Corporation Grades
Here are the latest official grades from recognized financial institutions for Allstate:
| Grading Company | Action | New Grade | Date |
|---|---|---|---|
| Wells Fargo | Maintain | Equal Weight | 2026-01-13 |
| TD Cowen | Downgrade | Hold | 2026-01-12 |
| Keefe, Bruyette & Woods | Maintain | Outperform | 2026-01-06 |
| William Blair | Downgrade | Market Perform | 2025-12-18 |
| Morgan Stanley | Downgrade | Equal Weight | 2025-12-16 |
| Roth Capital | Maintain | Buy | 2025-11-26 |
| Keefe, Bruyette & Woods | Maintain | Outperform | 2025-11-11 |
| UBS | Maintain | Buy | 2025-11-10 |
| Wells Fargo | Maintain | Equal Weight | 2025-11-07 |
| BMO Capital | Maintain | Outperform | 2025-11-07 |
Cincinnati Financial Corporation Grades
Below are the current grades from reputable graders for Cincinnati Financial:
| Grading Company | Action | New Grade | Date |
|---|---|---|---|
| Keefe, Bruyette & Woods | Maintain | Outperform | 2026-01-06 |
| Piper Sandler | Maintain | Neutral | 2025-12-22 |
| Keefe, Bruyette & Woods | Maintain | Outperform | 2025-11-04 |
| B of A Securities | Maintain | Buy | 2025-10-28 |
| B of A Securities | Maintain | Buy | 2025-10-13 |
| Keefe, Bruyette & Woods | Maintain | Outperform | 2025-10-06 |
| Keefe, Bruyette & Woods | Maintain | Outperform | 2025-08-05 |
| Roth Capital | Maintain | Buy | 2025-07-29 |
| Keefe, Bruyette & Woods | Maintain | Outperform | 2025-07-09 |
| Keefe, Bruyette & Woods | Maintain | Outperform | 2025-04-09 |
Which company has the best grades?
Cincinnati Financial consistently holds “Outperform” and “Buy” ratings, indicating stronger institutional confidence than Allstate. Investors may view Cincinnati’s steadier upgrades as a sign of greater growth potential and stability.
Risks specific to each company
The following categories identify the critical pressure points and systemic threats facing both firms in the 2026 market environment:
1. Market & Competition
The Allstate Corporation
- Faces intense competition in auto and homeowners insurance markets, pressuring margins.
Cincinnati Financial Corporation
- Competes in niche commercial and personal lines with a focus on specialty products.
2. Capital Structure & Debt
The Allstate Corporation
- Moderate leverage with debt-to-equity at 0.38; interest coverage is a red flag at 0.0.
Cincinnati Financial Corporation
- Very low leverage at 0.06; strong interest coverage of 54.92 indicates robust debt management.
3. Stock Volatility
The Allstate Corporation
- Extremely low beta of 0.235 suggests defensive stock behavior with limited price swings.
Cincinnati Financial Corporation
- Beta of 0.646 indicates moderate volatility, typical for insurance but higher risk than ALL.
4. Regulatory & Legal
The Allstate Corporation
- Subject to stringent US and Canadian insurance regulations with potential compliance costs.
Cincinnati Financial Corporation
- Operates primarily in the US with exposure to evolving insurance regulatory frameworks.
5. Supply Chain & Operations
The Allstate Corporation
- Complex operations across multiple insurance lines and protection services increase operational risk.
Cincinnati Financial Corporation
- More focused insurance segments reduce operational complexity but limit diversification.
6. ESG & Climate Transition
The Allstate Corporation
- Increasing climate risks affect property casualty claims; ESG initiatives critical to reputation.
Cincinnati Financial Corporation
- Faces similar climate exposures; smaller scale may limit ESG program scope and impact.
7. Geopolitical Exposure
The Allstate Corporation
- Exposure to US and Canadian markets; geopolitical stability generally favorable.
Cincinnati Financial Corporation
- Concentrated US exposure reduces geopolitical risk but limits international growth opportunities.
Which company shows a better risk-adjusted profile?
Cincinnati Financial’s strongest risk lies in moderate market volatility and operational concentration. Allstate struggles most with capital structure, especially its zero interest coverage, threatening financial flexibility. Overall, Cincinnati offers a better risk-adjusted profile due to superior debt management and stronger profitability metrics. Recent data shows Allstate’s interest coverage at zero, a glaring red flag that heightens default risk despite its market presence.
Final Verdict: Which stock to choose?
The Allstate Corporation’s superpower lies in its strong return on equity and consistent dividend yield, marking it as a cash generator in a competitive industry. However, its declining ROIC trend and liquidity ratios call for vigilance. It suits portfolios aiming for aggressive growth with a tolerance for operational risks.
Cincinnati Financial Corporation benefits from a robust economic moat demonstrated by an exceptionally high and growing ROIC relative to WACC. Its superior margin profile and safer balance sheet offer better stability than Allstate. This company aligns well with GARP investors seeking solid growth at a reasonable price.
If you prioritize value creation backed by a sustainable competitive advantage, Cincinnati Financial outshines due to its efficient capital allocation and growing profitability. However, if you seek higher immediate returns with a willingness to accept some operational headwinds, The Allstate Corporation might fit better. Both present distinct analytical scenarios depending on your risk appetite and growth expectations.
Disclaimer: Investment carries a risk of loss of initial capital. The past performance is not a reliable indicator of future results. Be sure to understand risks before making an investment decision.
Go Further
I encourage you to read the complete analyses of The Allstate Corporation and Cincinnati Financial Corporation to enhance your investment decisions: