Home > Comparison > Healthcare > UNH vs CI
The strategic rivalry between UnitedHealth Group Incorporated and Cigna Corporation shapes the healthcare plans industry’s competitive landscape. UnitedHealth operates as a diversified healthcare giant with extensive service segments, while Cigna focuses on integrated insurance and health services with a leaner structure. This head-to-head pits scale and diversification against targeted innovation. This analysis will reveal which company presents a superior risk-adjusted outlook for a diversified portfolio amid evolving healthcare demands.
Table of contents
Companies Overview
UnitedHealth Group and Cigna Corporation both shape the competitive landscape of the US healthcare plan sector.
UnitedHealth Group Incorporated: Diversified Healthcare Giant
UnitedHealth Group dominates as a diversified healthcare company with four major segments: UnitedHealthcare, Optum Health, Optum Insight, and Optum Rx. Its core revenue stems from consumer health benefit plans and comprehensive services spanning pharmacy care, data analytics, and care delivery. In 2026, it strategically focuses on leveraging integrated care networks and advanced data solutions to enhance patient outcomes and cost efficiency.
Cigna Corporation: Coordinated Health Services Provider
Cigna operates primarily as a health insurance and services provider with a strong emphasis on coordinated care through its Evernorth and Cigna Healthcare segments. It generates revenue by offering medical, pharmacy, behavioral health, and Medicare-related plans to a diverse customer base including individuals, employers, and government programs. Its 2026 strategy centers on expanding point solution health services and strengthening its international footprint.
Strategic Collision: Similarities & Divergences
Both companies prioritize integrated healthcare solutions but diverge in scale and scope. UnitedHealth Group pursues a broad ecosystem integrating care delivery and data analytics, while Cigna leans on targeted health service coordination and insurance products. Their primary battleground lies in Medicare and employer-sponsored plans. UnitedHealth’s vast infrastructure contrasts with Cigna’s focused service model, shaping distinct investment profiles defined by scale versus specialized growth.
Income Statement Comparison
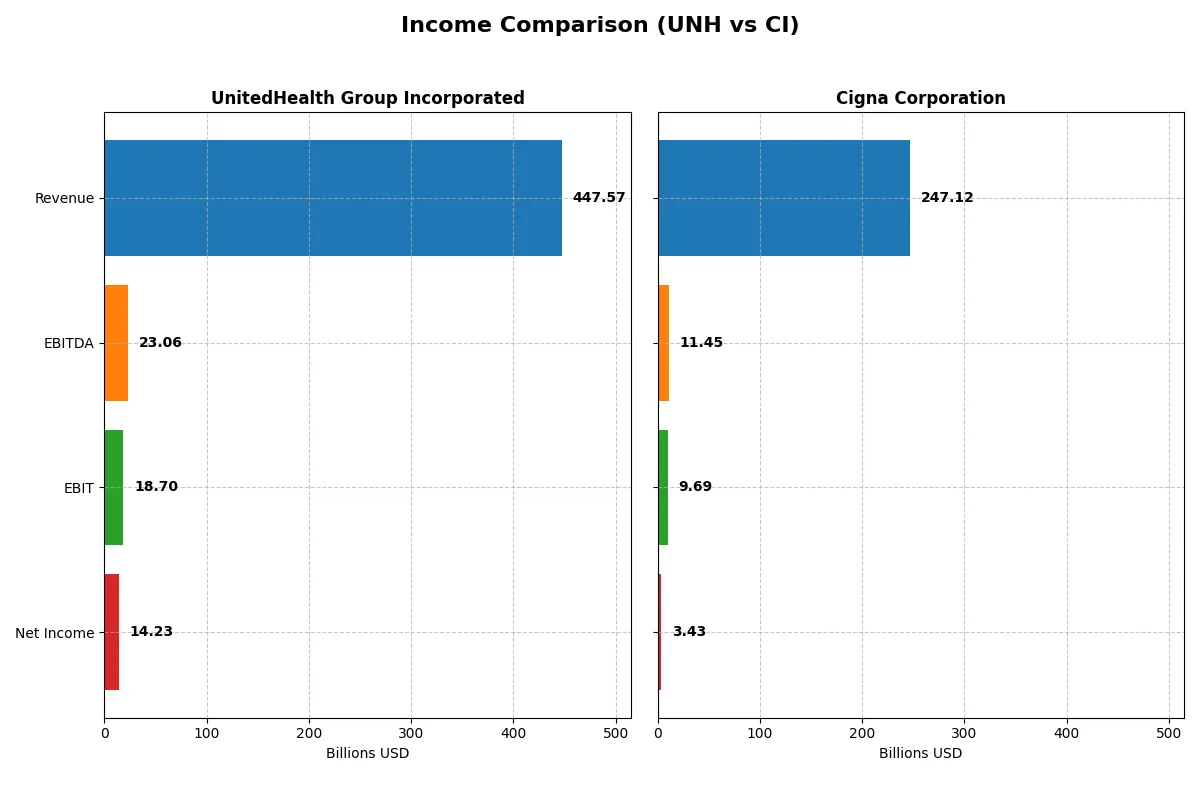
This data dissects the core profitability and scalability of both corporate engines to reveal who dominates the bottom line:
| Metric | UnitedHealth Group Incorporated (UNH) | Cigna Corporation (CI) |
|---|---|---|
| Revenue | 448B | 247B |
| Cost of Revenue | 365B | 221B |
| Operating Expenses | 64B | 16.5B |
| Gross Profit | 83B | 26B |
| EBITDA | 23B | 11.4B |
| EBIT | 18.7B | 9.7B |
| Interest Expense | 4B | 1.4B |
| Net Income | 14.2B | 3.4B |
| EPS | 15.66 | 12.25 |
| Fiscal Year | 2025 | 2024 |
Income Statement Analysis: The Bottom-Line Duel
This income statement comparison reveals which company operates with more efficiency and sustainable profit generation in a competitive healthcare landscape.
UnitedHealth Group Incorporated Analysis
UnitedHealth’s revenue rose robustly by 11.8% in 2025 to $448B, but net income slipped 1.2% to $14.2B, signaling margin pressure. Its gross margin contracted to 18.5%, and net margin fell to 3.18%, reflecting rising operating expenses. Despite revenue momentum, earnings and margins show weakening efficiency in the latest year.
Cigna Corporation Analysis
Cigna delivered a 26.6% revenue jump to $247B in 2024, with net income dropping sharply by 33.5% to $3.4B. Gross margin held steady near 10.5%, while net margin remained thin at 1.39%. The firm showed top-line acceleration but struggled to convert sales growth into profit, highlighting cost challenges and margin compression.
Margin Power vs. Revenue Scale
UnitedHealth commands a much larger revenue base and higher net income but faces declining profitability margins. Cigna’s faster revenue growth contrasts with its weaker profitability profile. Fundamentally, UnitedHealth remains the income leader with stronger absolute earnings and scale, appealing more to investors focused on stable profit generation.
Financial Ratios Comparison
These vital ratios act as a diagnostic tool to expose underlying fiscal health, valuation premiums, and capital efficiency for the companies compared below:
| Ratios | UnitedHealth Group (UNH) | Cigna Corporation (CI) |
|---|---|---|
| ROE | 14.2% | 8.4% |
| ROIC | 9.4% | 6.7% |
| P/E | 21.1 | 22.5 |
| P/B | 3.0 | 1.9 |
| Current Ratio | 0.79 | 0.84 |
| Quick Ratio | 0.79 | 0.73 |
| D/E | 0.78 | 0.78 |
| Debt-to-Assets | 25.3% | 20.5% |
| Interest Coverage | 4.7 | 6.6 |
| Asset Turnover | 1.45 | 1.59 |
| Fixed Asset Turnover | 0 | 298.5 |
| Payout ratio | 97.2% | 45.6% |
| Dividend yield | 4.6% | 2.0% |
| Fiscal Year | 2025 | 2024 |
Efficiency & Valuation Duel: The Vital Signs
Ratios act as a company’s DNA, revealing hidden risks and operational excellence that shape investor decisions and long-term value creation.
UnitedHealth Group Incorporated
UnitedHealth delivers a solid 14.2% ROE and a 9.5% ROIC, reflecting operational competence. Its P/E ratio at 21.1 is fairly valued, though a 3.0 PB ratio flags some overvaluation risk. The 4.6% dividend yield rewards shareholders, balancing reinvestment with steady income.
Cigna Corporation
Cigna’s 8.4% ROE signals weaker profitability, though its 6.7% ROIC remains neutral. The P/E of 22.5 marks the stock as fairly priced, supported by a 2.0% dividend yield. Its stronger interest coverage and asset turnover hint at operational efficiency despite lower returns.
Operational Strength vs. Valuation Discipline
UnitedHealth offers higher profitability and a stronger dividend, tempered by some valuation concerns. Cigna shows more favorable leverage and operational metrics but lower returns. Investors seeking yield and operational strength may prefer UnitedHealth; those valuing balance and efficiency might lean toward Cigna.
Which one offers the Superior Shareholder Reward?
I find UnitedHealth Group (UNH) and Cigna Corporation (CI) pursue distinct shareholder reward strategies. UNH offers a 4.6% dividend yield with a high payout ratio near 97%, signaling a mature, income-focused model. Its buybacks are robust but less highlighted here. CI yields 2.0%, with a moderate 46% payout ratio, conserving cash for growth and steady buybacks. UNH’s payout ratio strains free cash flow coverage, risking sustainability. CI balances dividends and buybacks with healthier free cash flow coverage, supporting long-term value. I conclude CI offers a superior total return profile in 2026 due to its sustainable, growth-oriented distribution mix.
Comparative Score Analysis: The Strategic Profile
The radar chart reveals the fundamental DNA and trade-offs of UnitedHealth Group and Cigna Corporation, highlighting their strategic strengths and vulnerabilities:
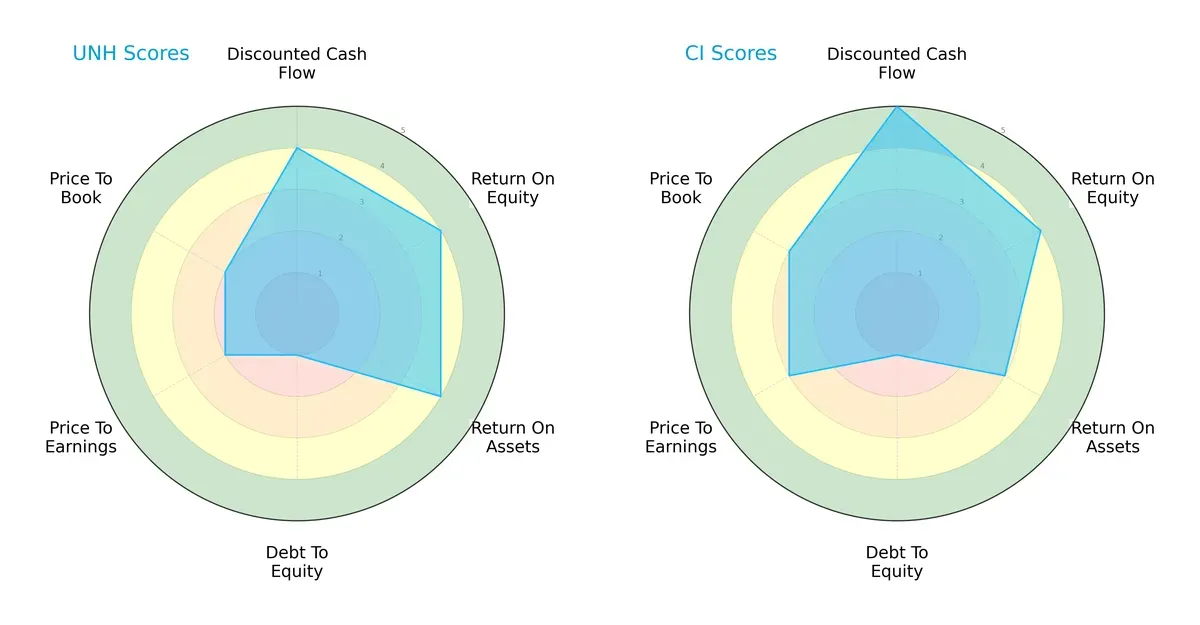
UnitedHealth and Cigna both score a moderate overall rating of 3. Cigna leads with a superior DCF score of 5 versus UnitedHealth’s 4, indicating stronger cash flow projections. Both share strong ROE scores of 4, but UnitedHealth outperforms slightly in ROA with 4 against Cigna’s 3, signaling more efficient asset use. Both grapple with a very unfavorable debt-to-equity score of 1, raising balance sheet concerns. Valuation metrics tilt in Cigna’s favor with P/E and P/B scores at 3 compared to UnitedHealth’s 2, suggesting Cigna may offer better value. Overall, Cigna presents a more balanced financial profile, while UnitedHealth leans on operational efficiency as its edge.
Bankruptcy Risk: Solvency Showdown
UnitedHealth’s Altman Z-Score of 2.29 versus Cigna’s 2.62 places both firms in the grey zone, indicating moderate bankruptcy risk amid current market pressures:
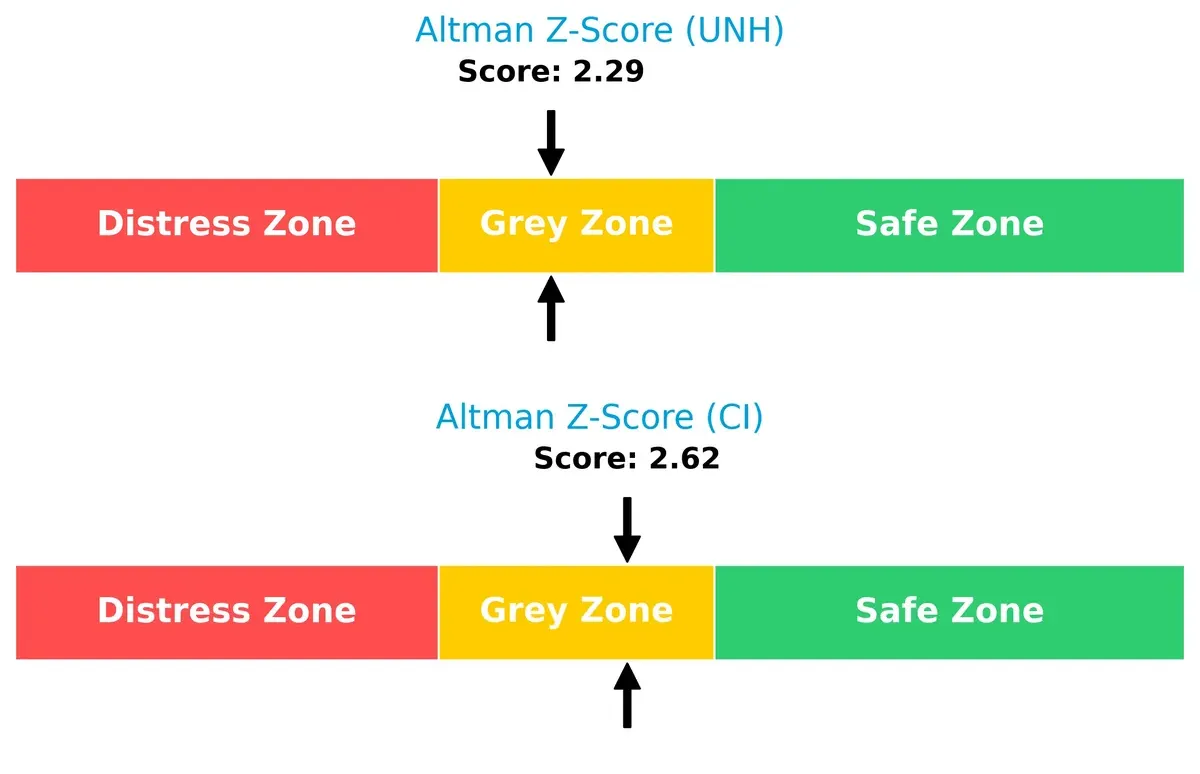
This delta suggests Cigna holds a marginally stronger solvency position, but neither company is fully insulated from financial distress in volatile cycles. Investors should monitor leverage and liquidity trends closely.
Financial Health: Quality of Operations
UnitedHealth’s Piotroski F-Score of 7 versus Cigna’s 6 signals superior financial health, with UnitedHealth demonstrating stronger internal profitability and operational metrics:
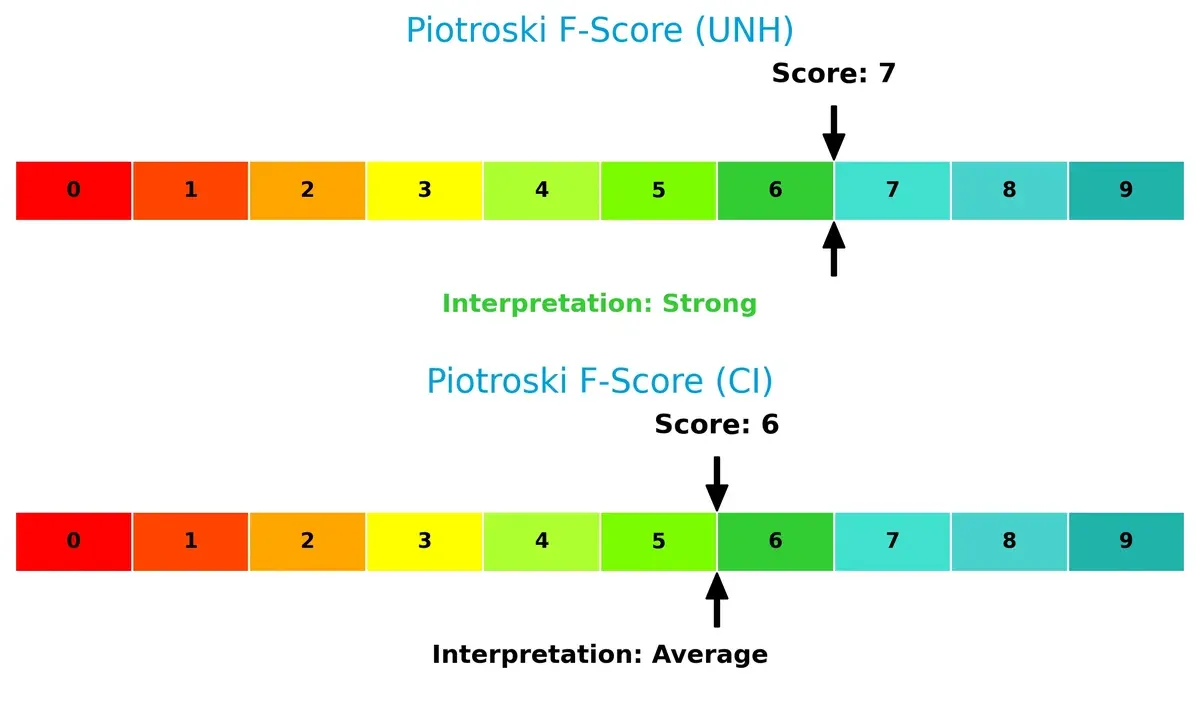
While both companies show solid fundamentals, UnitedHealth’s higher score reflects fewer red flags and more robust financial quality, enhancing its appeal in a risk-conscious portfolio.
How are the two companies positioned?
This section dissects UNH and CI’s operational DNA by comparing revenue distribution and internal dynamics. The goal is to confront their economic moats to identify the more resilient, sustainable competitive advantage today.
Revenue Segmentation: The Strategic Mix
This visual comparison dissects how UnitedHealth Group and Cigna diversify their income streams and where their primary sector bets lie:
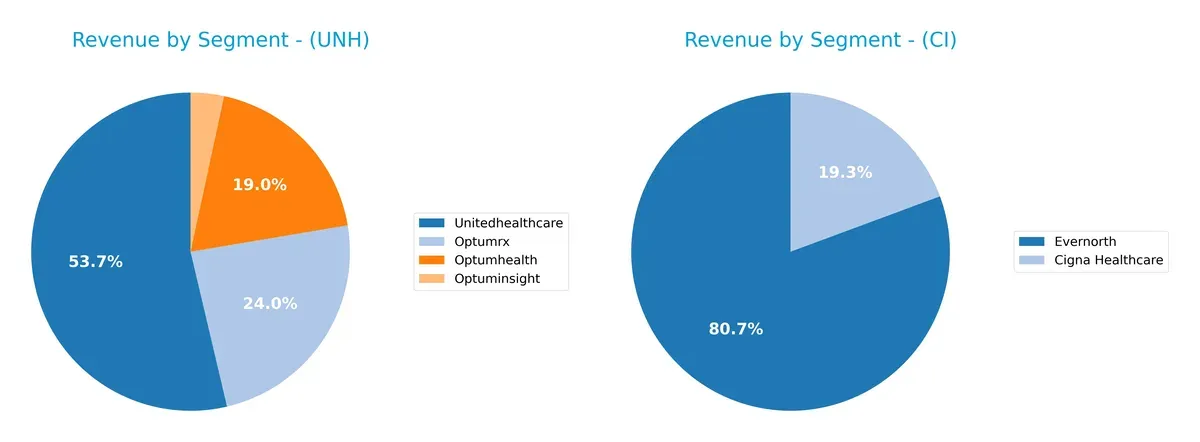
UnitedHealth Group anchors its revenue in UnitedHealthcare at $298B, with significant contributions from OptumRx ($133B) and OptumHealth ($105B), showing a broad health services ecosystem. Cigna leans heavily on Evernorth at $198B and Cigna Healthcare at $47B, indicating a more concentrated model. UnitedHealth’s diversification reduces risk and strengthens ecosystem lock-in. Cigna’s reliance on two segments poses concentration risk but focuses on core health services dominance.
Strengths and Weaknesses Comparison
This table compares the strengths and weaknesses of UnitedHealth Group Incorporated (UNH) and Cigna Corporation (CI):
UNH Strengths
- Diverse revenue streams across Optumhealth, Optuminsight, Optumrx, and UnitedHealthcare segments
- Favorable WACC at 5.4% supports efficient capital allocation
- Strong dividend yield of 4.6% attracts income investors
- Favorable debt-to-assets ratio at 25.32%
- Asset turnover of 1.45 indicates efficient asset use
CI Strengths
- Favorable WACC at 4.62% signals low capital costs
- High fixed asset turnover of 298.46 shows excellent fixed asset utilization
- Interest coverage ratio of 6.75 indicates solid debt servicing ability
- Favorable dividend yield of 2.02%
- Favorable debt-to-assets ratio at 20.51%
- Asset turnover of 1.59 reflects operational efficiency
UNH Weaknesses
- Net margin of 3.18% marked unfavorable, indicating pressure on profitability
- Low current and quick ratios at 0.79 reveal liquidity constraints
- PB ratio at 3.0 is unfavorable, suggesting high valuation relative to book
- Fixed asset turnover of 0 flags underutilized fixed assets
- Global ratios opinion slightly unfavorable due to 35.71% unfavorable ratios
CI Weaknesses
- Unfavorable net margin at 1.39% limits earnings strength
- ROE at 8.37% is below industry expectations, reflecting weaker profitability
- Low current and quick ratios at 0.84 and 0.73 pose liquidity risks
- PB ratio neutral at 1.89, less attractive valuation
- Global ratios opinion slightly favorable but with 28.57% unfavorable ratios
UNH shows strong diversification and capital efficiency but faces profitability and liquidity challenges. CI demonstrates operational efficiency and stronger debt coverage but struggles with profitability and returns. Both companies must balance these factors in their strategic planning.
The Moat Duel: Analyzing Competitive Defensibility
A structural moat is the only true shield protecting long-term profits from relentless competitive erosion. Let’s dissect the moats of two healthcare giants:
UnitedHealth Group Incorporated: Scale-Driven Diversification
UnitedHealth’s moat stems from its diversified healthcare ecosystem combining insurance and care delivery. This integration yields a slightly favorable 4% ROIC premium over WACC, despite a declining trend. Expansion into specialized care and data analytics in 2026 may deepen this advantage but requires prudent cost control.
Cigna Corporation: Focused Operational Efficiency
Cigna’s competitive edge lies in its operational efficiency and focused health services network. It boasts a very favorable 2% ROIC premium over WACC with a rising trend, signaling growing profitability. Its targeted growth in pharmacy and behavioral health services positions it for durable moat expansion versus UnitedHealth’s broader scope.
Integrated Ecosystem vs. Operational Precision
UnitedHealth’s broader ecosystem offers scale but faces pressure from declining ROIC, while Cigna’s leaner model delivers improving returns and sharper profitability gains. I see Cigna’s moat as deeper and more durable, better equipped to defend and grow market share in 2026.
Which stock offers better returns?
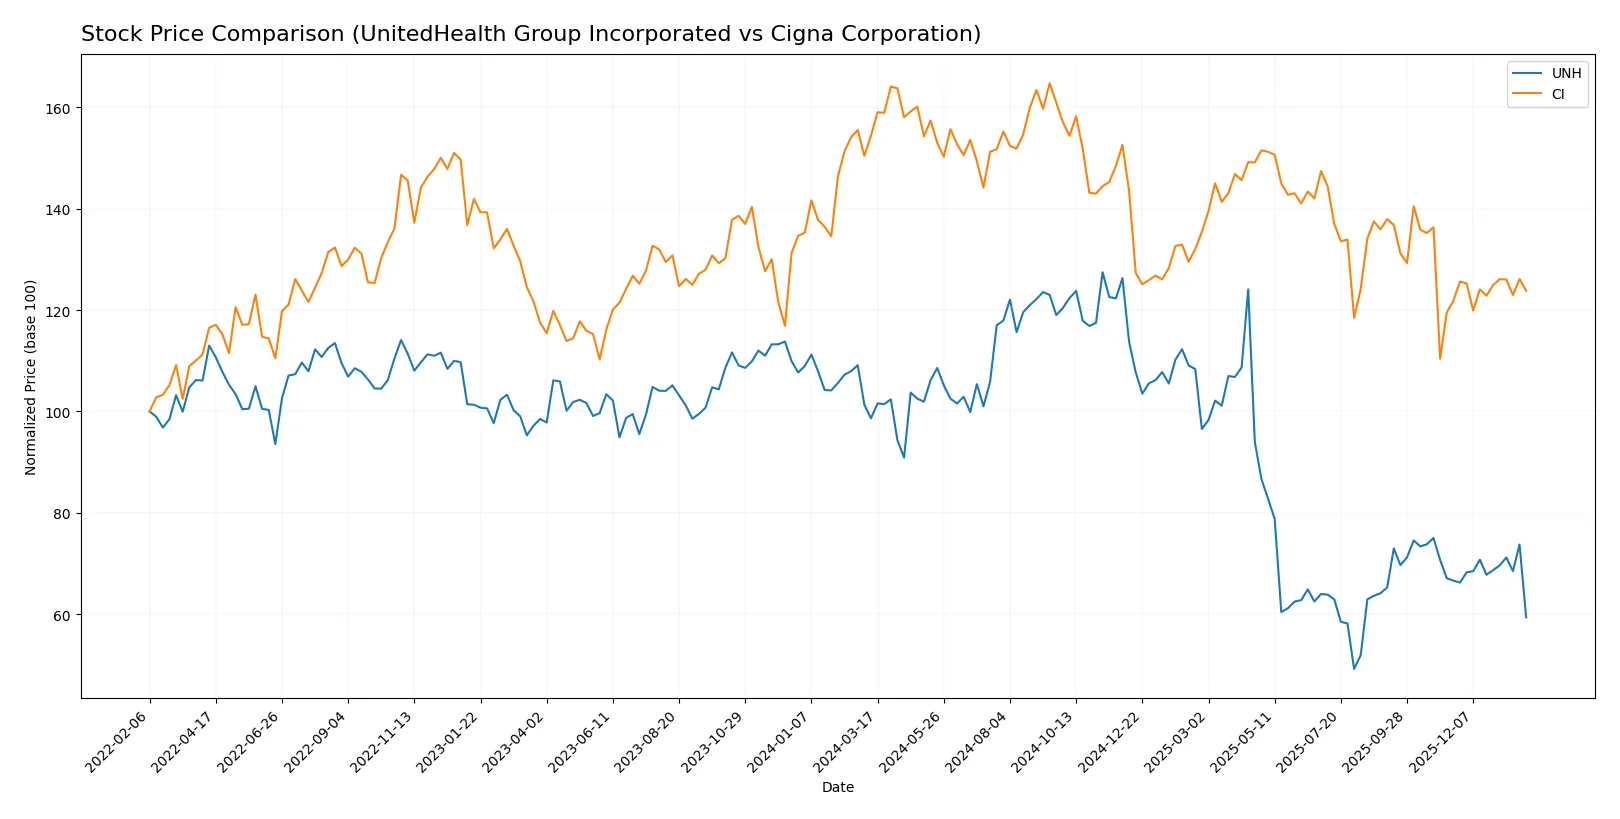
The following chart shows UnitedHealth Group and Cigna Corporation price movements over the past year, highlighting significant declines and recent trading dynamics.
Trend Comparison
UnitedHealth Group’s stock fell 39.79% over the past 12 months, marking a bearish trend with accelerating decline and high volatility. The price ranged between 615.81 and 237.77.
Cigna Corporation’s stock dropped 19.8% over the same period, also bearish with acceleration. Recent weeks show a slight 1.65% gain and reduced volatility, indicating potential stabilization.
UnitedHealth’s decline exceeds Cigna’s, delivering weaker market performance despite higher trading volumes and accelerating losses. Cigna’s recent modest recovery contrasts with UnitedHealth’s persistent downtrend.
Target Prices
Analyst consensus shows a bullish outlook for both UnitedHealth Group and Cigna Corporation.
| Company | Target Low | Target High | Consensus |
|---|---|---|---|
| UnitedHealth Group Incorporated | 327 | 444 | 388 |
| Cigna Corporation | 294 | 415 | 330 |
UnitedHealth’s consensus target of 388 exceeds its current 287 price by 35%, signaling strong upside potential. Cigna’s 330 target also suggests a 20% gain from the current 274 price.

Don’t Let Luck Decide Your Entry Point
Optimize your entry points with our advanced ProRealTime indicators. You’ll get efficient buy signals with precise price targets for maximum performance. Start outperforming now!
How do institutions grade them?
The following tables detail recent institutional grades for UnitedHealth Group Incorporated and Cigna Corporation:
UnitedHealth Group Incorporated Grades
This table summarizes recent grades and actions by key financial institutions for UNH.
| Grading Company | Action | New Grade | Date |
|---|---|---|---|
| Wells Fargo | Maintain | Overweight | 2026-01-30 |
| Barclays | Maintain | Overweight | 2026-01-30 |
| Leerink Partners | Maintain | Outperform | 2026-01-28 |
| RBC Capital | Maintain | Outperform | 2026-01-28 |
| UBS | Maintain | Buy | 2026-01-28 |
| Oppenheimer | Maintain | Outperform | 2026-01-28 |
| Jefferies | Maintain | Buy | 2026-01-28 |
| Morgan Stanley | Maintain | Overweight | 2026-01-23 |
| Barclays | Maintain | Overweight | 2026-01-05 |
| TD Cowen | Maintain | Hold | 2025-10-30 |
Cigna Corporation Grades
This table summarizes recent grades and actions by key financial institutions for CI.
| Grading Company | Action | New Grade | Date |
|---|---|---|---|
| Truist Securities | Maintain | Buy | 2026-01-05 |
| Barclays | Maintain | Overweight | 2026-01-05 |
| Bernstein | Maintain | Market Perform | 2025-11-12 |
| Wells Fargo | Maintain | Equal Weight | 2025-11-05 |
| Goldman Sachs | Maintain | Buy | 2025-11-04 |
| TD Cowen | Maintain | Buy | 2025-11-04 |
| JP Morgan | Maintain | Overweight | 2025-11-04 |
| Barclays | Maintain | Overweight | 2025-11-03 |
| Barclays | Maintain | Overweight | 2025-09-04 |
| Cantor Fitzgerald | Maintain | Overweight | 2025-08-26 |
Which company has the best grades?
UnitedHealth consistently earns strong ratings like Overweight, Outperform, and Buy from top firms. Cigna’s grades cluster around Buy and Overweight but include lower Market Perform and Equal Weight scores. Investors may view UnitedHealth’s broader consensus of higher grades as a stronger vote of confidence.
Risks specific to each company
The following categories identify critical pressure points and systemic threats facing UnitedHealth Group Incorporated and Cigna Corporation in the 2026 market environment:
1. Market & Competition
UnitedHealth Group Incorporated
- Faces intense competition in diversified healthcare segments, risking margin compression.
Cigna Corporation
- Competes in specialized insurance markets, facing pressure from integrated care disruptors.
2. Capital Structure & Debt
UnitedHealth Group Incorporated
- Debt-to-equity ratio at 0.78 signals moderate leverage; interest coverage neutral at 4.67x.
Cigna Corporation
- Similar leverage ratio (0.78) but stronger interest coverage at 6.75x reduces refinancing risk.
3. Stock Volatility
UnitedHealth Group Incorporated
- Beta of 0.425 indicates moderate sensitivity to market swings, offering relative stability.
Cigna Corporation
- Lower beta at 0.269 suggests less volatility, appealing for risk-averse investors.
4. Regulatory & Legal
UnitedHealth Group Incorporated
- Large scale and diversified operations expose it to complex regulatory environments.
Cigna Corporation
- Smaller scale offers some regulatory agility but risks in evolving insurance laws remain.
5. Supply Chain & Operations
UnitedHealth Group Incorporated
- Extensive Optum segments demand robust operational coordination, vulnerable to disruptions.
Cigna Corporation
- More focused care delivery reduces complexity but dependent on third-party vendors.
6. ESG & Climate Transition
UnitedHealth Group Incorporated
- Larger footprint heightens ESG scrutiny; transition risks in healthcare sustainability growing.
Cigna Corporation
- Smaller scale eases ESG management but still faces climate-related operational risks.
7. Geopolitical Exposure
UnitedHealth Group Incorporated
- Primarily US-based but international expansions expose it to geopolitical uncertainties.
Cigna Corporation
- Limited international exposure reduces geopolitical risk but limits diversification benefits.
Which company shows a better risk-adjusted profile?
UnitedHealth’s biggest risk is operational complexity that could amplify supply chain disruptions. Cigna’s primary concern lies in regulatory risks within a rapidly evolving insurance market. Cigna’s lower volatility and stronger interest coverage suggest a slightly better risk-adjusted profile. Notably, UnitedHealth’s unfavorable liquidity ratios (current and quick ratios below 1) heighten short-term risk concerns in 2026.
Final Verdict: Which stock to choose?
UnitedHealth Group’s superpower lies in its scale and operational efficiency, driving consistent value creation despite a recent decline in profitability. Its slightly unfavorable liquidity ratios warrant caution. It fits best in aggressive growth portfolios willing to navigate some short-term margin pressures.
Cigna’s strategic moat centers on its improving return on invested capital and a more favorable debt profile, offering a safer harbor relative to UnitedHealth. Its durable competitive advantage and steady cash flow suggest suitability for GARP investors who value stability with growth potential.
If you prioritize scale-driven growth and can tolerate margin fluctuations, UnitedHealth outshines with its dominant market position. However, if you seek a more stable investment with improving profitability, Cigna offers better stability and a durable moat. Both present compelling, yet distinct, analytical scenarios for different investor profiles.
Disclaimer: Investment carries a risk of loss of initial capital. The past performance is not a reliable indicator of future results. Be sure to understand risks before making an investment decision.
Go Further
I encourage you to read the complete analyses of UnitedHealth Group Incorporated and Cigna Corporation to enhance your investment decisions: