Home > Comparison > Healthcare > CI vs MOH
The strategic rivalry between Cigna Corporation and Molina Healthcare, Inc. shapes the healthcare plans sector’s evolution. Cigna operates as a diversified healthcare services provider with broad insurance offerings and integrated care solutions. Molina Healthcare focuses on managed care for low-income populations, emphasizing Medicaid and Medicare programs. This analysis contrasts their operational models to identify which company presents the superior risk-adjusted potential for a well-rounded, diversified portfolio.
Table of contents
Companies Overview
Cigna Corporation and Molina Healthcare, Inc. stand as significant players in the U.S. healthcare plans industry, shaping insurance and managed care markets.
Cigna Corporation: Comprehensive Health Services Leader
Cigna dominates as a diversified health services provider. Its core revenue comes from medical, pharmacy, behavioral health, and Medicare plans. In 2026, Cigna strategically focuses on integrated care delivery through its Evernorth segment, enhancing coordinated health solutions for employers, government entities, and international markets. Cigna’s broad product portfolio underpins its competitive strength.
Molina Healthcare, Inc.: Medicaid and Medicare Specialist
Molina Healthcare specializes in managed care for low-income populations under Medicaid, Medicare, and state marketplaces. Its revenue primarily derives from government-sponsored healthcare programs across 18 states. In 2026, Molina prioritizes expanding membership and optimizing Medicaid and Medicare offerings. Molina’s targeted focus on underserved markets defines its operational model.
Strategic Collision: Similarities & Divergences
Both firms serve the healthcare plans sector but diverge in scope and strategy. Cigna pursues a broad, integrated ecosystem spanning commercial and government clients. Molina adopts a narrower, government-focused approach targeting low-income populations. Their primary battleground lies in government healthcare programs, where scale and specialization compete. Investors should note Cigna’s diversified risk versus Molina’s concentrated exposure.
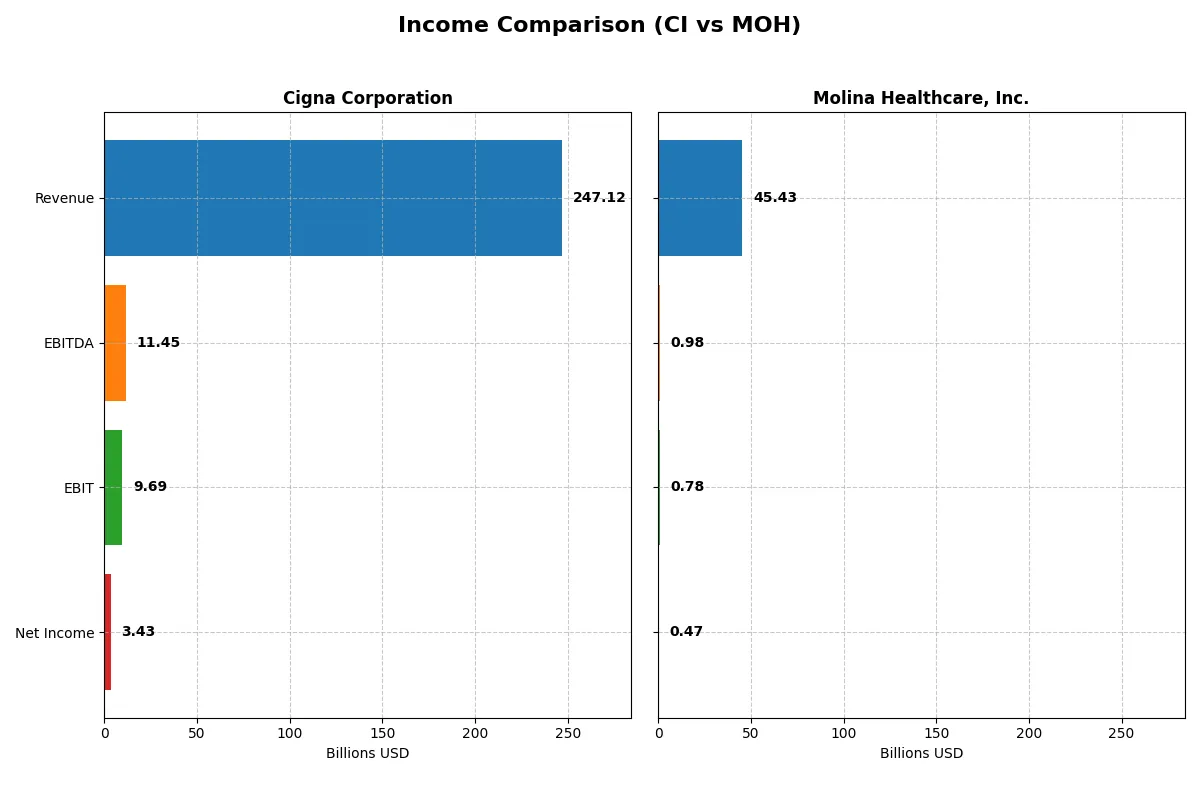
Income Statement Comparison
This data dissects the core profitability and scalability of both corporate engines to reveal who dominates the bottom line:
| Metric | Cigna Corporation (CI) | Molina Healthcare, Inc. (MOH) |
|---|---|---|
| Revenue | 247.1B | 40.7B |
| Cost of Revenue | 221.2B | 35.9B |
| Operating Expenses | 16.5B | 3.0B |
| Gross Profit | 25.96B | 4.74B |
| EBITDA | 11.45B | 1.89B |
| EBIT | 9.69B | 1.71B |
| Interest Expense | 1.44B | 118M |
| Net Income | 3.43B | 1.18B |
| EPS | 12.25 | 20.52 |
| Fiscal Year | 2024 | 2024 |
Income Statement Analysis: The Bottom-Line Duel
This income statement comparison reveals how efficiently each company converts revenue into profit and manages expenses over time.
Cigna Corporation Analysis
Cigna’s revenue surged from 160B in 2020 to 247B in 2024, reflecting strong top-line growth. However, net income declined from 8.46B to 3.43B, signaling margin pressure. Gross margin stayed stable near 10.5%, while net margin dropped to 1.39%. In 2024, Cigna’s operating efficiency weakened despite revenue momentum, evident in shrinking net income and EPS.
Molina Healthcare, Inc. Analysis
Molina’s revenue climbed steadily from 27.8B in 2021 to 45.4B in 2025, showing robust growth. Net income fell from 659M to 472M, compressing net margin to 1.04%. Gross profit vanished in 2025 due to cost reporting changes, raising concerns about margin sustainability. The latest year exposed declining profitability and deteriorating EPS, undermining its operational leverage.
Revenue Growth vs. Margin Resilience
Cigna delivers superior revenue scale with consistent gross margins but suffers a sharp net income decline. Molina shows solid revenue gains but struggles with margin erosion and negative profit growth. Based on fundamental performance, Cigna’s larger scale offers more stability, while Molina’s profile carries higher margin risk for investors.
Financial Ratios Comparison
These vital ratios act as a diagnostic tool to expose the underlying fiscal health, valuation premiums, and capital efficiency of the companies analyzed:
| Ratios | Cigna Corporation (CI) | Molina Healthcare, Inc. (MOH) |
|---|---|---|
| ROE | 8.37% | 11.60% |
| ROIC | 6.69% | 7.64% |
| P/E | 22.54 | 19.45 |
| P/B | 1.89 | 2.26 |
| Current Ratio | 0.84 | 1.69 |
| Quick Ratio | 0.73 | 1.69 |
| D/E | 0.78 | 0.97 |
| Debt-to-Assets | 20.51% | 25.38% |
| Interest Coverage | 6.56 | 4.07 |
| Asset Turnover | 1.59 | 2.92 |
| Fixed Asset Turnover | 298.46 | 150.92 |
| Payout ratio | 45.63% | 0% |
| Dividend yield | 2.02% | 0% |
| Fiscal Year | 2024 | 2025 |
Efficiency & Valuation Duel: The Vital Signs
Financial ratios act as the company’s DNA, unveiling hidden risks and operational excellence that raw numbers often mask.
Cigna Corporation
Cigna shows moderate profitability with an 8.37% ROE and slim 1.39% net margin, indicating pressure on core earnings. Its valuation is neutral at a 22.54 P/E and 1.89 P/B, suggesting the stock is fairly priced. Cigna rewards shareholders with a 2.02% dividend yield, signaling steady income amid reinvestment constraints.
Molina Healthcare, Inc.
Molina delivers a stronger 11.6% ROE but a low 1.04% net margin, reflecting tight profitability. The stock trades at a neutral 19.45 P/E and slightly higher 2.26 P/B, showing moderate valuation discipline. Molina offers no dividend, focusing on growth via reinvestment, supported by a robust 1.69 current ratio signaling good liquidity.
Balanced Valuation Meets Operational Discipline
Both companies show slightly favorable overall ratios, but Molina edges out with higher ROE and healthier liquidity. Cigna’s dividend suits income-focused investors, while Molina’s reinvestment strategy appeals to growth seekers. The choice depends on risk tolerance and income versus expansion preference.
Which one offers the Superior Shareholder Reward?
I observe that Cigna Corporation (CI) offers a 2.0% dividend yield with a 46% payout ratio, supported by strong free cash flow coverage (86%). CI also maintains buybacks, enhancing total shareholder return. Molina Healthcare (MOH) pays no dividends but reinvests aggressively into growth and acquisitions, yet shows negative free cash flow recently. MOH’s buyback activity is minimal or absent, reducing immediate shareholder reward. Historically, CI’s balanced dividend and buyback strategy offers more sustainable, attractive long-term returns compared to MOH’s reinvestment-heavy model, which carries higher risk in 2026. I conclude CI delivers superior total shareholder reward today.
Comparative Score Analysis: The Strategic Profile
The radar chart reveals the fundamental DNA and trade-offs of Cigna Corporation and Molina Healthcare, Inc., highlighting their distinct financial strengths and weaknesses:
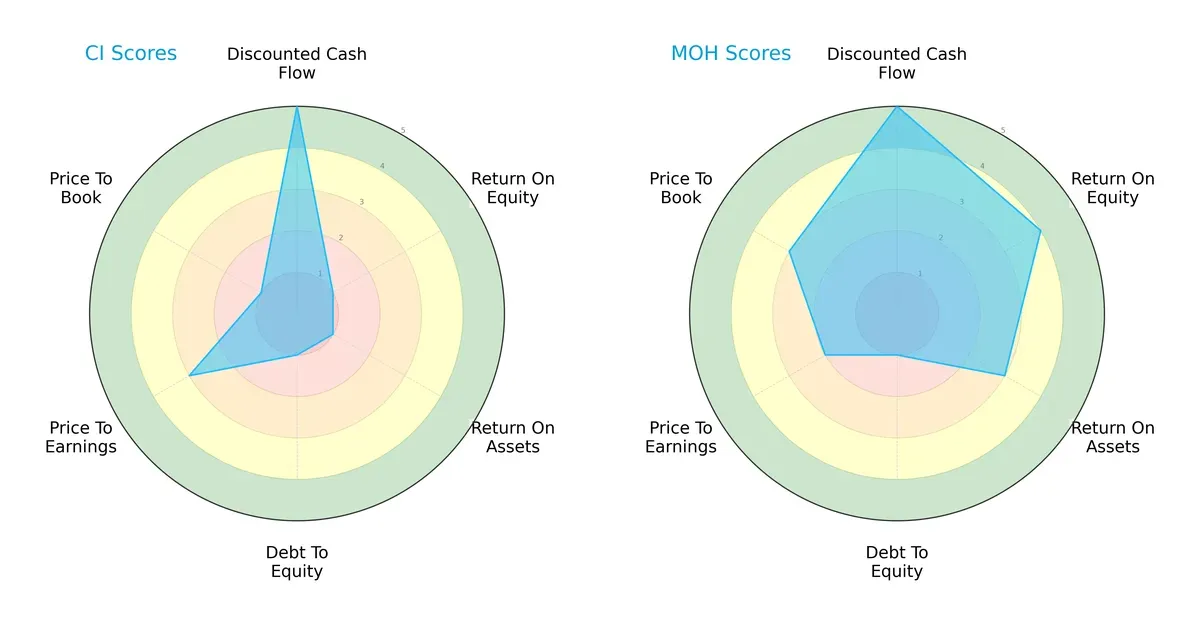
Cigna leans heavily on its discounted cash flow (DCF) strength but suffers from very weak return on equity (ROE), return on assets (ROA), and debt-to-equity profiles. Molina offers a more balanced profile with solid ROE and ROA scores, though it shares Cigna’s weakness in debt management. Molina’s valuation metrics are moderately better, while Cigna’s valuation is mixed, indicating Molina’s more sustainable financial footing.
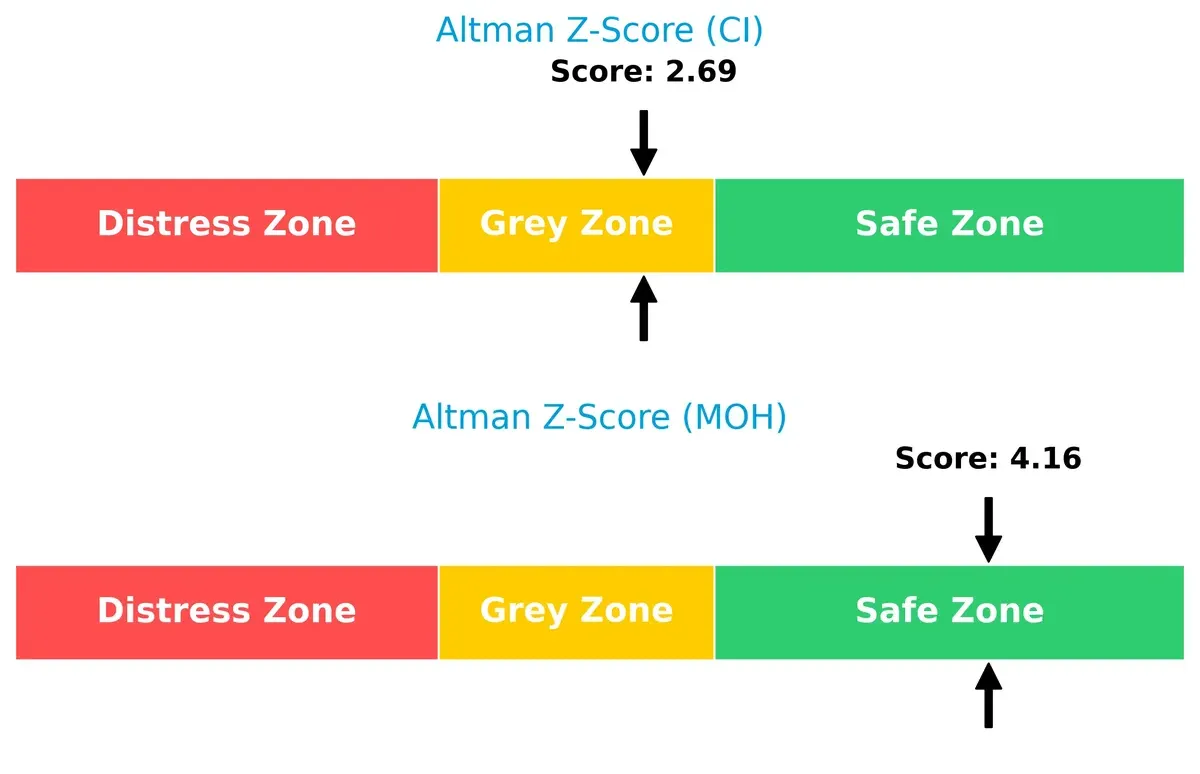
Bankruptcy Risk: Solvency Showdown
Molina’s Altman Z-Score of 4.16 places it firmly in the safe zone, signaling strong resilience against bankruptcy. Cigna’s 2.69 score sits in the grey zone, indicating moderate risk and a need for cautious monitoring in this cycle:
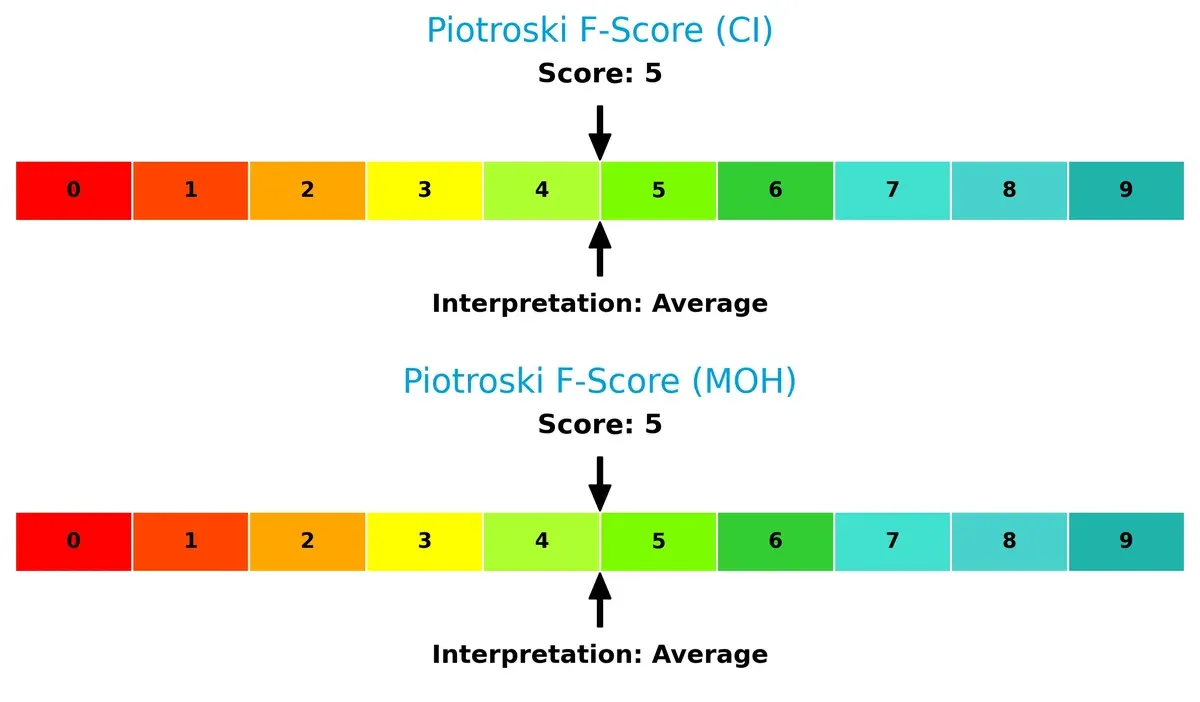
Financial Health: Quality of Operations
Both companies have identical Piotroski F-Scores of 5, indicating average financial health. Neither shows peak operational quality nor significant red flags, but neither stands out as a clear leader in internal financial strength:
How are the two companies positioned?
This section dissects CI and MOH’s operational DNA by comparing revenue distribution and internal dynamics. The goal is to confront their economic moats and identify which model delivers the most resilient, sustainable competitive advantage today.
Revenue Segmentation: The Strategic Mix
This visual comparison dissects how Cigna Corporation and Molina Healthcare, Inc. diversify their income streams and where their primary sector bets lie:
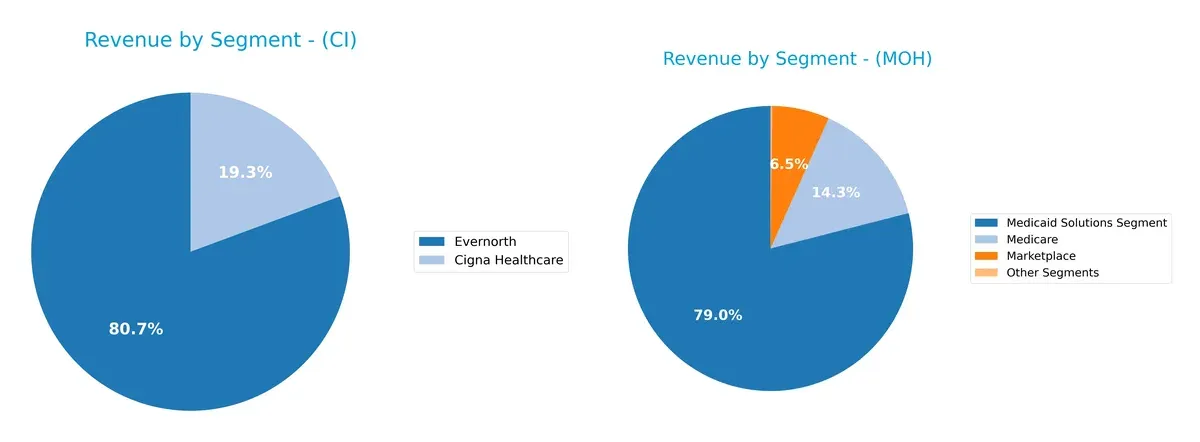
Cigna leans heavily on Evernorth, which dwarfs its Cigna Healthcare unit with $198B vs. $47.5B in 2024, showing a concentrated but vertically integrated ecosystem. Molina Healthcare pivots around Medicaid Solutions, anchoring $30.6B, with smaller Medicare and Marketplace segments adding modest diversification. Cigna’s reliance on one dominant segment poses concentration risk, yet it benefits from infrastructure dominance. Molina’s narrower, Medicaid-focused mix signals targeted market strength but exposes it to policy shifts.
Strengths and Weaknesses Comparison
This table compares the strengths and weaknesses of Cigna Corporation and Molina Healthcare, Inc.:
Cigna Corporation Strengths
- Large, diversified revenue streams across healthcare and Evernorth segments
- Favorable debt-to-assets and interest coverage ratios
- High asset turnover rates indicating efficient use of assets
Molina Healthcare Strengths
- Favorable current and quick ratios showing strong liquidity
- Higher ROE and neutral ROIC reflect effective capital use
- Favorable asset turnover and controlled debt-to-assets ratio
Cigna Corporation Weaknesses
- Low current and quick ratios below 1 signal liquidity concerns
- Unfavorable net margin and ROE indicate profitability challenges
- Dividend yield of 2.02% may strain cash flow
Molina Healthcare Weaknesses
- Unfavorable net margin and no dividend yield suggest profitability and shareholder return limits
- Interest coverage ratio is neutral, showing moderate risk
- Higher debt-to-assets ratio compared to CI
Cigna excels in asset efficiency and conservative leverage but faces liquidity and profitability pressures. Molina shows stronger liquidity and slightly better profitability metrics but lacks dividend payouts and carries comparatively higher leverage. Both companies maintain a slightly favorable financial stance, underscoring distinct strategic focuses.
The Moat Duel: Analyzing Competitive Defensibility
A structural moat is the only true shield protecting long-term profits from relentless competitive erosion:
Cigna Corporation: Integrated Care Coordination Moat
Cigna’s moat stems from its integrated care delivery and pharmacy benefits management. This drives stable 10.5% gross margins and growing ROIC, signaling efficient capital use. Expansion into digital health services in 2026 could deepen this advantage.
Molina Healthcare, Inc.: Government Program Focused Moat
Molina’s moat relies on specialized Medicaid and Medicare managed care expertise, contrasting Cigna’s broader model. It creates value with positive ROIC but faces margin pressure and a declining profitability trend. Growth in Medicaid expansion states offers upside, though margin risks persist.
Integrated Care vs. Government Program Specialization: Which Moat Holds Stronger?
Cigna’s wider moat is evident in its sustained ROIC growth and diversified revenue base, outmatching Molina’s narrower, margin-challenged positioning. I see Cigna better equipped to defend and expand market share amid evolving healthcare dynamics.
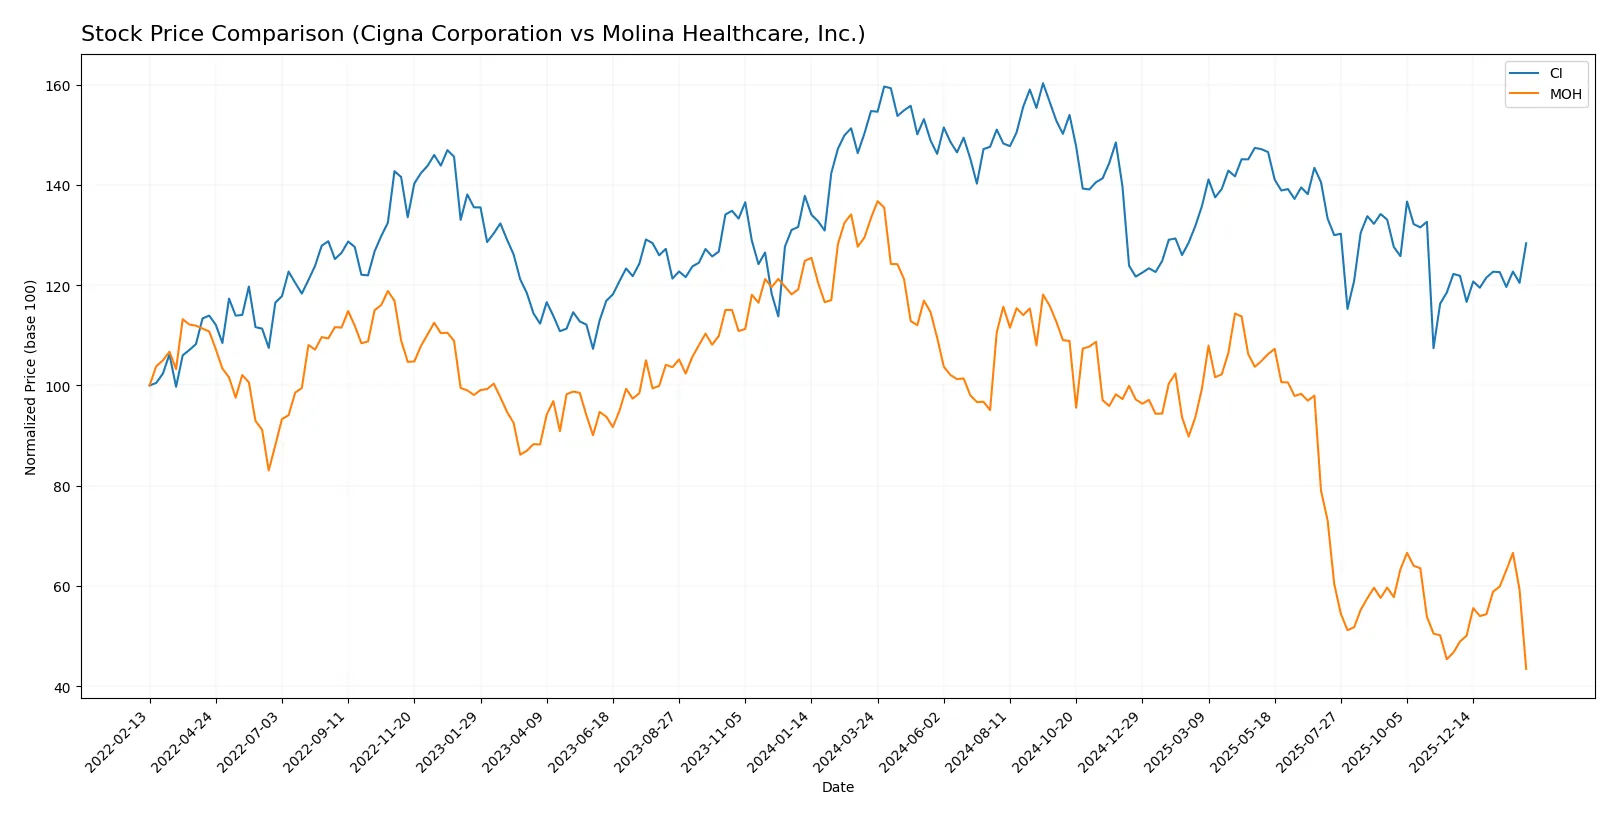
Which stock offers better returns?
The past year shows contrasting dynamics: Cigna Corporation’s stock fell 17%, yet gained 5% recently, while Molina Healthcare, Inc.’s stock dropped 67% overall and continued declining by nearly 7% in the latest months.
Trend Comparison
Cigna Corporation’s stock declined 17.04% over the past 12 months, reflecting a bearish trend with accelerating losses. The recent 5.02% gain suggests a short-term recovery amid high volatility (28.52 std dev).
Molina Healthcare, Inc. experienced a severe 67.43% drop in the past year, confirming a bearish trend with accelerating declines. Recent losses of 6.95% and extreme volatility (74.85 std dev) underscore ongoing weakness.
Cigna delivered the highest market performance, with a less severe decline and recent upward momentum, contrasting Molina’s steep and accelerating depreciation.
Target Prices
Analysts present a clear consensus on target prices for Cigna Corporation and Molina Healthcare, Inc.
| Company | Target Low | Target High | Consensus |
|---|---|---|---|
| Cigna Corporation | 294 | 372 | 322.25 |
| Molina Healthcare, Inc. | 158 | 224 | 181 |
Cigna’s target consensus at 322.25 suggests upside from the current 292.05 price, signaling moderate growth expectations. Molina’s consensus of 181 indicates significant potential rebound above the current 131.72 stock price.

Don’t Let Luck Decide Your Entry Point
Optimize your entry points with our advanced ProRealTime indicators. You’ll get efficient buy signals with precise price targets for maximum performance. Start outperforming now!
How do institutions grade them?
Cigna Corporation Grades
Here are the most recent grades assigned to Cigna Corporation by leading firms:
| Grading Company | Action | New Grade | Date |
|---|---|---|---|
| RBC Capital | Maintain | Outperform | 2026-02-06 |
| Barclays | Maintain | Overweight | 2026-02-06 |
| Guggenheim | Maintain | Buy | 2026-02-06 |
| Guggenheim | Maintain | Buy | 2026-02-02 |
| Barclays | Maintain | Overweight | 2026-01-05 |
| Truist Securities | Maintain | Buy | 2026-01-05 |
| Bernstein | Maintain | Market Perform | 2025-11-12 |
| Wells Fargo | Maintain | Equal Weight | 2025-11-05 |
| Goldman Sachs | Maintain | Buy | 2025-11-04 |
| TD Cowen | Maintain | Buy | 2025-11-04 |
Molina Healthcare, Inc. Grades
Below are the most recent grades given to Molina Healthcare, Inc. by reputable grading firms:
| Grading Company | Action | New Grade | Date |
|---|---|---|---|
| Wells Fargo | Maintain | Overweight | 2026-01-07 |
| Barclays | Maintain | Underweight | 2026-01-05 |
| Wells Fargo | Maintain | Overweight | 2025-11-12 |
| Goldman Sachs | Maintain | Neutral | 2025-10-24 |
| UBS | Maintain | Neutral | 2025-10-24 |
| Barclays | Downgrade | Underweight | 2025-10-24 |
| Cantor Fitzgerald | Maintain | Neutral | 2025-10-24 |
| Morgan Stanley | Maintain | Equal Weight | 2025-10-14 |
| Wells Fargo | Maintain | Overweight | 2025-10-07 |
| Bernstein | Maintain | Outperform | 2025-09-05 |
Which company has the best grades?
Cigna consistently earns favorable grades such as Buy and Outperform from multiple firms. Molina’s grades vary more, with several Neutral and Underweight ratings. Cigna’s stronger grades suggest greater institutional confidence, possibly influencing investor sentiment positively.
Risks specific to each company
The following categories identify the critical pressure points and systemic threats facing both firms in the 2026 market environment:
1. Market & Competition
Cigna Corporation
- Faces intense competition from integrated health insurers and tech-driven disruptors in healthcare plans.
Molina Healthcare, Inc.
- Competes primarily in government-sponsored Medicaid and Medicare markets, vulnerable to policy shifts and smaller scale.
2. Capital Structure & Debt
Cigna Corporation
- Maintains moderate leverage with a debt-to-assets at 20.5%, interest coverage strong at 6.75x.
Molina Healthcare, Inc.
- Higher debt-to-assets ratio at 25.4% and weaker interest coverage at 4.07x signals increased financial risk.
3. Stock Volatility
Cigna Corporation
- Exhibits low beta (0.28), indicating stable stock less sensitive to market swings.
Molina Healthcare, Inc.
- Beta near 0.49 shows moderate volatility, with recent 25% price drop reflecting riskier sentiment.
4. Regulatory & Legal
Cigna Corporation
- Subject to complex healthcare regulations impacting Medicare Advantage and international markets.
Molina Healthcare, Inc.
- Regulatory risk heightened due to Medicaid focus and reliance on state-level policy changes.
5. Supply Chain & Operations
Cigna Corporation
- Diverse service segments and large employee base (71K) provide operational resilience.
Molina Healthcare, Inc.
- Smaller scale (18K employees) and concentrated state operations increase operational vulnerability.
6. ESG & Climate Transition
Cigna Corporation
- ESG initiatives supported by global operations but must navigate complex healthcare sustainability demands.
Molina Healthcare, Inc.
- ESG exposure linked to social responsibility in low-income healthcare, with potential regulatory pressure.
7. Geopolitical Exposure
Cigna Corporation
- Some international exposure adds geopolitical risk but diversifies revenue streams.
Molina Healthcare, Inc.
- Primarily US-focused, limiting geopolitical risk but increasing dependency on domestic political environment.
Which company shows a better risk-adjusted profile?
Cigna’s dominant risk is its unfavorable liquidity ratios, risking short-term financial flexibility. Molina’s greatest threat is regulatory and market dependence on government programs, risking revenue volatility. Despite Cigna’s liquidity concerns, its stable stock and diversified operations offer a better risk-adjusted profile. Molina’s steep recent share price drop and regulatory exposure heighten caution.
Final Verdict: Which stock to choose?
Cigna Corporation’s superpower lies in its robust capital allocation and a very favorable moat, demonstrated by a growing ROIC well above its WACC. This indicates sustainable competitive advantage and value creation. A point of vigilance is its weak liquidity position, which could pressure short-term resilience. It suits investors targeting steady growth with moderate risk tolerance.
Molina Healthcare, Inc. leverages a strategic moat anchored in efficient asset utilization and recurring healthcare demand, reflected by a strong ROIC despite a declining trend. Its healthier liquidity ratios suggest better short-term safety compared to Cigna. Molina fits portfolios seeking Growth at a Reasonable Price (GARP) with a preference for operational efficiency and stability.
If you prioritize sustainable competitive advantage and long-term value creation, Cigna outshines due to its superior capital returns and moat durability. However, if you seek better liquidity and operational efficiency with a balanced risk profile, Molina offers better stability and a compelling growth framework, albeit with a less consistent profitability trajectory.
Disclaimer: Investment carries a risk of loss of initial capital. The past performance is not a reliable indicator of future results. Be sure to understand risks before making an investment decision.
Go Further
I encourage you to read the complete analyses of Cigna Corporation and Molina Healthcare, Inc. to enhance your investment decisions: