Home > Comparison > Healthcare > CI vs HUM
The strategic rivalry between Cigna Corporation and Humana Inc. shapes the competitive landscape of the healthcare plans industry. Cigna operates as a diversified healthcare service provider with a broad portfolio including pharmacy and behavioral health, while Humana focuses on retail and specialty health insurance plans. This analysis pits Cigna’s scale against Humana’s targeted growth approach to determine which offers a superior risk-adjusted return for a diversified portfolio.

Table of contents
Companies Overview
Cigna Corporation and Humana Inc. remain pivotal players in the U.S. healthcare plans market, shaping insurance trends and patient services.
Cigna Corporation: Integrated Health Services Leader
Cigna dominates as a provider of diversified insurance and health services. Its Evernorth segment drives revenue through coordinated pharmacy, benefits management, and care delivery solutions. In 2026, Cigna sharpens its strategic focus on expanding Medicare Advantage and international healthcare benefits to sustain growth and competitive advantage.
Humana Inc.: Specialized Health & Well-being Provider
Humana operates as a health and well-being company emphasizing Medicare, Medicaid, and specialty benefit plans. Its revenue engine relies heavily on retail, group, and healthcare services segments, including home health and pharmacy solutions. The 2026 strategy targets scaling Medicaid and specialty product membership to deepen market penetration.
Strategic Collision: Similarities & Divergences
Both firms compete in the healthcare insurance ecosystem but diverge in approach: Cigna pursues broad, integrated service offerings while Humana zeroes in on specialized Medicare and Medicaid plans. Their primary battleground is Medicare Advantage membership growth. Cigna’s scale contrasts with Humana’s focused niche, shaping unique risk-return profiles for investors.
Income Statement Comparison
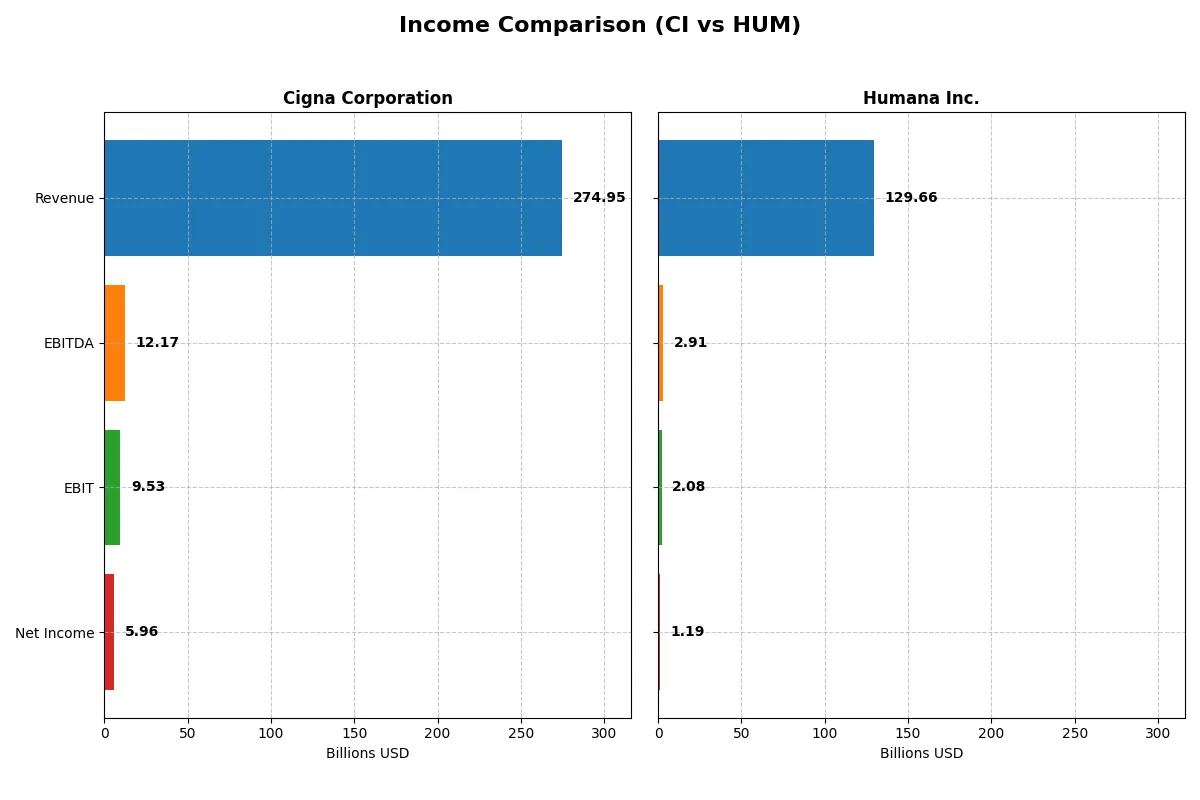
This data dissects the core profitability and scalability of both corporate engines to reveal who dominates the bottom line:
| Metric | Cigna Corporation (CI) | Humana Inc. (HUM) |
|---|---|---|
| Revenue | 275B | 130B |
| Cost of Revenue | 249B | 111B |
| Operating Expenses | 16.9B | 17.4B |
| Gross Profit | 26.0B | 18.9B |
| EBITDA | 12.2B | 2.9B |
| EBIT | 9.5B | 2.1B |
| Interest Expense | 1.38B | 631M |
| Net Income | 6.0B | 1.19B |
| EPS | 22.3 | 9.87 |
| Fiscal Year | 2025 | 2025 |
Income Statement Analysis: The Bottom-Line Duel
This income statement comparison reveals which company operates its financial engine with superior efficiency and sustainable profitability.
Cigna Corporation Analysis
Cigna’s revenue rose sharply from 174B in 2021 to 275B in 2025, while net income showed moderate growth with a 10.9% increase over five years. Gross margin held steady near 9.5%, and net margin improved to 2.17% in 2025, signaling disciplined cost control. Despite a slight EBIT decline last year, net income and EPS surged, reflecting operational momentum and effective capital allocation.
Humana Inc. Analysis
Humana’s revenue climbed from 83B in 2021 to 130B in 2025, marking solid top-line growth. However, net income contracted sharply by nearly 60% over five years, with net margin dropping below 1%. Gross margin remains higher than Cigna’s at 14.5%, but deteriorating EBIT and net margin trends reveal margin pressure. Recent EPS and net income declines highlight challenges in sustaining profitability despite revenue gains.
Margin Discipline vs. Revenue Expansion
Cigna outperforms Humana through stronger net income growth and margin resilience, despite similar revenue expansion. Cigna’s stable margins and EPS growth offer a clearer path to shareholder value. Humana’s profile, marked by margin erosion and shrinking profits, appeals less to investors prioritizing earnings quality and operational efficiency.
Financial Ratios Comparison
These vital ratios act as a diagnostic tool to expose the underlying fiscal health, valuation premiums, and capital efficiency of the companies compared below:
| Ratios | Cigna Corporation (CI) | Humana Inc. (HUM) |
|---|---|---|
| ROE | 8.37% (2024) | 7.37% (2024) |
| ROIC | 6.69% (2024) | – |
| P/E | 22.54 (2024) | 25.97 (2025) |
| P/B | 1.89 (2024) | 1.87 (2024) |
| Current Ratio | 0.84 (2024) | 0.00 |
| Quick Ratio | 0.73 (2024) | 0.00 |
| D/E | 0.78 (2024) | 0.68 (2024) |
| Debt-to-Assets | 20.51% (2024) | 23.98% (2024) |
| Interest Coverage | 6.56 (2024) | 4.29 (2025) |
| Asset Turnover | 1.59 (2024) | 2.53 (2024) |
| Fixed Asset Turnover | 298.46 (2024) | 39.56 (2024) |
| Payout Ratio | 45.63% (2024) | 36.20% (2025) |
| Dividend Yield | 2.02% (2024) | 1.39% (2025) |
| Fiscal Year | 2024 | 2025 |
Efficiency & Valuation Duel: The Vital Signs
Ratios act as a company’s DNA, exposing hidden risks and revealing operational excellence beneath surface numbers.
Cigna Corporation
Cigna’s 2025 metrics show a modest net margin of 2.17% and a low ROE, indicating weak profitability. The stock trades at a reasonable P/E of 12.29, suggesting it is undervalued relative to peers. A dividend yield of 2.19% offers steady shareholder returns, balancing modest growth with income.
Humana Inc.
Humana’s 2025 results reveal a lower net margin of 0.92% and similarly poor ROE, signaling profitability challenges. Its P/E of 25.97 reflects a stretched valuation, pricing in future growth. Dividend yield stands at 1.39%, indicating less emphasis on income and more on reinvestment or expansion.
Valuation Discipline vs. Growth Premium
Cigna offers a better balance of valuation and shareholder income with a lower P/E and higher dividend. Humana’s premium multiple hints at growth expectations but carries more risk. Value-focused investors may prefer Cigna, while growth-seekers might lean toward Humana’s profile.
Which one offers the Superior Shareholder Reward?
I compare Cigna Corporation (CI) and Humana Inc. (HUM) on dividends, payout ratios, and buybacks to find the superior shareholder reward. CI yields 2.2% with a 27% payout ratio and maintains steady buybacks, signaling balanced distribution. HUM yields 1.4%, pays 36% of earnings, but shows weaker free cash flow coverage and lower buyback intensity. CI’s model relies on sustainable free cash flow and moderate leverage (interest coverage ~6.6x), supporting long-term dividends and buybacks. HUM trades at higher multiples (P/E ~26 vs. CI’s 12) with stretched free cash flow coverage (~41%), risking dividend sustainability. For 2026, I favor CI’s distribution mix for superior total shareholder return and durable value creation.
Comparative Score Analysis: The Strategic Profile
The radar chart reveals the fundamental DNA and trade-offs of Cigna Corporation and Humana Inc., highlighting core strengths and vulnerabilities:
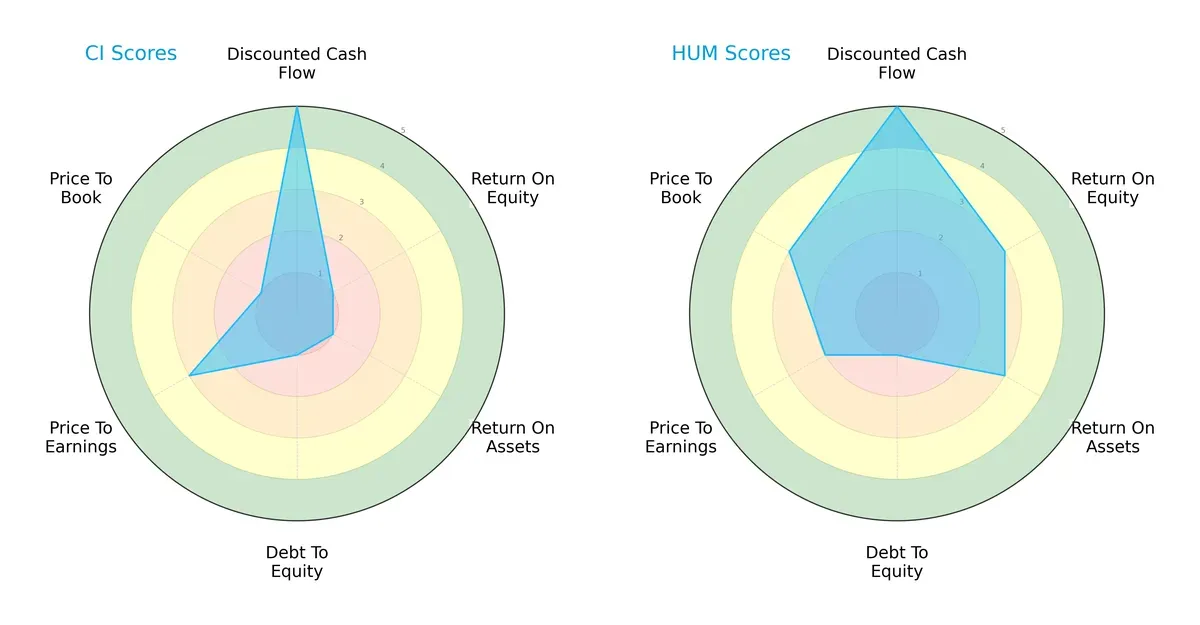
Humana displays a more balanced profile, with moderate scores in ROE (3) and ROA (3), signaling efficient asset and equity utilization. Cigna excels in discounted cash flow (5) but suffers from weak profitability (ROE 1, ROA 1) and financial leverage (debt-to-equity 1). Valuation metrics favor Humana moderately, while Cigna’s low price-to-book score flags potential market skepticism.
Bankruptcy Risk: Solvency Showdown
Humana’s Altman Z-Score of 4.43 places it securely in the safe zone, while Cigna’s 2.68 positions it in the grey zone, signaling moderate bankruptcy risk:
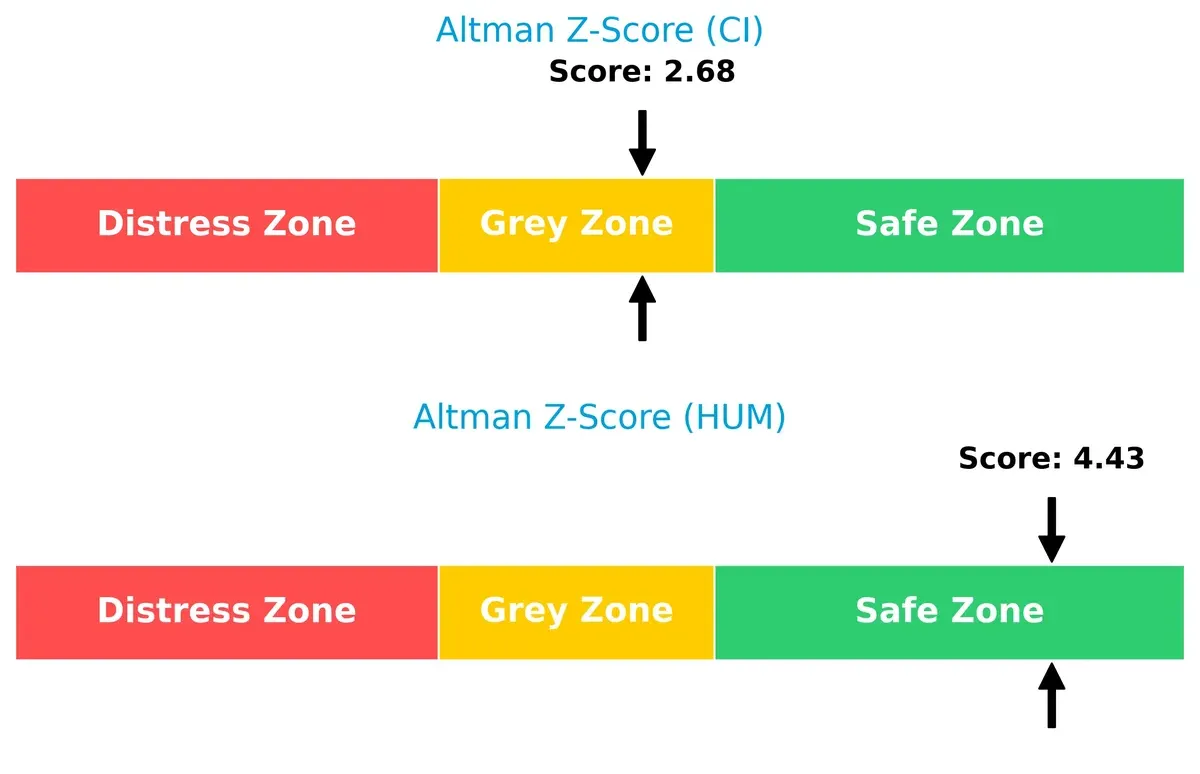
This gap underscores Humana’s stronger solvency and resilience in this late-cycle environment, whereas Cigna’s moderate risk warrants close monitoring.
Financial Health: Quality of Operations
Humana’s Piotroski F-Score of 7 outperforms Cigna’s 5, indicating more robust internal financial metrics and operational strength:
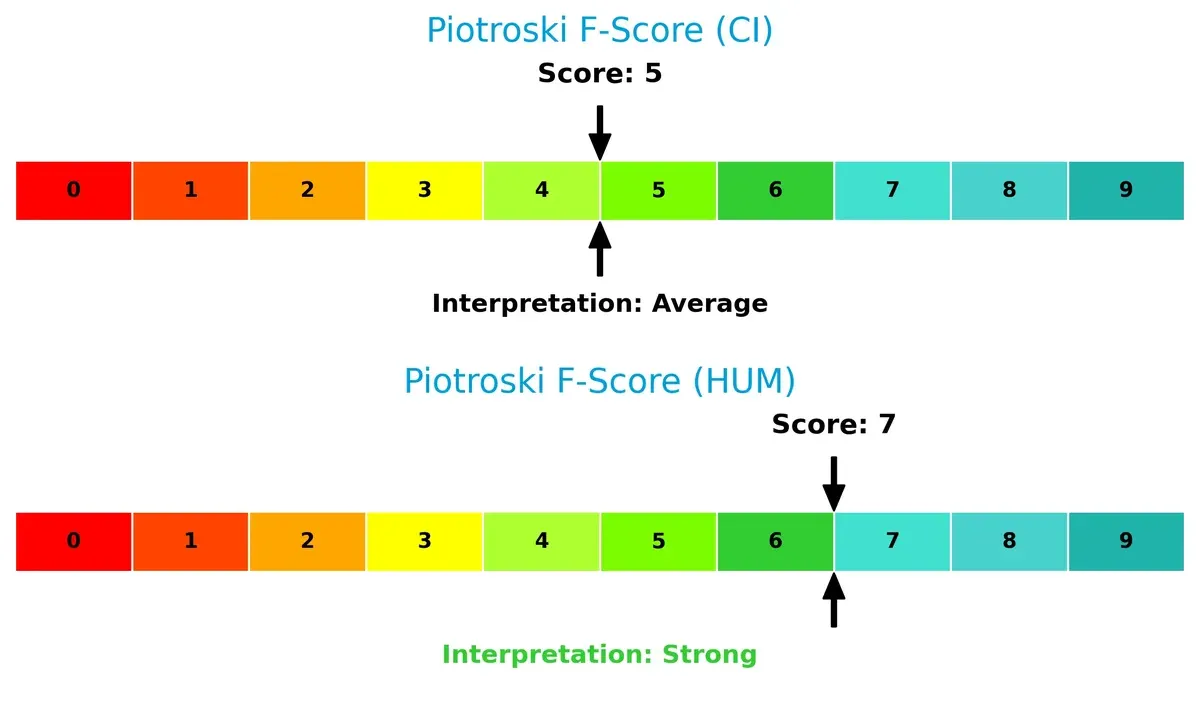
I view Humana as exhibiting stronger financial health, while Cigna’s average score suggests some red flags in profitability or efficiency that investors should scrutinize.
How are the two companies positioned?
This section dissects the operational DNA of Cigna and Humana by comparing their revenue distribution and internal dynamics. The goal is to confront their economic moats and identify the most resilient, sustainable competitive advantage today.
Revenue Segmentation: The Strategic Mix
This visual comparison dissects how Cigna Corporation and Humana Inc. diversify their income streams and where their primary sector bets lie:
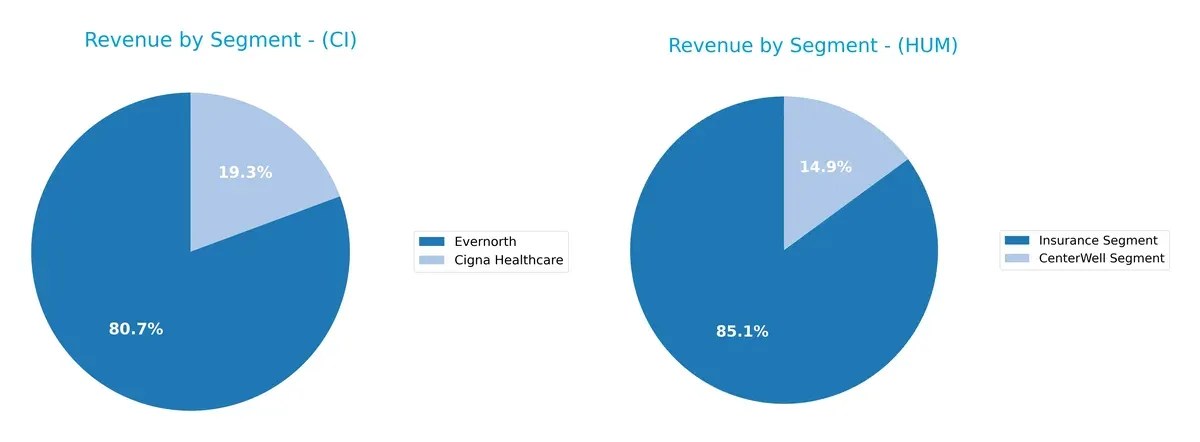
Cigna leans heavily on Evernorth, which dwarfs its Cigna Healthcare segment at $198B versus $47.5B in 2024. This concentration anchors Cigna’s ecosystem lock-in via health services. Humana shows a less concentrated mix, with $114B in Insurance and $19.9B from CenterWell. Humana’s split suggests strategic diversification across insurance and healthcare services, mitigating concentration risk compared to Cigna’s dominant segment reliance.
Strengths and Weaknesses Comparison
This table compares the Strengths and Weaknesses of Cigna Corporation and Humana Inc.:
Cigna Corporation Strengths
- Diverse revenue streams from Evernorth and Cigna Healthcare segments
- Significant US and international presence
- Favorable PE ratio and solid interest coverage
- Dividend yield above 2% supports shareholder returns
Humana Inc. Strengths
- Strong revenues from Insurance and CenterWell segments
- Favorable debt ratios indicate financial stability
- Consistent segment growth in healthcare services
- Positive asset management despite neutral interest coverage
Cigna Corporation Weaknesses
- Unfavorable net margin, ROE, and ROIC indicate weak profitability
- Low liquidity ratios signal potential cash flow issues
- Asset turnover ratios are unfavorable, limiting operational efficiency
Humana Inc. Weaknesses
- Lower net margin and unfavorable profitability ratios
- Unfavorable PE ratio suggests high valuation risk
- Neutral dividend yield and weaker interest coverage ratio
- Lack of geographic diversification compared to peer
Cigna shows stronger diversification and financial stability with better dividend yield and interest coverage. Humana’s weaker profitability and geographic concentration highlight strategic risks to monitor closely.
The Moat Duel: Analyzing Competitive Defensibility
A structural moat is the only reliable shield protecting long-term profits from relentless competitive pressure. Let’s break down the defensive strengths of two healthcare giants:
Cigna Corporation: Integrated Care Coordination Moat
Cigna leverages its extensive Evernorth platform to create switching costs through integrated care and pharmacy management. This drives stable margins and strong revenue growth. Expansion in international markets could deepen this moat in 2026.
Humana Inc.: Specialized Medicare and Wellness Moat
Humana’s moat relies on its Medicare Advantage expertise and wellness services, contrasting Cigna’s broader platform. Its positioning weakens with recent margin pressures, but specialty service growth offers potential upside.
Integrated Coordination vs. Medicare Specialization
Cigna’s integrated care model builds a wider moat with diversified revenue streams and margin stability. Humana’s moat is narrower, challenged by profitability headwinds. Cigna is better positioned to defend and expand market share in 2026.
Which stock offers better returns?
Over the past 12 months, both stocks exhibit clear bearish trends, with notable price declines and distinct trading volume dynamics reflecting seller dominance.
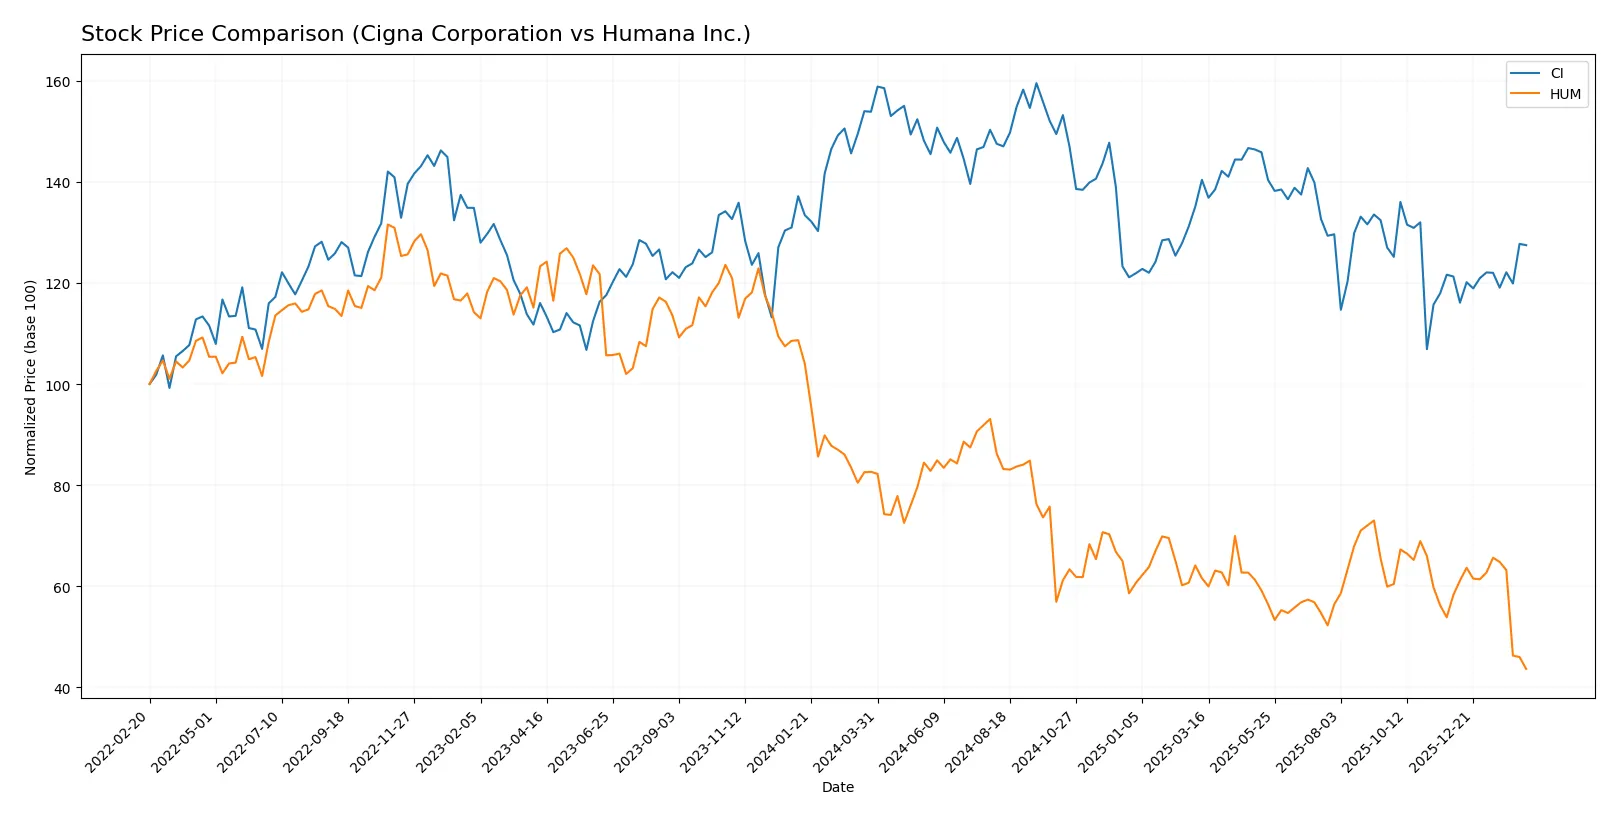
Trend Comparison
Cigna Corporation’s stock fell 17.15% over the past year, showing a bearish trend with accelerating decline. It recorded a high of 364.72 and a low of 244.41, with volatility at 28.34%.
Humana Inc.’s stock dropped 47.18% over the same period, also bearish but with decelerating losses. Its price ranged from 392.63 at peak to 184.1 at trough, and volatility was higher at 46.15%.
Comparing both, Cigna’s decline was less severe than Humana’s, delivering the higher relative market performance over the last 12 months.
Target Prices
Analysts present a cautiously optimistic consensus for Cigna Corporation and Humana Inc.
| Company | Target Low | Target High | Consensus |
|---|---|---|---|
| Cigna Corporation | 300 | 375 | 324.83 |
| Humana Inc. | 146 | 345 | 247.07 |
Cigna’s target consensus exceeds its current price by 11%, signaling moderate upside. Humana’s wide target range reflects greater uncertainty but suggests substantial growth potential versus its current price.

Don’t Let Luck Decide Your Entry Point
Optimize your entry points with our advanced ProRealTime indicators. You’ll get efficient buy signals with precise price targets for maximum performance. Start outperforming now!
How do institutions grade them?
Here is a comparison of the latest institutional grades for Cigna Corporation and Humana Inc.:
Cigna Corporation Grades
This table summarizes recent grades from recognized financial institutions for Cigna Corporation.
| Grading Company | Action | New Grade | Date |
|---|---|---|---|
| TD Cowen | Maintain | Buy | 2026-02-09 |
| Guggenheim | Maintain | Buy | 2026-02-06 |
| RBC Capital | Maintain | Outperform | 2026-02-06 |
| Barclays | Maintain | Overweight | 2026-02-06 |
| Guggenheim | Maintain | Buy | 2026-02-02 |
| Truist Securities | Maintain | Buy | 2026-01-05 |
| Barclays | Maintain | Overweight | 2026-01-05 |
| Bernstein | Maintain | Market Perform | 2025-11-12 |
| Wells Fargo | Maintain | Equal Weight | 2025-11-05 |
| TD Cowen | Maintain | Buy | 2025-11-04 |
Humana Inc. Grades
This table summarizes recent grades from recognized financial institutions for Humana Inc.
| Grading Company | Action | New Grade | Date |
|---|---|---|---|
| TD Cowen | Maintain | Hold | 2026-02-13 |
| Cantor Fitzgerald | Maintain | Neutral | 2026-02-12 |
| Jefferies | Maintain | Buy | 2026-02-12 |
| Guggenheim | Maintain | Buy | 2026-02-12 |
| RBC Capital | Downgrade | Sector Perform | 2026-02-12 |
| UBS | Maintain | Neutral | 2026-02-12 |
| Morgan Stanley | Downgrade | Underweight | 2026-02-02 |
| Wells Fargo | Downgrade | Equal Weight | 2026-01-07 |
| Barclays | Maintain | Equal Weight | 2026-01-05 |
| Morgan Stanley | Maintain | Equal Weight | 2025-12-18 |
Which company has the best grades?
Cigna consistently receives stronger grades, predominantly Buy and Outperform ratings. Humana shows a more mixed profile with several downgrades and Hold to Neutral ratings. This discrepancy may influence investor confidence and portfolio positioning.
Risks specific to each company
The following categories identify the critical pressure points and systemic threats facing both firms in the 2026 market environment:
1. Market & Competition
Cigna Corporation
- Larger market cap (78B) supports scale advantages but faces intense sector competition.
Humana Inc.
- Smaller market cap (22B) limits scale but focuses on niche specialty and Medicare segments.
2. Capital Structure & Debt
Cigna Corporation
- Favorable debt metrics and strong interest coverage (6.9x) reduce financial distress risk.
Humana Inc.
- Debt metrics less favorable; interest coverage moderate (3.3x), increasing refinancing risk.
3. Stock Volatility
Cigna Corporation
- Very low beta (0.28) indicates defensive stock with limited price swings.
Humana Inc.
- Higher beta (0.44) signals greater sensitivity to market fluctuations.
4. Regulatory & Legal
Cigna Corporation
- Exposure to complex healthcare regulations; must navigate government reimbursement changes.
Humana Inc.
- Similar regulatory pressures; specialty services add compliance complexity.
5. Supply Chain & Operations
Cigna Corporation
- Integrated Evernorth segment helps manage operational risks across service delivery.
Humana Inc.
- Diverse service lines increase operational complexity and potential supply chain disruptions.
6. ESG & Climate Transition
Cigna Corporation
- Increasing focus on sustainable healthcare solutions; ESG initiatives underway.
Humana Inc.
- Strong emphasis on social determinants of health; ESG risks tied to community impact.
7. Geopolitical Exposure
Cigna Corporation
- Primarily US-focused, limiting direct geopolitical risk but sensitive to domestic policy shifts.
Humana Inc.
- Also US-centric with Medicaid and Medicare exposure, vulnerable to federal and state policy changes.
Which company shows a better risk-adjusted profile?
Cigna’s strongest risk is its modest profitability and operational efficiency, which could pressure margins in a competitive market. Humana faces greater financial leverage risk with weaker interest coverage, heightening default concerns despite niche market strengths. I favor Cigna for a better risk-adjusted profile, supported by its stronger balance sheet and lower stock volatility. Notably, Humana’s Altman Z-score in the safe zone contrasts with Cigna’s grey zone, signaling relative financial stability but tempered by leverage risk.
Final Verdict: Which stock to choose?
Cigna Corporation’s superpower lies in its ability to generate consistent free cash flow and maintain a disciplined capital allocation approach. This cash machine strength supports steady dividend yields, appealing to income-focused investors. Its point of vigilance remains a somewhat weak liquidity position, which could pressure short-term flexibility. Cigna fits well in portfolios targeting stable income with moderate growth.
Humana Inc. commands a strategic moat through its focused healthcare services and managed care expertise, creating recurring revenue streams that cushion earnings volatility. Compared to Cigna, Humana offers less financial robustness but compensates with a more conservative debt profile and higher operational resilience. It suits investors seeking growth at a reasonable price with a tilt toward defensive healthcare exposure.
If you prioritize reliable cash generation and income stability, Cigna outshines as the compelling choice due to its free cash flow dominance and attractive dividend yield. However, if you seek a growth-oriented healthcare play with stronger operational moats and defensive characteristics, Humana offers better stability despite a higher valuation. Both present distinct analytical scenarios aligned to different investor profiles.
Disclaimer: Investment carries a risk of loss of initial capital. The past performance is not a reliable indicator of future results. Be sure to understand risks before making an investment decision.
Go Further
I encourage you to read the complete analyses of Cigna Corporation and Humana Inc. to enhance your investment decisions: