Home > Comparison > Consumer Defensive > UL vs CHD
The strategic rivalry between Unilever PLC and Church & Dwight Co., Inc. defines the current trajectory of the consumer defensive sector. Unilever operates as a global fast-moving consumer goods powerhouse with diverse beauty, food, and home care segments. Church & Dwight offers a focused portfolio of specialty household and personal care products, leveraging strong niche brands. This analysis will assess which company’s operational model presents a superior risk-adjusted return for diversified portfolios amid evolving market dynamics.
Table of contents
Companies Overview
Unilever PLC and Church & Dwight Co., Inc. are heavyweight players in the global household and personal products market. Both companies command significant market attention due to their diverse product portfolios and long operational histories.
Unilever PLC: Global Consumer Goods Powerhouse
Unilever PLC stands as a fast-moving consumer goods giant, generating revenue through its Beauty & Personal Care, Foods & Refreshment, and Home Care segments. Its competitive edge lies in iconic brands like Dove, Knorr, and Ben & Jerry’s. In 2026, Unilever’s strategic focus continues on expanding sustainable product lines and innovation to capture evolving consumer preferences globally.
Church & Dwight Co., Inc.: Specialty and Consumer Products Innovator
Church & Dwight operates as a specialized consumer products manufacturer, driving revenue from household and personal care brands such as ARM & HAMMER, OXICLEAN, and TROJAN. The company emphasizes niche market penetration and innovation within specialty products. Its 2026 strategy centers on bolstering e-commerce channels while maintaining strong retail partnerships across domestic and international markets.
Strategic Collision: Similarities & Divergences
Both firms prioritize consumer product diversification but diverge in scope and scale. Unilever leverages a broad global footprint with a wide brand portfolio, while Church & Dwight focuses on specialized products with targeted innovation. Their primary battleground is market share in household essentials and personal care categories. Unilever offers a large-cap, globally diversified profile; Church & Dwight provides a leaner, specialty-focused investment appeal.
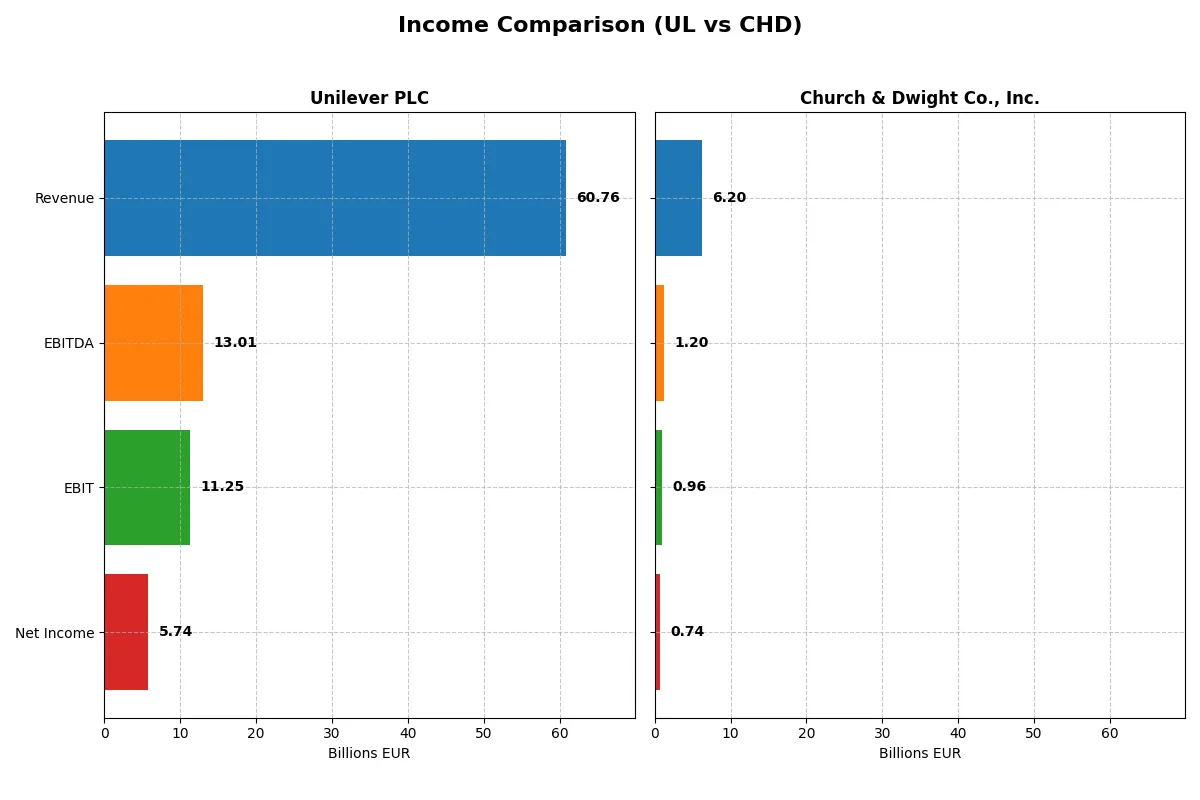
Income Statement Comparison
This data dissects the core profitability and scalability of both corporate engines to reveal who dominates the bottom line:
| Metric | Unilever PLC (UL) | Church & Dwight Co., Inc. (CHD) |
|---|---|---|
| Revenue | 60.8B EUR | 6.20B USD |
| Cost of Revenue | 0 EUR | 3.43B USD |
| Operating Expenses | 51.4B EUR | 1.70B USD |
| Gross Profit | 60.8B EUR | 2.77B USD |
| EBITDA | 13.0B EUR | 1.20B USD |
| EBIT | 11.3B EUR | 957M USD |
| Interest Expense | 1.12B EUR | 0 USD |
| Net Income | 5.74B EUR | 737M USD |
| EPS | 2.30 EUR | 3.04 USD |
| Fiscal Year | 2024 | 2025 |
Income Statement Analysis: The Bottom-Line Duel
This income statement comparison reveals which company optimizes revenue and margins to power sustainable profitability.
Unilever PLC Analysis
Unilever’s revenue grew steadily from 50.7B EUR in 2020 to 60.8B EUR in 2024, reflecting a 19.8% increase over five years. Net income showed modest growth but dipped recently to 5.7B EUR. The firm maintains a robust 100% gross margin in 2024, though net margin contracted to 9.45%. Efficiency improved with EBIT margin rising to 18.5%, signaling strong operational leverage despite margin pressures.
Church & Dwight Co., Inc. Analysis
Church & Dwight’s revenue expanded from 5.2B USD in 2021 to 6.2B USD in 2025, a 19.5% rise. Net income, however, declined over the period, reaching 737M USD in 2025. The company posted a solid 44.7% gross margin and an improving net margin of 11.9%. EBIT margin increased to 15.4%, complemented by a notable EPS growth of 27.4% in the last year, underscoring recent operational momentum.
Margin Strength vs. Earnings Momentum
Unilever leverages superior gross and EBIT margins, reflecting operational efficiency at scale. Church & Dwight shows stronger recent EPS and net margin growth but trails in absolute earnings size. Unilever’s scale and margin power dominate fundamentals, while Church & Dwight’s momentum suits investors focused on earnings acceleration.
Financial Ratios Comparison
These vital ratios act as a diagnostic tool to expose the underlying fiscal health, valuation premiums, and capital efficiency of the companies compared below:
| Ratios | Unilever PLC (UL) | Church & Dwight Co., Inc. (CHD) |
|---|---|---|
| ROE | 28.7% | 18.4% |
| ROIC | 11.1% | 11.2% |
| P/E | 26.9 | 27.6 |
| P/B | 7.7 | 5.1 |
| Current Ratio | 0.76 | 1.07 |
| Quick Ratio | 0.56 | 0.71 |
| D/E | 1.53 | 0.55 |
| Debt-to-Assets | 38.4% | 24.7% |
| Interest Coverage | 8.4 | 0 (not reported) |
| Asset Turnover | 0.76 | 0.70 |
| Fixed Asset Turnover | 5.21 | 7.54 |
| Payout ratio | 75.2% | 38.9% |
| Dividend yield | 2.79% | 1.41% |
| Fiscal Year | 2024 | 2025 |
Efficiency & Valuation Duel: The Vital Signs
Financial ratios serve as a company’s DNA, exposing hidden risks and operational strengths that drive investor decisions.
Unilever PLC
Unilever posts a strong 28.7% ROE and a healthy 11.1% ROIC, signaling robust profitability. However, its P/E of 26.9 and P/B of 7.7 mark the stock as stretched compared to industry norms. The firm rewards shareholders with a 2.79% dividend yield, reflecting steady income amid limited R&D reinvestment.
Church & Dwight Co., Inc.
Church & Dwight delivers a solid 18.4% ROE and a 11.2% ROIC, demonstrating efficient capital use. Its P/E of 27.6 suggests the stock is expensive but less so on a P/B of 5.1. The company maintains modest shareholder returns with a 1.41% dividend yield, balancing income with ongoing growth investments.
Premium Valuation vs. Operational Efficiency
Both companies show slightly favorable financial profiles, but Unilever’s higher profitability and dividend yield come with greater valuation risk. Church & Dwight offers a more balanced risk-reward with efficient capital use and moderate valuation. Income-focused investors may prefer Unilever’s yield, while growth seekers might lean toward Church & Dwight’s reinvestment profile.
Which one offers the Superior Shareholder Reward?
I compare Unilever PLC (UL) and Church & Dwight Co., Inc. (CHD) on dividends, payout ratios, and buybacks. UL yields 2.8% with a high 75% payout, supported by stable free cash flow (3.1B). CHD yields 1.4% but retains more earnings with a 39% payout, fueling robust buybacks and reinvestment. UL’s distribution is generous but risks sustainability due to heavy leverage (debt/equity 1.53). CHD’s moderate payout and strong free cash flow (4.5B) underpin a balanced capital return and growth model. I find CHD’s disciplined payout plus buybacks offer a more sustainable, superior total return in 2026.
Comparative Score Analysis: The Strategic Profile
The radar chart reveals the fundamental DNA and trade-offs of Unilever PLC and Church & Dwight Co., Inc., highlighting their distinct financial strengths and weaknesses:
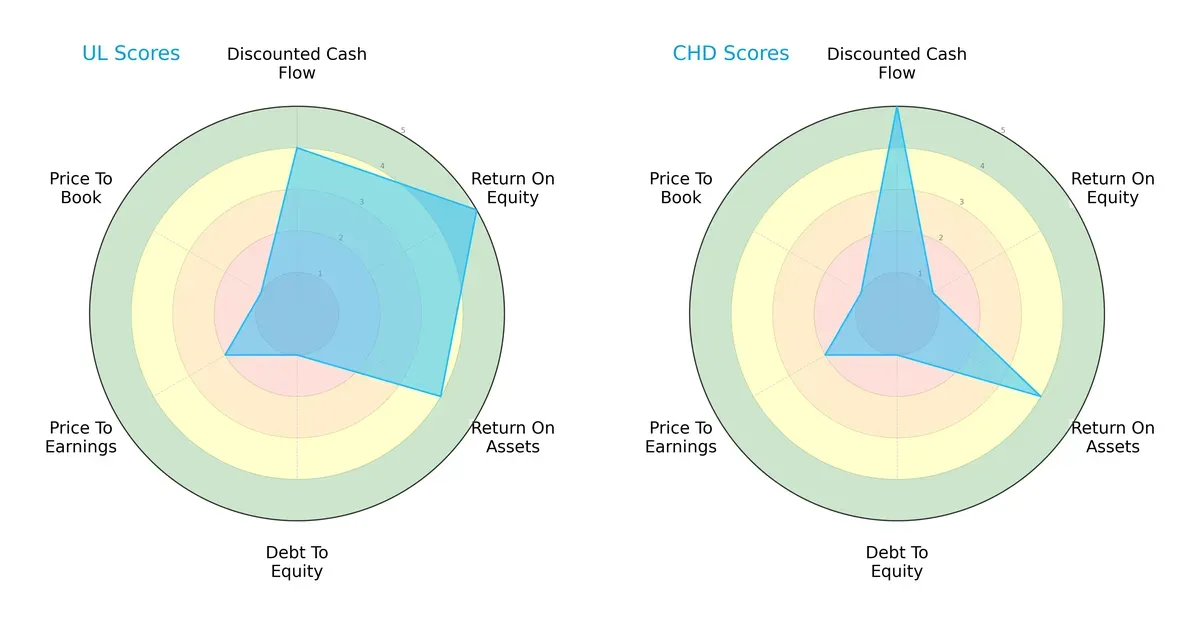
Unilever shows a balanced profile with strong ROE (5) and ROA (4) scores, indicating efficient profitability and asset utilization. Church & Dwight leads on discounted cash flow (5), signaling undervaluation potential, but suffers from very weak ROE (1), exposing profit generation issues. Both firms share weak debt-to-equity (1) and valuation scores (P/E 2, P/B 1), reflecting financial risk and market skepticism. Overall, Unilever’s diversified strengths outweigh Church & Dwight’s reliance on DCF alone.
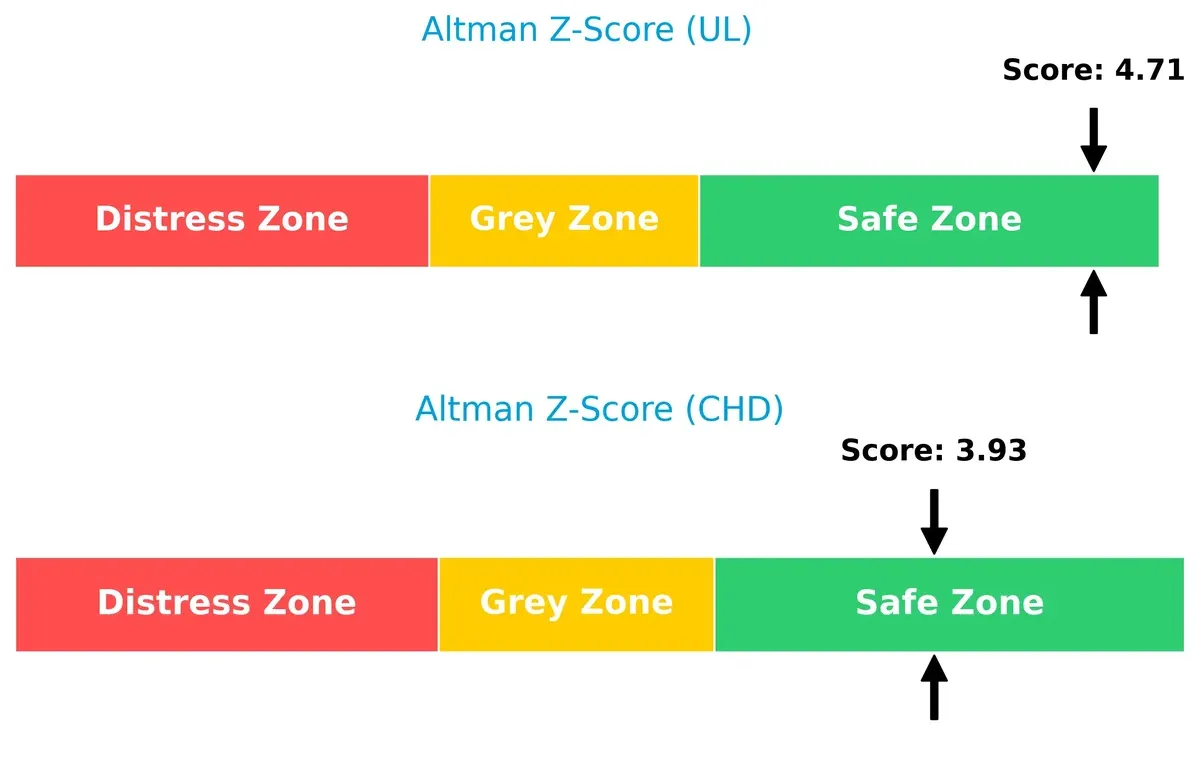
Bankruptcy Risk: Solvency Showdown
Unilever’s Altman Z-score of 4.71 surpasses Church & Dwight’s 3.93, placing both firms safely above distress thresholds but affirming Unilever’s stronger solvency in this cycle:
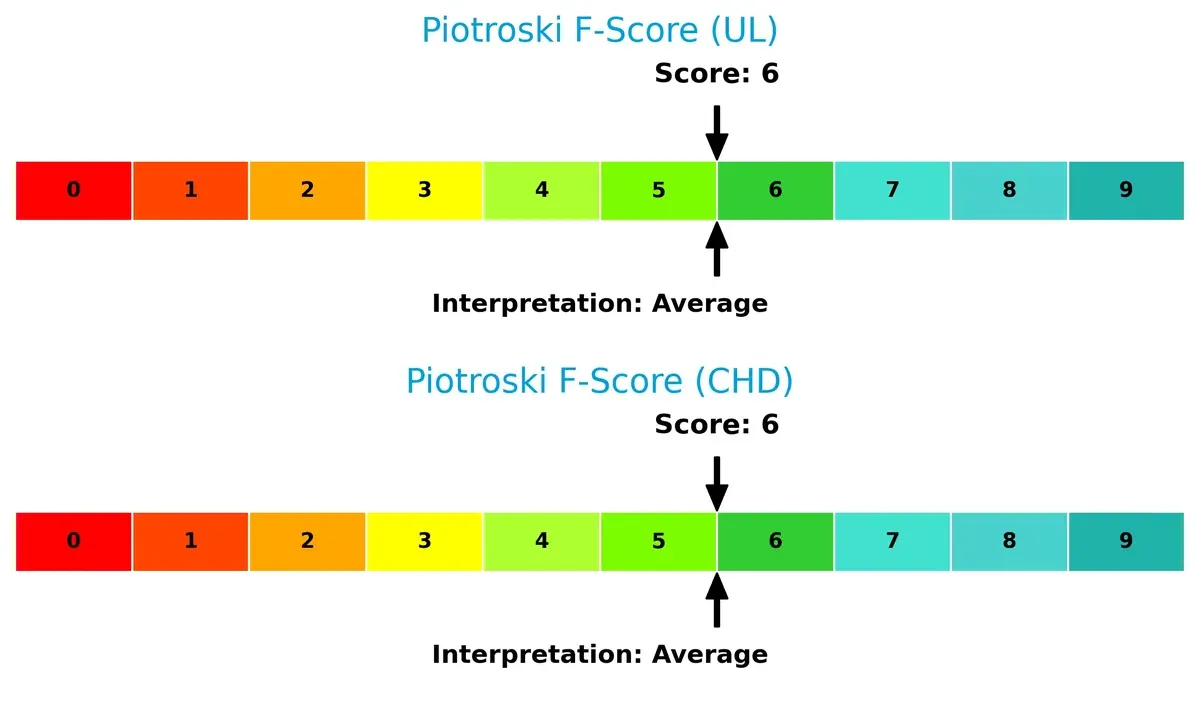
Financial Health: Quality of Operations
Both companies share an identical Piotroski F-score of 6, indicating average financial health with no immediate red flags but room for improvement in operational quality:
How are the two companies positioned?
This section dissects Unilever and Church & Dwight’s operational DNA by comparing their revenue distribution and internal strengths and weaknesses. The goal is to confront their economic moats and reveal which model delivers the most resilient competitive advantage today.
Revenue Segmentation: The Strategic Mix
This visual comparison dissects how Unilever PLC and Church & Dwight Co., Inc. diversify their income streams and where their primary sector bets lie:
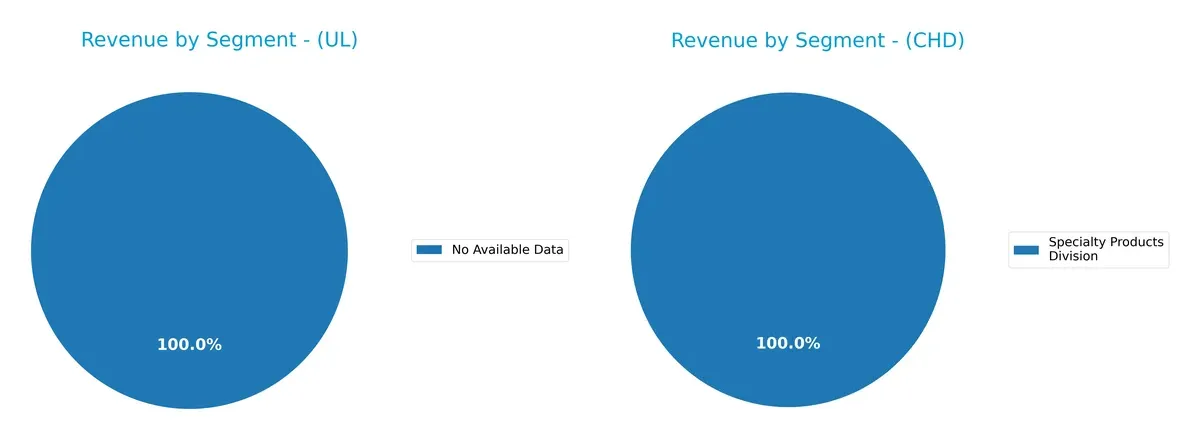
Unilever’s revenue segmentation data is unavailable, preventing a direct diversification comparison. Church & Dwight relies heavily on its Specialty Products Division, consistently generating around $300M annually. This concentration signals a focused strategy but poses concentration risk without a broader ecosystem or product mix. Investors should watch for potential volatility from this single-segment dependency, unlike diversified peers that better hedge sector-specific downturns.
Strengths and Weaknesses Comparison
This table compares the Strengths and Weaknesses of Unilever PLC and Church & Dwight Co., Inc.:
Unilever PLC Strengths
- Strong global presence with diversified revenue across Americas, Asia Pacific, Europe, and Latin America
- Favorable ROE (28.73%) and ROIC (11.12%) above WACC (4.46%)
- High interest coverage (10.06) and fixed asset turnover (5.21)
- Solid dividend yield (2.79%) supports income investors
Church & Dwight Co., Inc. Strengths
- Favorable net margin (11.88%) and ROIC (11.19%) slightly above WACC (5.7%)
- Lower debt-to-assets ratio (24.74%) signals prudent leverage
- Infinite interest coverage indicates strong earnings relative to interest expense
- High fixed asset turnover (7.54) shows operational efficiency
Unilever PLC Weaknesses
- Low current (0.76) and quick ratios (0.56) indicate liquidity concerns
- High debt-to-equity (1.53) ratio raises financial risk
- Unfavorable valuation multiples: P/E (26.93) and P/B (7.74)
- Neutral net margin (9.45%) limits profitability upside
Church & Dwight Co., Inc. Weaknesses
- Unfavorable P/E (27.62) and P/B (5.08) valuations may limit upside
- Quick ratio (0.71) below 1 signals potential liquidity pressure
- Moderate ROE (18.41%) lower than Unilever’s, suggesting less equity efficiency
- Narrow product segmentation with reliance on Specialty Products division
Unilever’s broad geographic diversification and strong capital returns contrast with Church & Dwight’s operational efficiency and lower leverage. Both face valuation and liquidity challenges, influencing their strategic focus on financial stability and growth.
The Moat Duel: Analyzing Competitive Defensibility
A structural moat is the only reliable shield protecting long-term profits from relentless competitive erosion. Let’s dissect the core moats of Unilever and Church & Dwight:
Unilever PLC: Intangible Assets Powerhouse
Unilever’s moat stems from its iconic brand portfolio and global scale, sustaining high ROIC near 7%. Margin stability signals pricing power despite slowing revenue growth. New product innovation in emerging markets will test this moat in 2026.
Church & Dwight Co., Inc.: Cost Advantage Specialist
Church & Dwight’s competitive edge lies in cost-effective operations and niche product dominance, creating steady ROIC above 5%. Compared to Unilever, it operates leaner with sharper margin expansion potential. Expansion into specialty health segments could deepen its moat.
Brand Equity vs. Operational Efficiency: Who Defends Better?
Both firms create value with ROIC above WACC, yet Unilever’s intangible asset moat is wider. Church & Dwight’s cost advantage is narrower but more agile. I see Unilever better equipped to defend market share long term given its global brand dominance.
Which stock offers better returns?
Over the past 12 months, Unilever PLC’s shares rose significantly, while Church & Dwight Co., Inc. faced a notable decline, exhibiting contrasting trading dynamics and recent shifts in momentum.
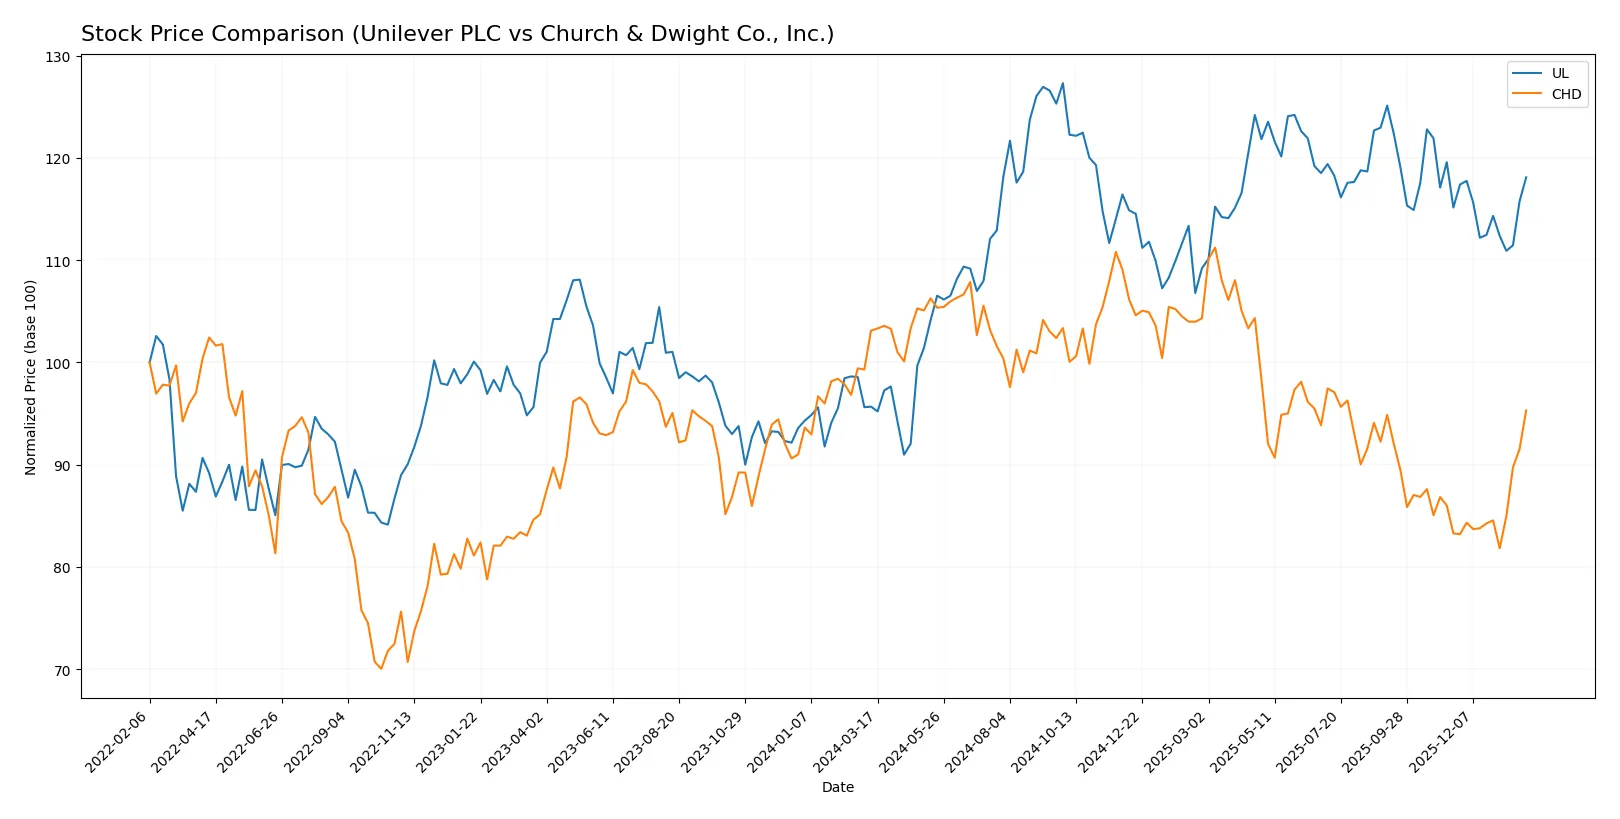
Trend Comparison
Unilever PLC shows a bullish trend with a 23.44% gain over the past year, though its upward momentum is decelerating. Price ranged between 52.66 and 73.69, with moderate volatility (4.65%).
Church & Dwight Co., Inc. experienced a bearish trend with a 7.56% drop over the same period, but recent months reveal accelerating recovery and a 14.45% gain, alongside higher volatility (7.84%).
Unilever outperformed Church & Dwight overall, delivering the highest market return despite decelerating momentum; Church & Dwight’s recent gains suggest potential trend reversal.
Target Prices
Analyst consensus suggests moderate upside potential for both Unilever PLC and Church & Dwight Co., Inc.
| Company | Target Low | Target High | Consensus |
|---|---|---|---|
| Unilever PLC | 60.1 | 71 | 65.55 |
| Church & Dwight Co., Inc. | 82 | 102 | 96.25 |
Unilever’s target consensus (65.55) sits slightly below its current price (68.36), indicating limited upside. Church & Dwight’s consensus matches its current price (96.25), reflecting a balanced risk-reward outlook.

Don’t Let Luck Decide Your Entry Point
Optimize your entry points with our advanced ProRealTime indicators. You’ll get efficient buy signals with precise price targets for maximum performance. Start outperforming now!
How do institutions grade them?
Here is a comparison of recent grades assigned to Unilever PLC and Church & Dwight Co., Inc. by various reputable institutions:
Unilever PLC Grades
The following table summarizes recent grading actions on Unilever PLC by recognized financial institutions.
| Grading Company | Action | New Grade | Date |
|---|---|---|---|
| Erste Group | Downgrade | Hold | 2024-11-19 |
| B of A Securities | Upgrade | Buy | 2024-08-22 |
| JP Morgan | Upgrade | Overweight | 2024-05-23 |
| Argus Research | Maintain | Buy | 2024-05-08 |
| Morgan Stanley | Downgrade | Underweight | 2024-02-27 |
| Bernstein | Upgrade | Market Perform | 2022-03-14 |
| Deutsche Bank | Downgrade | Hold | 2021-09-16 |
Church & Dwight Co., Inc. Grades
Below is a summary of recent grades for Church & Dwight Co., Inc. from established grading companies.
| Grading Company | Action | New Grade | Date |
|---|---|---|---|
| Jefferies | Maintain | Buy | 2026-01-28 |
| UBS | Maintain | Neutral | 2026-01-14 |
| TD Cowen | Maintain | Hold | 2026-01-08 |
| Wells Fargo | Maintain | Overweight | 2026-01-05 |
| Raymond James | Upgrade | Outperform | 2026-01-05 |
| Jefferies | Upgrade | Buy | 2025-12-17 |
| Citigroup | Upgrade | Neutral | 2025-12-17 |
| Deutsche Bank | Maintain | Buy | 2025-12-10 |
| Argus Research | Maintain | Buy | 2025-12-04 |
| Barclays | Maintain | Underweight | 2025-11-04 |
Which company has the best grades?
Church & Dwight Co., Inc. holds consistently positive grades, including multiple Buy and Outperform ratings recently. Unilever PLC’s grades are mixed, with notable downgrades and Hold opinions. Investors may view Church & Dwight’s stronger consensus grades as a sign of greater current institutional confidence.
Risks specific to each company
The following categories identify the critical pressure points and systemic threats facing both firms in the 2026 market environment:
1. Market & Competition
Unilever PLC
- Operates globally with strong brand portfolio but faces intense competition and shifting consumer preferences.
Church & Dwight Co., Inc.
- More niche product focus with strong US presence; competition from large FMCG players and private labels is significant.
2. Capital Structure & Debt
Unilever PLC
- High debt-to-equity ratio (1.53) signals leverage risk despite favorable interest coverage.
Church & Dwight Co., Inc.
- Moderate leverage with debt-to-equity at 0.55; financial risk is lower and interest coverage is excellent.
3. Stock Volatility
Unilever PLC
- Low beta (0.22) indicates defensiveness and lower volatility relative to the market.
Church & Dwight Co., Inc.
- Higher beta (0.46) suggests greater price swings and sensitivity to market moves.
4. Regulatory & Legal
Unilever PLC
- Exposure to global regulations and sustainability mandates adds compliance complexity.
Church & Dwight Co., Inc.
- Primarily US-focused regulatory environment, but rising scrutiny on product safety and labeling is a concern.
5. Supply Chain & Operations
Unilever PLC
- Global supply chains face risks from inflation, geopolitical tensions, and raw material costs.
Church & Dwight Co., Inc.
- Smaller scale supply chain but vulnerable to US-centric disruptions and input cost inflation.
6. ESG & Climate Transition
Unilever PLC
- Strong ESG commitments but faces pressure to meet aggressive carbon neutrality and sustainability targets.
Church & Dwight Co., Inc.
- ESG initiatives evolving; lagging behind peers in climate transition efforts.
7. Geopolitical Exposure
Unilever PLC
- Significant exposure to emerging markets and currency risks amid global geopolitical instability.
Church & Dwight Co., Inc.
- Concentrated US operations reduce geopolitical complexity but limit growth opportunities abroad.
Which company shows a better risk-adjusted profile?
Unilever’s most impactful risk is its high leverage, which strains liquidity despite strong earnings. Church & Dwight’s primary risk lies in greater stock volatility and limited geographic diversification. I see Church & Dwight offering a better risk-adjusted profile due to lower financial risk and solid operational footing, despite higher beta. Recent data shows Unilever’s current ratio at 0.76, flagging short-term liquidity concerns, validating caution on its capital structure.
Final Verdict: Which stock to choose?
Unilever’s superpower lies in its robust capital efficiency and strong profitability, consistently generating returns well above its cost of capital. However, its low liquidity ratios warrant careful monitoring as a point of vigilance. It suits investors targeting steady value creation within a diversified, income-oriented portfolio.
Church & Dwight commands a durable strategic moat through its leaner balance sheet and superior margin expansion, supported by a solid recurring revenue base. Compared to Unilever, it offers a cleaner financial profile with less leverage, making it appealing for those seeking balanced growth with moderated risk.
If you prioritize capital efficiency and dividend income, Unilever is the compelling choice due to its ability to create shareholder value despite some liquidity concerns. However, if you seek a financially disciplined company with a cleaner balance sheet and growth potential, Church & Dwight offers better stability and a more attractive risk-reward profile. Both present slightly favorable moats with declining profitability trends, underscoring the need for vigilant monitoring.
Disclaimer: Investment carries a risk of loss of initial capital. The past performance is not a reliable indicator of future results. Be sure to understand risks before making an investment decision.
Go Further
I encourage you to read the complete analyses of Unilever PLC and Church & Dwight Co., Inc. to enhance your investment decisions: