Home > Comparison > Consumer Defensive > PG vs CHD
The strategic rivalry between The Procter & Gamble Company and Church & Dwight Co., Inc. shapes the Household & Personal Products industry landscape. P&G operates as a global consumer defensive behemoth with a diversified portfolio, while Church & Dwight focuses on niche specialty products with a leaner operational footprint. This head-to-head highlights a classic contest between scale-driven dominance and focused innovation. This analysis aims to identify which trajectory offers superior risk-adjusted returns for a diversified portfolio.
Table of contents
Companies Overview
The Procter & Gamble Company and Church & Dwight Co., Inc. dominate the household and personal products market with distinct scale and strategy.
The Procter & Gamble Company: Global Consumer Goods Giant
P&G leads as a global powerhouse in branded consumer packaged goods. Its core revenue streams flow from five diverse segments, including Beauty and Fabric & Home Care. In 2026, the company prioritizes innovation and expanding digital sales channels to reinforce its competitive advantage across mass merchandisers and e-commerce platforms.
Church & Dwight Co., Inc.: Specialty Products Innovator
Church & Dwight specializes in household and personal care products with a strong focus on niche brands like ARM & HAMMER and OXICLEAN. Its revenue engine relies on diversified consumer and specialty product segments, targeting both retail and industrial channels. In 2026, the company emphasizes expanding its specialty product division and bolstering e-commerce presence.
Strategic Collision: Similarities & Divergences
Both firms compete fiercely in the consumer staples sector but adopt contrasting philosophies. P&G leverages a broad portfolio and global scale, while Church & Dwight focuses on specialized brands and innovation within niche markets. Their primary battleground is market penetration through retail and digital channels. Investors face distinct profiles: P&G offers stability from scale; Church & Dwight delivers growth potential via specialization.
Income Statement Comparison
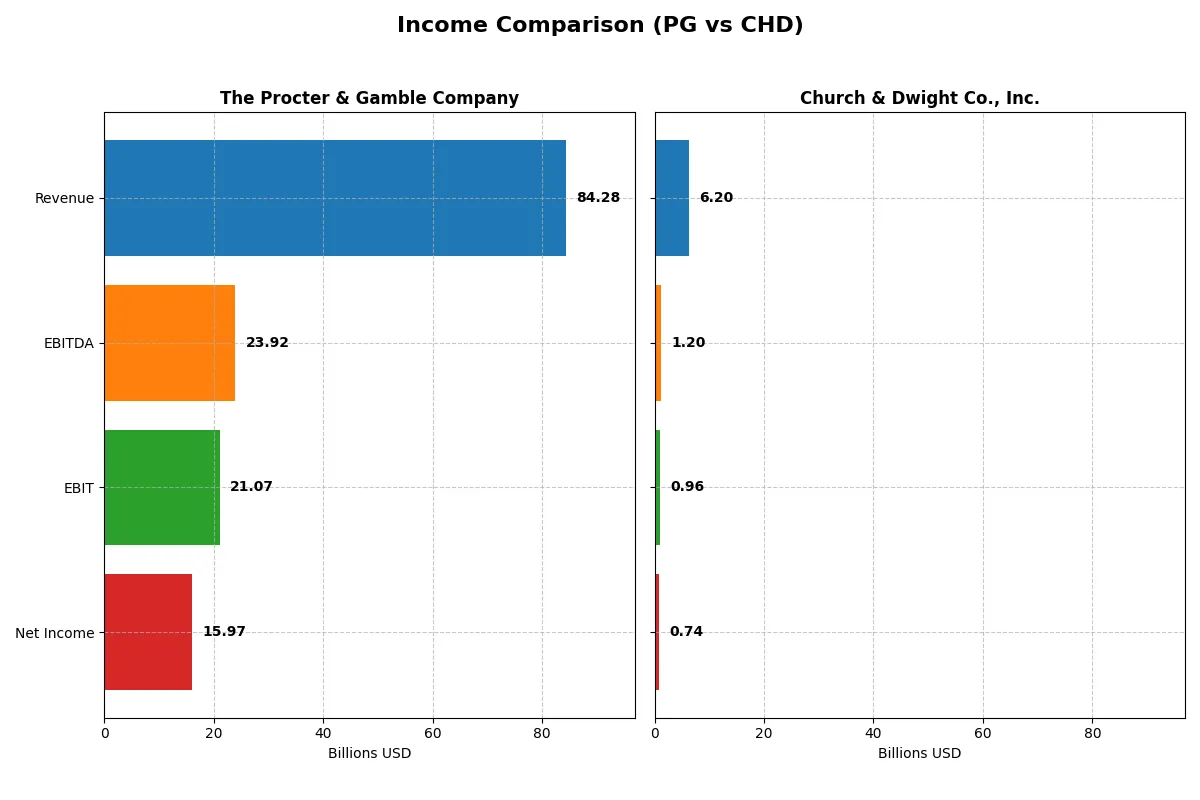
This data dissects the core profitability and scalability of both corporate engines to reveal who dominates the bottom line:
| Metric | The Procter & Gamble Company (PG) | Church & Dwight Co., Inc. (CHD) |
|---|---|---|
| Revenue | 84.3B | 6.2B |
| Cost of Revenue | 41.2B | 3.4B |
| Operating Expenses | 22.7B | 1.7B |
| Gross Profit | 43.1B | 2.8B |
| EBITDA | 23.9B | 1.2B |
| EBIT | 21.1B | 957M |
| Interest Expense | 907M | 0 |
| Net Income | 16.0B | 737M |
| EPS | 6.67 | 3.04 |
| Fiscal Year | 2025 | 2025 |
Income Statement Analysis: The Bottom-Line Duel
This income statement comparison reveals which company drives greater efficiency and value through its core operations and profitability trends.
The Procter & Gamble Company Analysis
Procter & Gamble’s revenue steadily climbs, reaching $84.3B in 2025, while net income grows to $16B. It sustains a robust gross margin above 51%, reflecting strong pricing power. Net margin at nearly 19% improves year-over-year, signaling enhanced cost control and operational efficiency. The company’s rising EBIT and EPS underscore solid momentum.
Church & Dwight Co., Inc. Analysis
Church & Dwight’s revenue advances modestly to $6.2B in 2025, with net income at $737M. Gross margin holds near 45%, showing decent product profitability. Net margin expands significantly to 11.9%, driven by better expense management. Despite smaller scale, the company reports strong EBIT growth and a sharp EPS increase, reflecting improving operational leverage.
Margin Strength vs. Scale Dominance
Procter & Gamble outpaces Church & Dwight in absolute profits and margin consistency, leveraging scale with a 25% EBIT margin. Church & Dwight shows impressive margin expansion and EPS growth but from a smaller base. For investors, P&G offers stability and scale, while Church & Dwight presents a compelling growth trajectory in profitability.
Financial Ratios Comparison
These vital ratios act as a diagnostic tool to expose the underlying fiscal health, valuation premiums, and capital efficiency of the companies compared below:
| Ratios | The Procter & Gamble Company (PG) | Church & Dwight Co., Inc. (CHD) |
|---|---|---|
| ROE | 30.7% | 18.4% |
| ROIC | 16.5% | 11.2% |
| P/E | 24.5 | 27.6 |
| P/B | 7.52 | 5.08 |
| Current Ratio | 0.70 | 1.07 |
| Quick Ratio | 0.49 | 0.71 |
| D/E | 0.68 | 0.55 |
| Debt-to-Assets | 28.3% | 24.7% |
| Interest Coverage | 22.5 | 0 |
| Asset Turnover | 0.67 | 0.70 |
| Fixed Asset Turnover | 3.53 | 7.54 |
| Payout ratio | 61.8% | 39.0% |
| Dividend yield | 2.52% | 1.41% |
| Fiscal Year | 2025 | 2025 |
Efficiency & Valuation Duel: The Vital Signs
Financial ratios serve as a company’s DNA, revealing hidden risks and operational excellence beneath surface-level performance.
The Procter & Gamble Company
P&G delivers strong profitability with a 30.7% ROE and a healthy 18.95% net margin, signaling operational efficiency. Its P/E of 24.48 is fairly valued, though the high P/B at 7.52 appears stretched. The 2.52% dividend yield rewards shareholders, reflecting a balanced capital return alongside prudent reinvestment.
Church & Dwight Co., Inc.
Church & Dwight posts solid but lower profitability, with an 18.4% ROE and 11.88% net margin. The stock looks expensive at a 27.62 P/E and a 5.08 P/B, suggesting valuation pressure. Dividend yield is modest at 1.41%, indicating limited immediate shareholder returns amid ongoing growth investments.
Premium Valuation vs. Operational Safety
P&G balances superior profitability and shareholder returns with reasonable valuation, offering a more stable risk-reward profile. Church & Dwight appears pricier with weaker margins, fitting investors willing to pay a premium for growth potential despite higher valuation risk.
Which one offers the Superior Shareholder Reward?
I find Procter & Gamble (PG) delivers a more robust shareholder reward compared to Church & Dwight (CHD). PG yields ~2.5% dividends with a high payout ratio near 62%, supported by strong free cash flow coverage (~80%). Its buyback intensity complements dividends, enhancing total returns sustainably. CHD offers a lower 1.4% yield with a modest 39% payout ratio but higher free cash flow conversion (~90%) and aggressive buybacks. However, PG’s balanced, well-covered distribution and consistent buyback scale signal superior long-term value creation in 2026.
Comparative Score Analysis: The Strategic Profile
The radar chart reveals the fundamental DNA and trade-offs of The Procter & Gamble Company and Church & Dwight Co., Inc., highlighting their financial strengths and weaknesses:
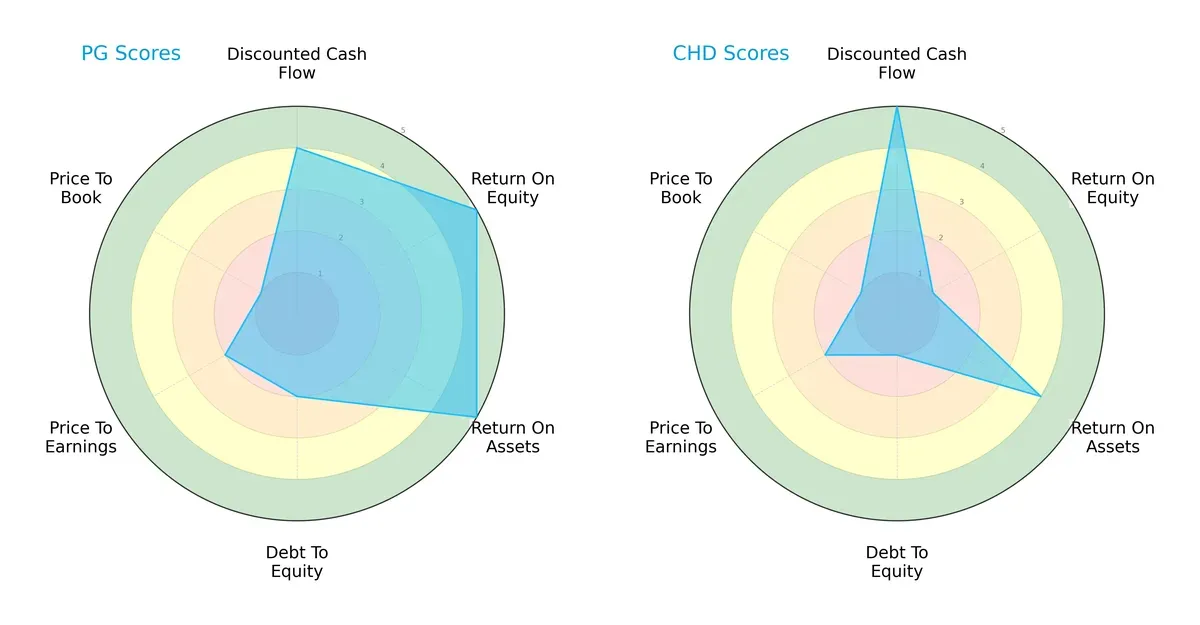
Procter & Gamble shows a balanced profile with strong returns (ROE 5, ROA 5) and solid DCF (4). However, it carries moderate leverage risk (Debt/Equity 2) and faces valuation concerns (P/B 1). Church & Dwight relies heavily on its DCF strength (5) but suffers from weak equity returns (ROE 1) and higher financial risk (Debt/Equity 1). Overall, Procter & Gamble offers a more stable and diversified financial foundation.
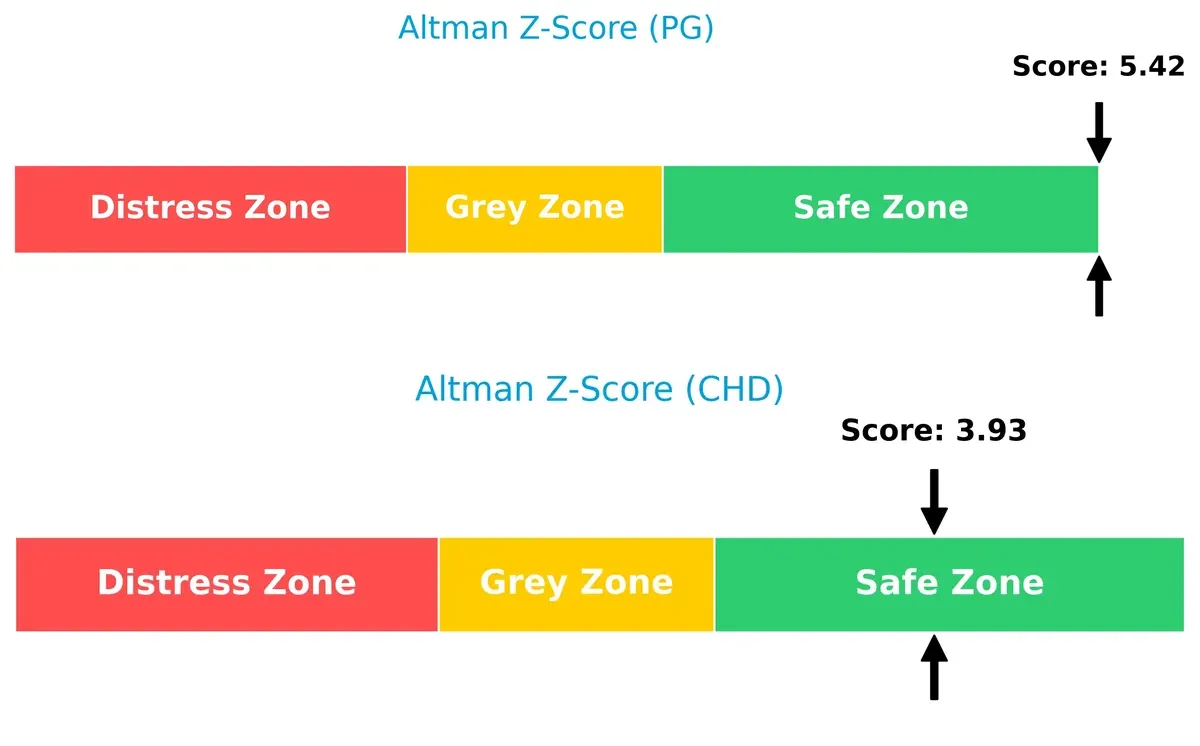
Bankruptcy Risk: Solvency Showdown
The Procter & Gamble’s Altman Z-Score at 5.42 comfortably exceeds Church & Dwight’s 3.93, both in the safe zone, indicating stronger long-term solvency for P&G in this cycle:
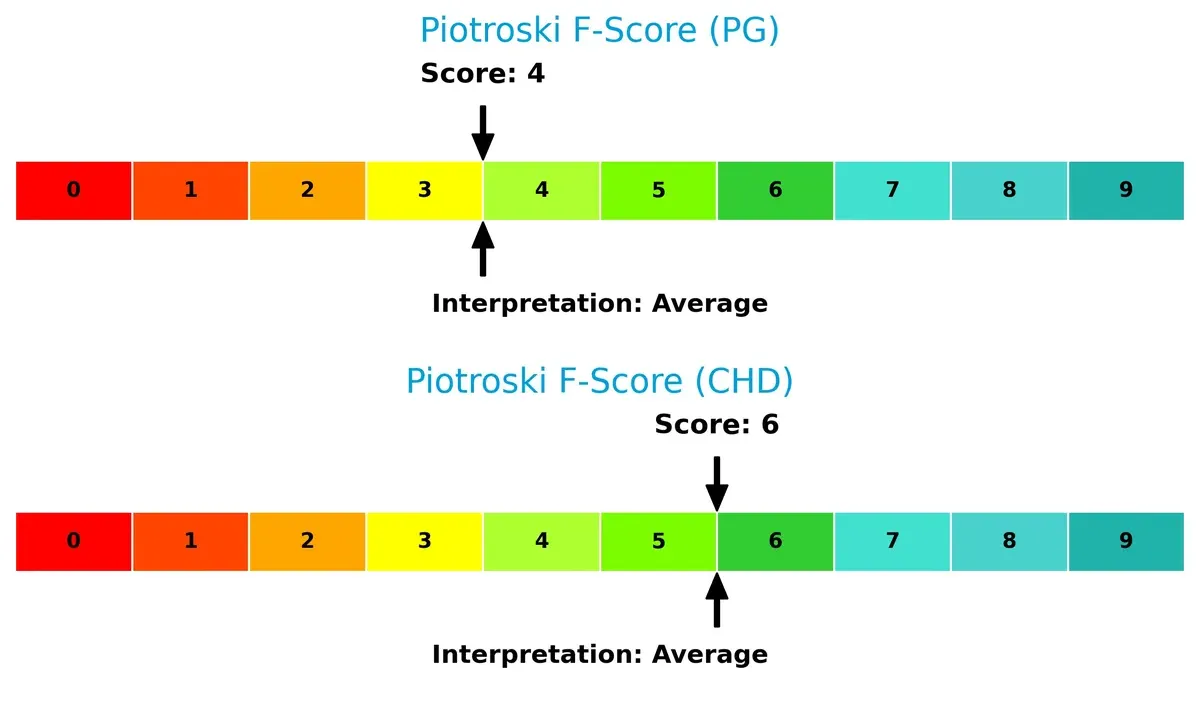
Financial Health: Quality of Operations
Church & Dwight’s Piotroski F-Score of 6 surpasses Procter & Gamble’s 4, suggesting better internal financial health and fewer operational red flags for CHD:
How are the two companies positioned?
This section dissects PG and CHD’s operational DNA by comparing revenue distribution by segment and analyzing their internal strengths and weaknesses. The goal is to confront their economic moats and identify which business model offers the most resilient competitive advantage today.
Revenue Segmentation: The Strategic Mix
This visual comparison dissects how The Procter & Gamble Company and Church & Dwight Co., Inc. diversify their income streams and where their primary sector bets lie:
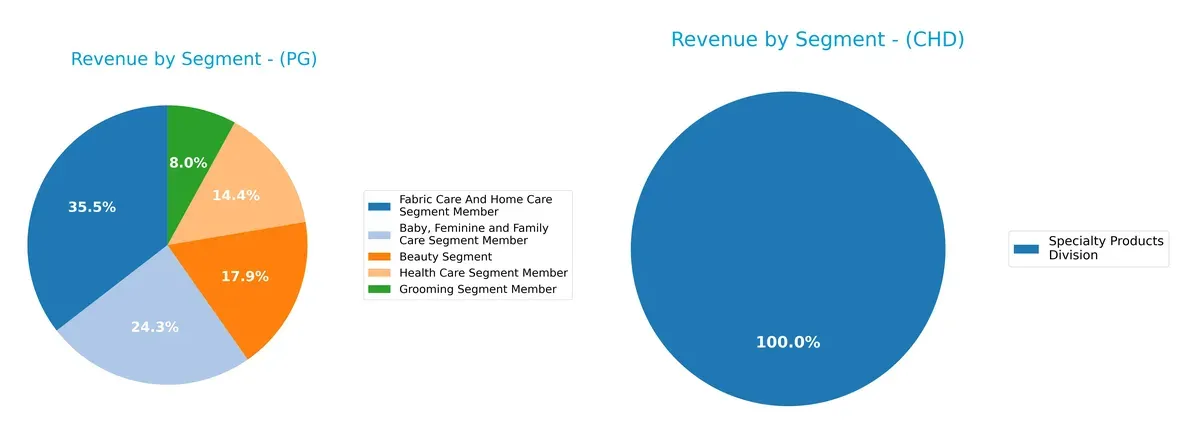
Procter & Gamble dominates with a broad portfolio, splitting roughly $29.6B in Fabric Care, $20.2B in Baby & Family Care, and $14.9B in Beauty. In contrast, Church & Dwight relies almost entirely on its Specialty Products Division, generating about $303M in 2024. P&G’s diversification reduces concentration risk and leverages strong ecosystem lock-in. Church & Dwight’s narrow focus increases vulnerability but may allow specialized market positioning.
Strengths and Weaknesses Comparison
This table compares the strengths and weaknesses of The Procter & Gamble Company (PG) and Church & Dwight Co., Inc. (CHD):
PG Strengths
- Diverse revenue across multiple segments
- Strong global presence with balanced US and Non-US sales
- High profitability metrics including ROE and ROIC
- Favorable interest coverage and dividend yield
- Efficient fixed asset turnover
CHD Strengths
- Favorable profitability with solid net margin and ROE
- Lower debt-to-assets ratio
- Strong fixed asset turnover
- Favorable interest coverage with no debt cost concerns
- Stable domestic and international revenue streams
PG Weaknesses
- Low current and quick ratios indicate liquidity concerns
- High price-to-book ratio suggests overvaluation risk
- Moderate debt-to-equity ratio
- Neutral asset turnover compared to peers
CHD Weaknesses
- Unfavorable price-to-earnings and price-to-book ratios
- Quick ratio below 1 signals liquidity risk
- Neutral debt-to-equity ratio
- Dividend yield is neutral, less attractive to income investors
Overall, PG shows a broad diversification and strong profitability but faces liquidity and valuation challenges. CHD demonstrates solid profitability and conservative leverage but has weaker valuation metrics and liquidity ratios. These contrasts reflect different strategic focuses and capital structures.
The Moat Duel: Analyzing Competitive Defensibility
A structural moat is the only reliable shield preserving long-term profits from relentless competitive erosion. Let’s dissect the moats of two major players:
The Procter & Gamble Company: Intangible Asset Powerhouse
P&G’s moat stems from its vast portfolio of trusted consumer brands, reflected in a strong 25% EBIT margin and stable profitability. In 2026, innovation in premium personal care and global market expansion could deepen its brand dominance.
Church & Dwight Co., Inc.: Niche Cost and Specialty Focus
Church & Dwight relies on a cost advantage and specialty product niches, supporting a respectable 15.4% EBIT margin but a shrinking ROIC trend. Growth in health and specialty segments offers potential, yet it faces profitability pressure unlike P&G’s stable trajectory.
Brand Equity vs. Specialty Cost Advantage: Who Defends Better?
P&G’s wider, more durable moat outpaces Church & Dwight’s narrower, declining profitability moat. P&G’s rising ROIC and diversified global reach better arm it to defend market share amid intensifying competition.
Which stock offers better returns?
Over the past 12 months, both stocks trended downward overall but showed notable recent rebounds with distinct buyer dominance and accelerating price momentum.
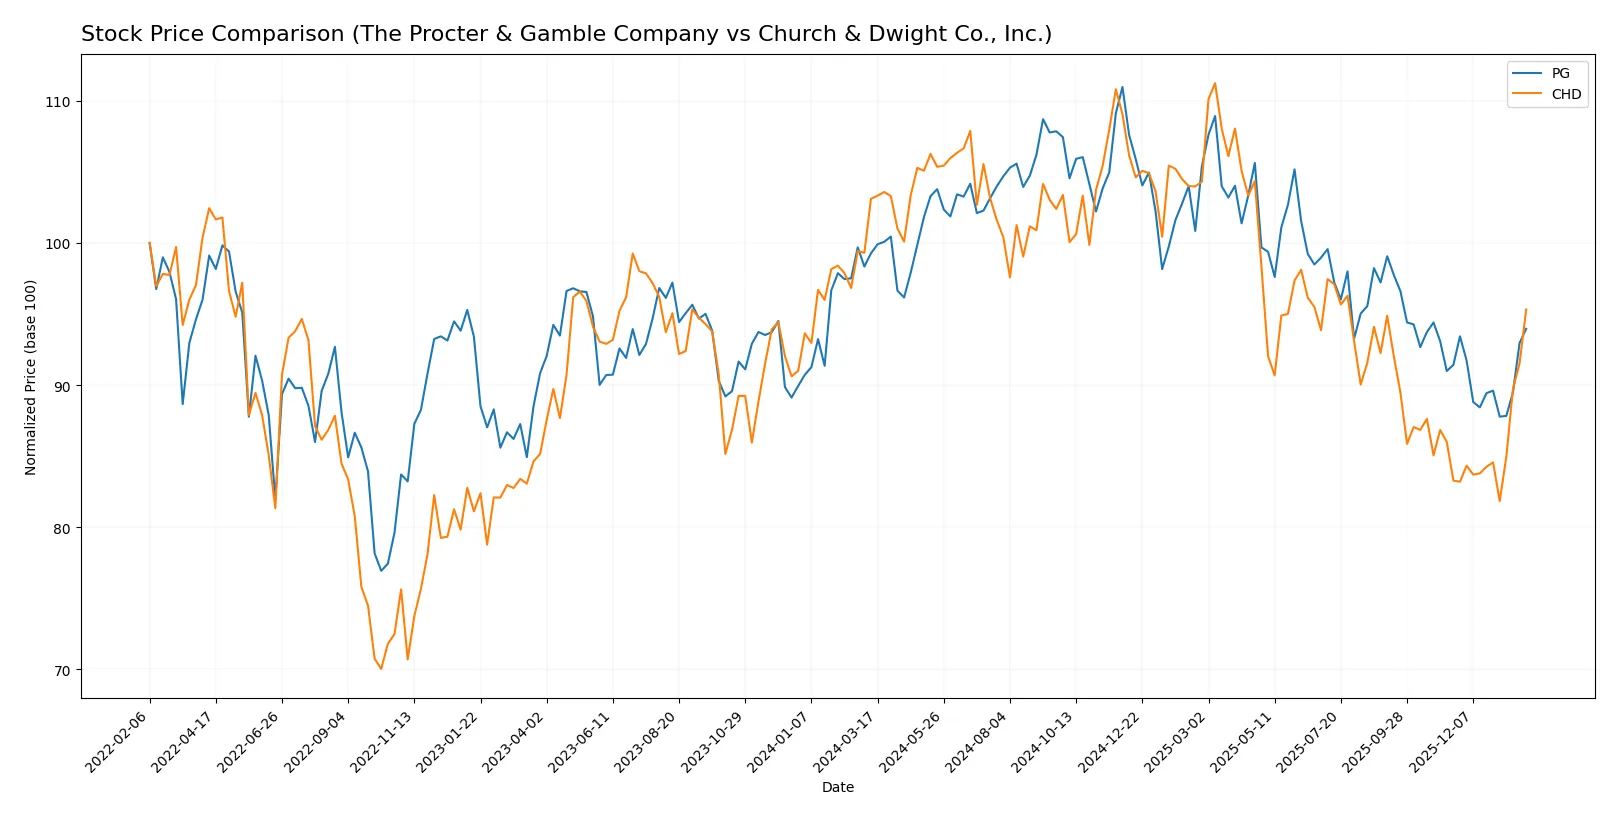
Trend Comparison
The Procter & Gamble Company’s stock fell 5.35% over 12 months, marking a bearish trend with accelerating decline. Recently, it reversed with a 2.78% gain and increased buyer dominance.
Church & Dwight Co., Inc. declined 7.56% over the year, also bearish with accelerating losses. Its recent surge reached 14.45%, reflecting strong buyer dominance and sharp upward momentum.
Church & Dwight’s stock posted the highest market performance recently, outperforming Procter & Gamble in recovery speed and price appreciation.
Target Prices
Analysts present a constructive consensus for both Procter & Gamble and Church & Dwight.
| Company | Target Low | Target High | Consensus |
|---|---|---|---|
| The Procter & Gamble Company | 150 | 179 | 165.67 |
| Church & Dwight Co., Inc. | 82 | 102 | 96.25 |
The target consensus for P&G sits about 9% above its current price of 151.77, signaling modest upside. Church & Dwight’s consensus matches its current price exactly at 96.25, reflecting market equilibrium in expectations.

Don’t Let Luck Decide Your Entry Point
Optimize your entry points with our advanced ProRealTime indicators. You’ll get efficient buy signals with precise price targets for maximum performance. Start outperforming now!
How do institutions grade them?
The Procter & Gamble Company Grades
The following table summarizes recent grades from major institutions covering Procter & Gamble:
| Grading Company | Action | New Grade | Date |
|---|---|---|---|
| TD Cowen | Downgrade | Hold | 2026-01-27 |
| UBS | Maintain | Buy | 2026-01-23 |
| JP Morgan | Upgrade | Overweight | 2026-01-23 |
| Wells Fargo | Maintain | Overweight | 2026-01-23 |
| UBS | Maintain | Buy | 2026-01-14 |
| TD Cowen | Maintain | Buy | 2026-01-08 |
| Wells Fargo | Maintain | Overweight | 2026-01-05 |
| JP Morgan | Maintain | Neutral | 2025-12-18 |
| Jefferies | Upgrade | Buy | 2025-12-17 |
| JP Morgan | Maintain | Neutral | 2025-10-27 |
Church & Dwight Co., Inc. Grades
Recent institutional grades for Church & Dwight are listed below:
| Grading Company | Action | New Grade | Date |
|---|---|---|---|
| Jefferies | Maintain | Buy | 2026-01-28 |
| UBS | Maintain | Neutral | 2026-01-14 |
| TD Cowen | Maintain | Hold | 2026-01-08 |
| Wells Fargo | Maintain | Overweight | 2026-01-05 |
| Raymond James | Upgrade | Outperform | 2026-01-05 |
| Jefferies | Upgrade | Buy | 2025-12-17 |
| Citigroup | Upgrade | Neutral | 2025-12-17 |
| Deutsche Bank | Maintain | Buy | 2025-12-10 |
| Argus Research | Maintain | Buy | 2025-12-04 |
| Barclays | Maintain | Underweight | 2025-11-04 |
Which company has the best grades?
Procter & Gamble generally holds stronger grades, with multiple Buy and Overweight ratings from UBS, JP Morgan, and Wells Fargo. Church & Dwight shows a mixed profile including Buy, Outperform, and Neutral grades, but also maintains an Underweight rating from Barclays. Investors may interpret P&G’s consistent positive ratings as a sign of broader institutional confidence relative to Church & Dwight’s more varied outlook.
Risks specific to each company
The following categories identify the critical pressure points and systemic threats facing both firms in the 2026 market environment:
1. Market & Competition
The Procter & Gamble Company
- Dominates with a 354B market cap but faces intense global competition.
Church & Dwight Co., Inc.
- Smaller 23B market cap with niche specialization but limited scale advantages.
2. Capital Structure & Debt
The Procter & Gamble Company
- Moderate leverage with 0.68 debt/equity and strong interest coverage at 23.2x.
Church & Dwight Co., Inc.
- Slightly lower debt/equity at 0.55 but infinite interest coverage, signaling very low debt risk.
3. Stock Volatility
The Procter & Gamble Company
- Low beta at 0.39 indicates defensive stock with stable price movements.
Church & Dwight Co., Inc.
- Slightly higher beta of 0.46 suggests marginally more price volatility and risk.
4. Regulatory & Legal
The Procter & Gamble Company
- Global footprint exposes it to diverse regulatory regimes and compliance costs.
Church & Dwight Co., Inc.
- Smaller international presence reduces regulatory complexity but limits growth avenues.
5. Supply Chain & Operations
The Procter & Gamble Company
- Complex, global supply chains vulnerable to disruptions and cost inflation.
Church & Dwight Co., Inc.
- More focused supply chain may offer agility but less scale to absorb shocks.
6. ESG & Climate Transition
The Procter & Gamble Company
- Significant pressure to meet ESG goals due to size and scrutiny; ongoing transition costs.
Church & Dwight Co., Inc.
- Smaller entity faces similar pressures but with fewer resources to invest in ESG initiatives.
7. Geopolitical Exposure
The Procter & Gamble Company
- Broad international exposure increases geopolitical risk but diversifies markets.
Church & Dwight Co., Inc.
- Concentrated US-centric operations reduce geopolitical risk but limit diversification.
Which company shows a better risk-adjusted profile?
The Procter & Gamble’s key risk is its supply chain complexity amid global disruptions. Church & Dwight’s main vulnerability lies in limited scale and higher valuation multiples. PG’s larger scale and superior financial stability offer a more balanced risk-adjusted profile, despite operational risks. The low beta and strong interest coverage for PG justify my confidence in its defensive stance.
Final Verdict: Which stock to choose?
The Procter & Gamble Company’s superpower lies in its durable competitive advantage and consistent value creation, demonstrated by a very favorable moat and strong profitability. Its point of vigilance is the persistently low current ratio, which may pressure liquidity in turbulent times. It suits portfolios targeting steady, long-term growth with moderate risk tolerance.
Church & Dwight’s strategic moat centers on efficient capital use and strong free cash flow yield, supported by a slightly favorable moat despite a declining ROIC trend. It offers a somewhat safer liquidity profile than P&G and appeals to investors seeking growth at a reasonable price with a focus on cash flow stability.
If you prioritize durable competitive moats and proven profitability, P&G outshines as the compelling choice due to its robust capital efficiency and income quality. However, if you seek more recent growth momentum coupled with cash flow strength, Church & Dwight offers better stability and a potentially attractive risk-return profile for GARP investors.
Disclaimer: Investment carries a risk of loss of initial capital. The past performance is not a reliable indicator of future results. Be sure to understand risks before making an investment decision.
Go Further
I encourage you to read the complete analyses of The Procter & Gamble Company and Church & Dwight Co., Inc. to enhance your investment decisions: