Home > Comparison > Consumer Defensive > EL vs CHD
The strategic rivalry between The Estée Lauder Companies Inc. and Church & Dwight Co., Inc. shapes the competitive landscape of the household and personal products sector. Estée Lauder operates as a global premium cosmetics and skincare powerhouse, while Church & Dwight emphasizes diversified, mass-market household and specialty products. This analysis examines their contrasting operational models and growth strategies to determine which offers superior risk-adjusted returns for a well-diversified portfolio.

Table of contents
Companies Overview
The Estée Lauder Companies Inc. and Church & Dwight Co., Inc. shape the competitive landscape of the household and personal products sector.
The Estée Lauder Companies Inc.: Global Prestige Skincare and Cosmetics Leader
The Estée Lauder Companies Inc. dominates the premium beauty market by manufacturing and marketing skin care, makeup, fragrance, and hair care products worldwide. Its core revenue stems from a diverse brand portfolio including Clinique, MAC, and La Mer. In 2026, the company’s strategic focus centers on expanding digital sales channels and enhancing product innovation to sustain its luxury competitive edge.
Church & Dwight Co., Inc.: Mass-Market Household and Specialty Products Innovator
Church & Dwight Co., Inc. operates as a vital player in everyday consumer essentials, offering household, personal care, and specialty products such as ARM & HAMMER baking soda and OXICLEAN stain removers. Its revenue derives largely from mass-market retail distribution. In 2026, the firm emphasizes broadening its specialty products division and expanding its e-commerce footprint to capture new consumer segments.
Strategic Collision: Similarities & Divergences
Both companies excel in the household and personal products industry but pursue different models. Estée Lauder focuses on a closed ecosystem of luxury brands, while Church & Dwight targets broad accessibility with mass-market staples. Their primary battleground lies in consumer reach—prestige versus volume. These contrasting strategies create distinct investment profiles: Estée Lauder offers growth through brand prestige and innovation, while Church & Dwight provides stability through product ubiquity and diversification.
Income Statement Comparison
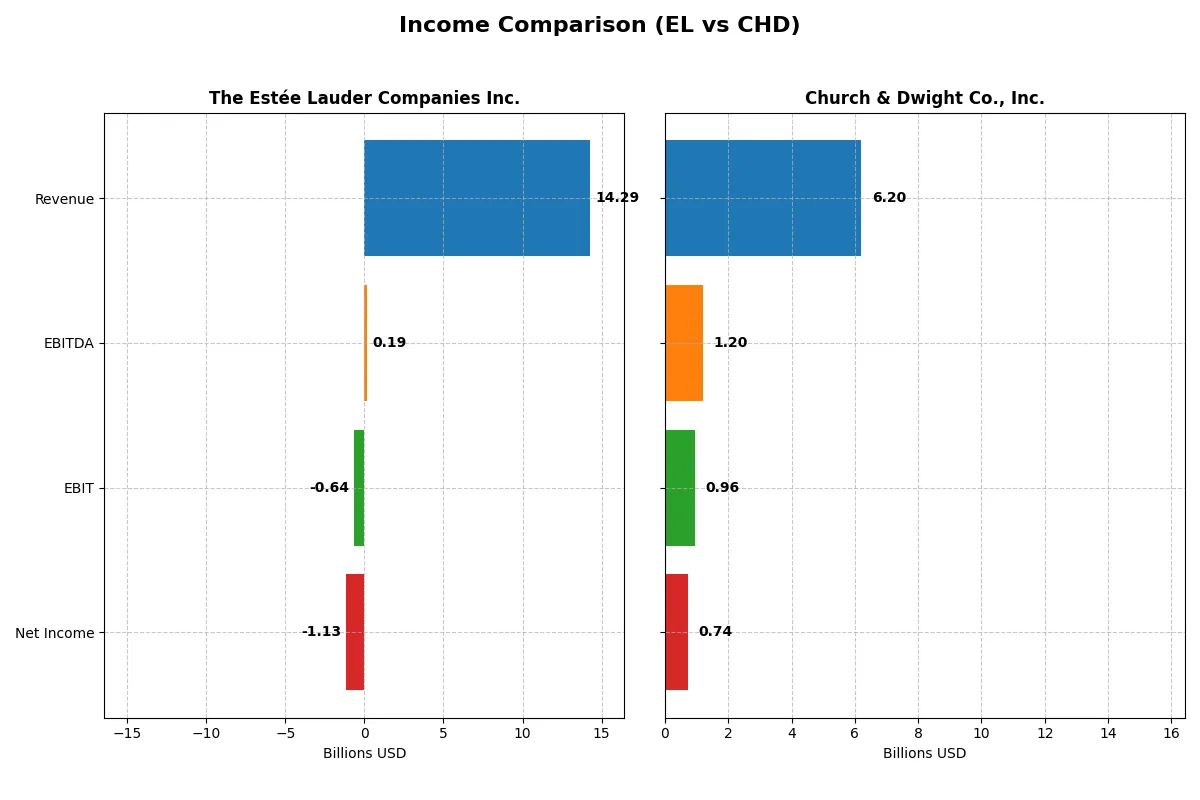
The following data dissects the core profitability and scalability of both corporate engines to reveal who dominates the bottom line:
| Metric | The Estée Lauder Companies Inc. (EL) | Church & Dwight Co., Inc. (CHD) |
|---|---|---|
| Revenue | 14.3B | 6.2B |
| Cost of Revenue | 3.7B | 3.4B |
| Operating Expenses | 9.6B | 1.7B |
| Gross Profit | 10.6B | 2.8B |
| EBITDA | 193M | 1.2B |
| EBIT | -636M | 957M |
| Interest Expense | 404M | 0 |
| Net Income | -1.13B | 737M |
| EPS | -3.15 | 3.04 |
| Fiscal Year | 2025 | 2025 |
Income Statement Analysis: The Bottom-Line Duel
This income statement comparison exposes which company drives stronger profitability and operational efficiency in their core businesses.
The Estée Lauder Companies Inc. Analysis
Estée Lauder’s revenue declined from $17.7B in 2022 to $14.3B in 2025, while net income swung from a $2.4B profit to a $1.1B loss. Despite a solid gross margin near 74%, net margin plunged to -7.9% in 2025, highlighting deteriorating cost control and operational challenges. The recent year shows a sharp drop in EBIT and EPS, signaling weakening momentum.
Church & Dwight Co., Inc. Analysis
Church & Dwight steadily grew revenue from $5.2B in 2021 to $6.2B in 2025, with net income fluctuating but remaining positive at $737M last year. The company maintains a healthy gross margin of 44.7% and an impressive EBIT margin of 15.4%. In 2025, net margin improved to 11.9%, supported by efficient expense management and positive EBIT growth, reflecting solid operational momentum.
Margin Strength vs. Revenue Scale
Church & Dwight demonstrates superior margin quality and consistent profitability, while Estée Lauder struggles with margin compression and recent net losses. Based purely on income statement fundamentals, Church & Dwight presents a more resilient earnings profile. Investors seeking stable profitability will find Church & Dwight’s operational efficiency more attractive than Estée Lauder’s current volatility.
Financial Ratios Comparison
These vital ratios act as a diagnostic tool to expose the underlying fiscal health, valuation premiums, and capital efficiency of the companies compared below:
| Ratios | The Estée Lauder Companies Inc. (EL) | Church & Dwight Co., Inc. (CHD) |
|---|---|---|
| ROE | -29.3% (2025) | 18.4% (2025) |
| ROIC | 6.4% (2025) | 11.2% (2025) |
| P/E | -25.7 (2025) | 27.6 (2025) |
| P/B | 7.53 (2025) | 5.08 (2025) |
| Current Ratio | 1.30 (2025) | 1.07 (2025) |
| Quick Ratio | 0.92 (2025) | 0.71 (2025) |
| D/E | 2.44 (2025) | 0.55 (2025) |
| Debt-to-Assets | 47.5% (2025) | 24.7% (2025) |
| Interest Coverage | 2.37 (2025) | N/A (0 in 2025) |
| Asset Turnover | 0.72 (2025) | 0.70 (2025) |
| Fixed Asset Turnover | 2.79 (2025) | 7.54 (2025) |
| Payout ratio | -54.5% (2025) | 39.0% (2025) |
| Dividend yield | 2.12% (2025) | 1.41% (2025) |
| Fiscal Year | 2025 | 2025 |
Efficiency & Valuation Duel: The Vital Signs
Ratios act as a company’s DNA, uncovering hidden risks and revealing operational excellence behind headline numbers.
The Estée Lauder Companies Inc.
Estée Lauder shows weak profitability with a negative ROE of -29.3% and a net margin of -7.9%. Its valuation appears attractive with a favorable negative P/E, but a high PB ratio of 7.5 signals stretched equity value. The firm delivers a 2.1% dividend yield, balancing shareholder returns despite operational challenges.
Church & Dwight Co., Inc.
Church & Dwight posts strong profitability, boasting an 18.4% ROE and an 11.9% net margin, reflecting efficient capital use. Its P/E of 27.6 and PB of 5.1 suggest an expensive stock relative to earnings and book value. The company offers a modest 1.4% dividend yield, supported by solid free cash flow generation.
Robust Profitability vs. Valuation Stretch
Church & Dwight leads in profitability and operational efficiency, while Estée Lauder’s valuation appears cheaper but masks significant profitability concerns. Investors seeking steady returns and operational strength may favor Church & Dwight’s profile. Those prioritizing valuation discounts might find Estée Lauder’s metrics intriguing yet riskier.
Which one offers the Superior Shareholder Reward?
I compare The Estée Lauder Companies Inc. (EL) and Church & Dwight Co., Inc. (CHD) based on dividends, payout ratios, and buybacks. EL yields around 2.1–2.5%, but its dividend payout is unstable, with negative coverage in 2025. EL complements dividends with moderate buybacks, yet recent net losses raise sustainability concerns. CHD offers a steadier 1.1–1.4% yield, with a consistent payout ratio near 35–47%, supported by strong free cash flow. Its aggressive buyback program further enhances total returns. Given CHD’s reliable dividend and robust buyback activity, I see it as the superior shareholder reward in 2026.
Comparative Score Analysis: The Strategic Profile
The radar chart reveals the fundamental DNA and trade-offs of The Estée Lauder Companies Inc. and Church & Dwight Co., Inc.:
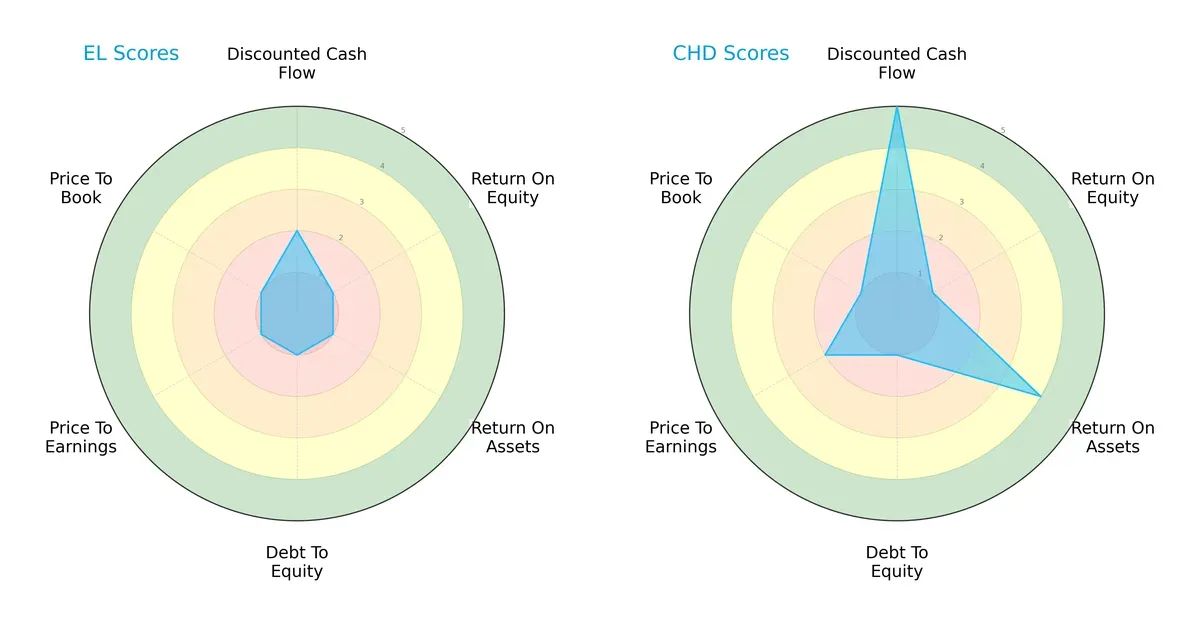
Church & Dwight dominates in discounted cash flow (DCF) with a very favorable score of 5 versus Estée Lauder’s 2. It also outperforms in return on assets (ROA) with a 4 compared to 1. Both share weak return on equity (ROE) and debt-to-equity scores at 1. Estée Lauder lags across price-to-earnings (PE) and price-to-book (PB) metrics, scoring 1 each, while Church & Dwight holds a slightly better PE score of 2. Church & Dwight presents a more balanced profile, leveraging operational efficiency and valuation, whereas Estée Lauder relies heavily on a moderate DCF score but suffers broad valuation and profitability weaknesses.
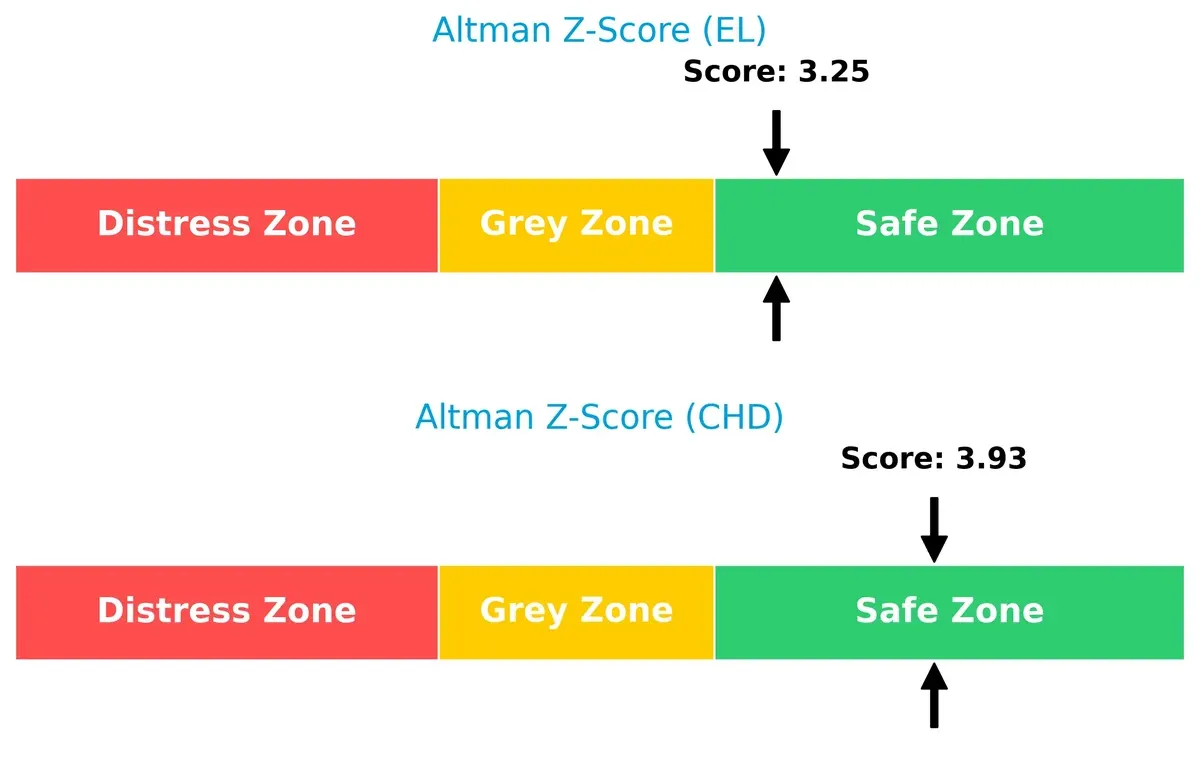
Bankruptcy Risk: Solvency Showdown
The Altman Z-Scores place both firms safely in the ‘safe zone,’ with Church & Dwight at 3.93 and Estée Lauder at 3.25, confirming strong long-term survival prospects in this cycle:
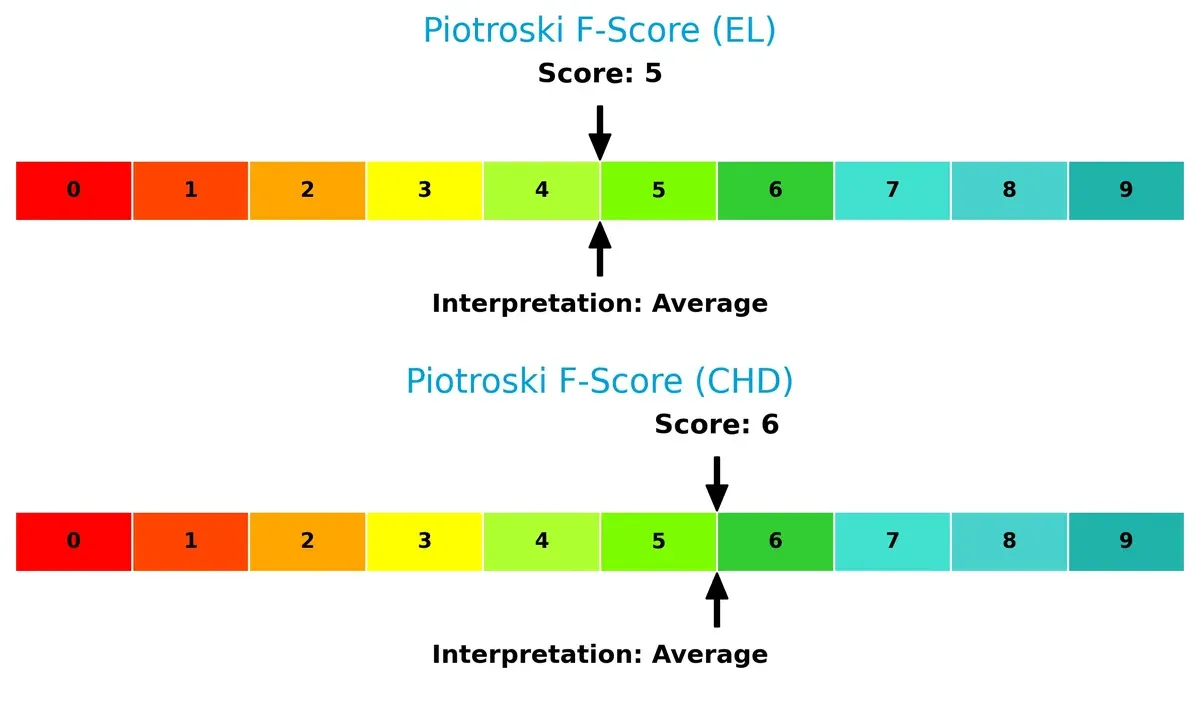
Financial Health: Quality of Operations
Church & Dwight’s Piotroski F-Score of 6 slightly surpasses Estée Lauder’s 5, signaling marginally stronger internal financial health. Neither firm shows critical red flags, but Church & Dwight’s higher score suggests better operational quality and risk management:
How are the two companies positioned?
This section dissects EL and CHD’s operational DNA by comparing revenue distribution and internal dynamics—strengths and weaknesses. The final goal is to confront their economic moats to identify which model delivers a more resilient, sustainable competitive advantage today.
Revenue Segmentation: The Strategic Mix
This visual comparison dissects how The Estée Lauder Companies Inc. and Church & Dwight Co., Inc. diversify their income streams and where their primary sector bets lie:
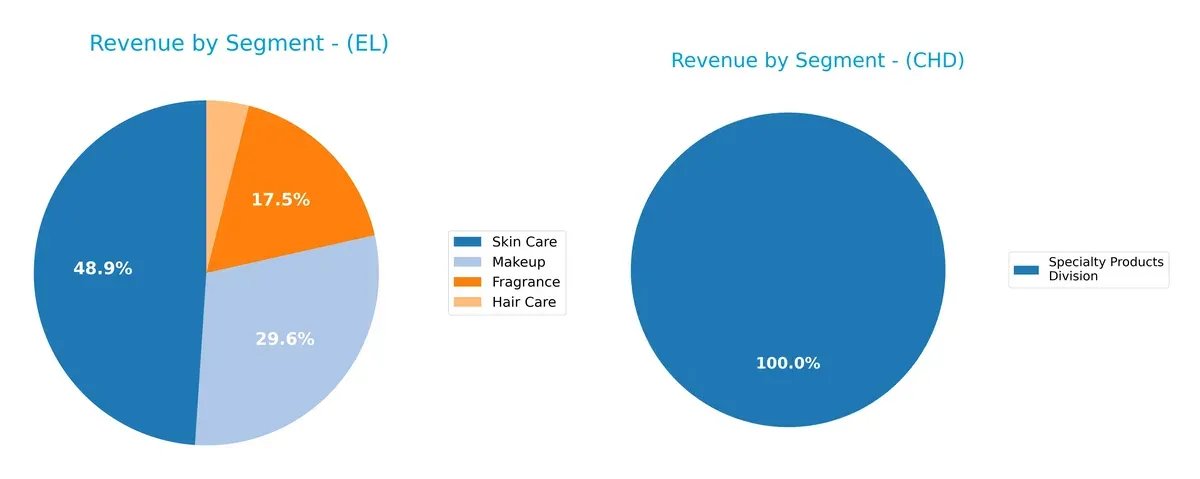
Estée Lauder boasts a diversified portfolio with Skin Care leading at $6.96B, followed by Makeup at $4.21B, Fragrance at $2.49B, and Hair Care at $565M. Church & Dwight relies solely on its Specialty Products Division, generating $303M. Estée Lauder’s broad mix anchors its ecosystem, reducing concentration risk. Church & Dwight’s single-segment focus increases vulnerability but may sharpen its operational efficiency in that niche.
Strengths and Weaknesses Comparison
This table compares the strengths and weaknesses of The Estée Lauder Companies Inc. and Church & Dwight Co., Inc.:
EL Strengths
- Diversified product portfolio with strong Skin Care and Makeup sales
- Balanced global presence across US, Asia Pacific, and EMEA
- Moderate current and quick ratios indicate reasonable liquidity
CHD Strengths
- Strong profitability with favorable net margin, ROE, and ROIC
- Low debt-to-assets ratio and high interest coverage support financial stability
- High fixed asset turnover suggests efficient asset use
EL Weaknesses
- Negative net margin and ROE signal profitability issues
- High debt-to-equity and unfavorable interest coverage increase financial risk
- Elevated price-to-book ratio may indicate overvaluation
CHD Weaknesses
- Elevated PE and PB ratios suggest valuation concerns
- Unfavorable quick ratio indicates potential liquidity constraints
- Less product diversification with single Specialty Products Division
Overall, EL shows strength in product and geographic diversification but struggles with profitability and leverage. CHD excels in profitability and financial stability, though it faces valuation and liquidity challenges. These factors imply distinct strategic priorities for each company.
The Moat Duel: Analyzing Competitive Defensibility
A structural moat is the only true shield protecting long-term profits from relentless competitive erosion in consumer goods sectors:
The Estée Lauder Companies Inc.: Intangible Assets Powerhouse
Estée Lauder’s moat stems from premium brand equity and product innovation, reflected in high gross margins but recent profit declines. New markets and luxury lines may deepen the moat if profitability recovers by 2026.
Church & Dwight Co., Inc.: Cost Advantage and Portfolio Diversity
Church & Dwight’s moat relies on cost advantages and diversified household essentials. It sustains strong EBIT and net margins, despite slight ROIC decline. Expansion in specialty products could reinforce its competitive edge.
Brand Prestige vs. Operational Efficiency: The Moat Showdown
Church & Dwight holds a wider moat with consistent value creation and margin strength. Estée Lauder’s intangible assets are powerful but undermined by shrinking returns. Church & Dwight is better positioned to defend market share amid evolving consumer demands.
Which stock offers better returns?
The past year shows a pronounced bearish trend for both stocks, with recent strong recovery phases driving accelerated upward momentum from late 2025 to early 2026.
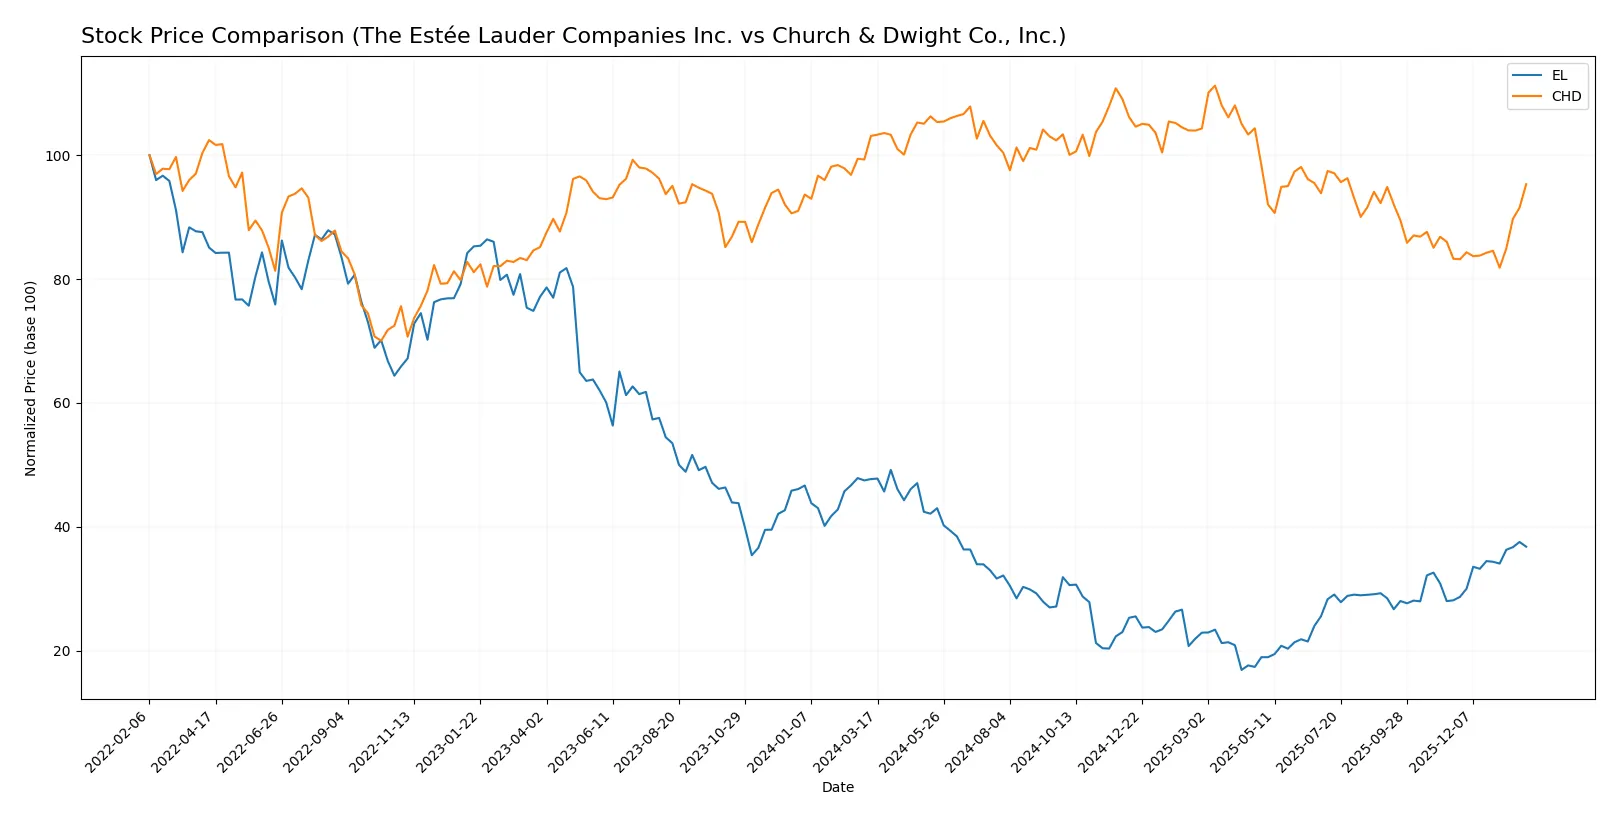
Trend Comparison
The Estée Lauder Companies Inc. (EL) experienced a -22.89% price decline over the past 12 months, marking a bearish trend with accelerating losses and high volatility. Notably, it rebounded 30.73% recently.
Church & Dwight Co., Inc. (CHD) also faced a bearish trend, dropping -7.56% over 12 months but with lower volatility and accelerating decline. Its recent rally gained 14.45%, showing moderate upward momentum.
EL’s larger price drop contrasts with its stronger recent rebound, yet CHD delivered a smaller overall loss and steadier volatility. EL’s recovery outpaced CHD’s, but CHD maintained better market stability.
Target Prices
The consensus target prices for The Estée Lauder Companies Inc. and Church & Dwight Co., Inc. reflect moderate upside potential.
| Company | Target Low | Target High | Consensus |
|---|---|---|---|
| The Estée Lauder Companies Inc. | 70 | 140 | 113.42 |
| Church & Dwight Co., Inc. | 82 | 102 | 96.25 |
Analysts expect Estée Lauder’s stock to trade near its current price of $115, suggesting balanced risk and reward. Church & Dwight’s consensus matches its current price exactly, implying a market equilibrium view.

Don’t Let Luck Decide Your Entry Point
Optimize your entry points with our advanced ProRealTime indicators. You’ll get efficient buy signals with precise price targets for maximum performance. Start outperforming now!
How do institutions grade them?
The Estée Lauder Companies Inc. Grades
The table below summarizes recent grades from reputable institutions for Estée Lauder.
| Grading Company | Action | New Grade | Date |
|---|---|---|---|
| Telsey Advisory Group | Maintain | Market Perform | 2026-01-30 |
| Deutsche Bank | Maintain | Buy | 2026-01-29 |
| TD Cowen | Maintain | Hold | 2026-01-21 |
| JP Morgan | Maintain | Overweight | 2026-01-16 |
| Citigroup | Maintain | Neutral | 2026-01-14 |
| UBS | Maintain | Neutral | 2026-01-14 |
| Raymond James | Upgrade | Strong Buy | 2026-01-05 |
| Wells Fargo | Maintain | Equal Weight | 2026-01-05 |
| Citigroup | Maintain | Neutral | 2025-12-17 |
| Evercore ISI Group | Maintain | Outperform | 2025-12-16 |
Church & Dwight Co., Inc. Grades
Below is a summary of recent institutional grades for Church & Dwight.
| Grading Company | Action | New Grade | Date |
|---|---|---|---|
| Jefferies | Maintain | Buy | 2026-01-28 |
| UBS | Maintain | Neutral | 2026-01-14 |
| TD Cowen | Maintain | Hold | 2026-01-08 |
| Wells Fargo | Maintain | Overweight | 2026-01-05 |
| Raymond James | Upgrade | Outperform | 2026-01-05 |
| Jefferies | Upgrade | Buy | 2025-12-17 |
| Citigroup | Upgrade | Neutral | 2025-12-17 |
| Deutsche Bank | Maintain | Buy | 2025-12-10 |
| Argus Research | Maintain | Buy | 2025-12-04 |
| Barclays | Maintain | Underweight | 2025-11-04 |
Which company has the best grades?
Both companies receive predominantly positive grades, but Estée Lauder has more “Strong Buy” and “Outperform” ratings. This may suggest stronger institutional confidence, potentially attracting more investor interest.
Risks specific to each company
The following categories identify the critical pressure points and systemic threats facing both firms in the 2026 market environment:
1. Market & Competition
The Estée Lauder Companies Inc.
- Faces intense luxury skincare and cosmetics competition, with margin pressure from costly innovation and branding.
Church & Dwight Co., Inc.
- Competes in mass-market household and personal care with stable demand but pricing pressures from private labels.
2. Capital Structure & Debt
The Estée Lauder Companies Inc.
- High debt-to-equity ratio (2.44) signals leverage risk and weak interest coverage (-1.57).
Church & Dwight Co., Inc.
- Low debt-to-equity (0.55) offers financial flexibility and strong interest coverage (infinite).
3. Stock Volatility
The Estée Lauder Companies Inc.
- Beta above 1.1 indicates above-market volatility, increasing investor risk.
Church & Dwight Co., Inc.
- Low beta (0.46) suggests defensive stock with lower market sensitivity.
4. Regulatory & Legal
The Estée Lauder Companies Inc.
- Exposure to global consumer product regulations and potential litigation in personal care.
Church & Dwight Co., Inc.
- Faces regulatory scrutiny mainly in product safety and environmental compliance in household goods.
5. Supply Chain & Operations
The Estée Lauder Companies Inc.
- Complex global supply chains vulnerable to disruptions and rising raw material costs.
Church & Dwight Co., Inc.
- More localized supply chain minimizes disruption risk but depends on commodity prices.
6. ESG & Climate Transition
The Estée Lauder Companies Inc.
- Increasing pressure to improve sustainability practices amid consumer and regulatory demands.
Church & Dwight Co., Inc.
- Moderate ESG risks with focus on reducing environmental footprint in manufacturing.
7. Geopolitical Exposure
The Estée Lauder Companies Inc.
- Significant international sales expose it to foreign exchange and geopolitical risks.
Church & Dwight Co., Inc.
- Primarily US-focused sales reduce geopolitical risk but limit global growth opportunities.
Which company shows a better risk-adjusted profile?
The Estée Lauder’s greatest risk is its stretched capital structure and weak profitability, heightening financial vulnerability. Church & Dwight faces competitive pressure but maintains a strong balance sheet and stable margins. Church & Dwight’s low leverage, superior credit metrics, and defensive beta give it a markedly better risk-adjusted profile. Its recent surge in share price (+4.7%) underscores investor confidence amid EL’s financial headwinds.
Final Verdict: Which stock to choose?
The Estée Lauder Companies Inc. (EL) boasts unmatched brand power and premium product positioning that fuel its pricing strength. However, it faces a significant point of vigilance with declining profitability and a capital structure that pressures returns. EL fits best in an aggressive growth portfolio willing to endure near-term volatility for potential brand-driven upside.
Church & Dwight Co., Inc. (CHD) offers a strategic moat through steady cash flow and efficient capital use, underscored by its value-creating ROIC above WACC. It presents a safer profile than EL, with more consistent profitability and lower financial risk. CHD suits a GARP (Growth at a Reasonable Price) investor seeking stability with moderate growth.
If you prioritize brand-driven growth potential and are comfortable with operational challenges, EL commands attention despite its financial headwinds. However, if you seek better stability and value creation with lower risk, CHD outshines as the more prudent choice for a balanced portfolio. Both represent distinct investor archetypes navigating the consumer staples sector’s evolving landscape.
Disclaimer: Investment carries a risk of loss of initial capital. The past performance is not a reliable indicator of future results. Be sure to understand risks before making an investment decision.
Go Further
I encourage you to read the complete analyses of The Estée Lauder Companies Inc. and Church & Dwight Co., Inc. to enhance your investment decisions: