Home > Comparison > Consumer Defensive > CHD vs CLX
The strategic rivalry between Church & Dwight Co., Inc. and The Clorox Company shapes the competitive landscape of the Consumer Defensive sector. Church & Dwight operates as a diversified household and personal products manufacturer with a broad brand portfolio. In contrast, Clorox combines household essentials with health and wellness, lifestyle, and international segments. This analysis will assess which company offers the superior risk-adjusted potential for a diversified portfolio amid evolving consumer preferences.
Table of contents
Companies Overview
Church & Dwight and The Clorox Company both hold significant roles in the global household and personal products market.
Church & Dwight Co., Inc.: Diverse Consumer Products Leader
Church & Dwight is a consumer defensive stalwart focusing on household and personal care products. It generates revenue through diversified brands like ARM & HAMMER for cleaning, TROJAN for personal care, and OXICLEAN for stain removal. In 2026, the company emphasizes expanding its specialty product segments while maintaining strong domestic and international consumer bases.
The Clorox Company: Global Household Brand Powerhouse
Clorox dominates with a broad portfolio spanning health and wellness, household, lifestyle, and international segments. Its core revenue stems from trusted brands such as Clorox, Glad, and Burt’s Bees, delivered through wide retail and e-commerce channels. The firm’s 2026 strategy focuses on integrating sustainability with innovation to strengthen its global footprint and product mix.
Strategic Collision: Similarities & Divergences
Both firms compete fiercely in consumer staples but differ in approach: Church & Dwight leverages a multi-brand, segmented strategy with specialty products, while Clorox pursues a global, integrated brand portfolio emphasizing sustainability. Their primary battleground lies in expanding market share within cleaning and personal care products. Each presents a distinct investment profile shaped by growth focus versus global diversification.
Income Statement Comparison
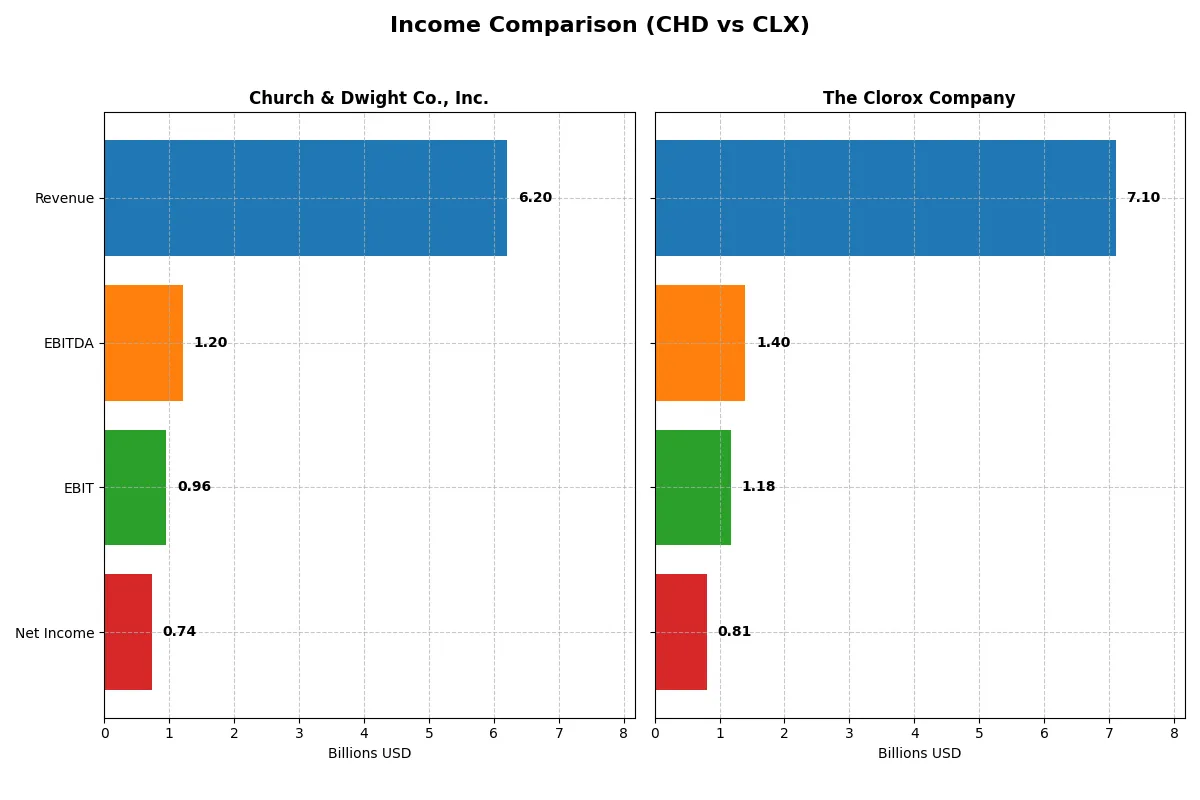
This data dissects the core profitability and scalability of both corporate engines to reveal who dominates the bottom line:
| Metric | Church & Dwight Co., Inc. (CHD) | The Clorox Company (CLX) |
|---|---|---|
| Revenue | 6.2B | 7.1B |
| Cost of Revenue | 3.4B | 3.9B |
| Operating Expenses | 1.7B | 2.0B |
| Gross Profit | 2.8B | 3.2B |
| EBITDA | 1.2B | 1.4B |
| EBIT | 957M | 1.2B |
| Interest Expense | 0 | 101M |
| Net Income | 737M | 810M |
| EPS | 3.04 | 6.56 |
| Fiscal Year | 2025 | 2025 |
Income Statement Analysis: The Bottom-Line Duel
This income statement comparison reveals how each company’s operational efficiency and profitability have evolved through their core business engines.
Church & Dwight Co., Inc. Analysis
Church & Dwight’s revenue grew steadily from 5.19B in 2021 to 6.20B in 2025, showing solid top-line momentum. Net income, however, declined overall, hitting 737M in 2025, reflecting margin pressure. Gross margin remains strong at 44.7%, and net margin improved to 11.9% in 2025, signaling better operational control and earnings quality.
The Clorox Company Analysis
Clorox’s revenue hovered around 7.1B to 7.4B from 2021 to mid-2025, showing flat top-line growth. Net income surged from 280M in 2024 to 810M in 2025, driven by a sharp jump in EBIT and net margin expansion to 11.4%. The gross margin of 45.0% and EBIT margin of 16.6% highlight efficient cost management and improving profitability momentum.
Margin Discipline vs. Earnings Momentum
Church & Dwight delivers steady revenue growth with solid gross and net margins but faces challenges in net income growth over five years. Clorox shows flatter revenue but stronger earnings acceleration and margin expansion recently. For investors, Clorox’s profile appeals more for its recent net income momentum and margin improvement, while Church & Dwight offers consistent growth with margin discipline.
Financial Ratios Comparison
These vital ratios act as a diagnostic tool to expose the underlying fiscal health, valuation premiums, and capital efficiency of the companies compared below:
| Ratios | Church & Dwight Co., Inc. (CHD) | The Clorox Company (CLX) |
|---|---|---|
| ROE | 18.41% | 252.34% |
| ROIC | 11.19% | 24.14% |
| P/E | 27.62 | 18.31 |
| P/B | 5.08 | 46.20 |
| Current Ratio | 1.07 | 0.84 |
| Quick Ratio | 0.71 | 0.57 |
| D/E | 0.55 | 8.97 |
| Debt-to-Assets | 24.74% | 51.79% |
| Interest Coverage | 0 (not reported) | 11.67 |
| Asset Turnover | 0.70 | 1.28 |
| Fixed Asset Turnover | 7.54 | 4.44 |
| Payout ratio | 38.98% | 74.32% |
| Dividend yield | 1.41% | 4.06% |
| Fiscal Year | 2025 | 2025 |
Efficiency & Valuation Duel: The Vital Signs
Financial ratios act as a company’s DNA, exposing operational strength and hidden risks critical for investment decisions.
Church & Dwight Co., Inc.
Church & Dwight posts a solid 18.4% ROE and an 11.9% net margin, demonstrating strong profitability. However, its high P/E of 27.6 and P/B of 5.1 suggest the stock trades at a stretched valuation. Shareholders receive a modest 1.4% dividend yield, reflecting balanced capital allocation between returns and growth.
The Clorox Company
Clorox delivers an extraordinary 252% ROE and a robust 11.4% net margin, indicating exceptional operational efficiency. Its P/E of 18.3 is reasonable, but a sky-high P/B of 46.2 flags a valuation risk. The 4.1% dividend yield rewards investors generously, underscoring a shareholder-friendly payout policy amid leverage concerns.
Premium Valuation vs. Operational Safety
Clorox offers dynamic returns and a strong dividend but carries valuation and leverage risks. Church & Dwight trades at a premium but with more moderate leverage and stable profitability. Risk-averse investors may favor Church & Dwight’s steadiness, while those seeking yield and growth might lean toward Clorox’s aggressive profile.
Which one offers the Superior Shareholder Reward?
Church & Dwight (CHD) delivers a modest 1.4% dividend yield with a sustainable 39% payout ratio and a steady buyback program supporting returns. Clorox (CLX) offers a higher 4.06% yield but with an unsustainable 74% payout ratio and weaker free cash flow coverage. I see CHD’s balanced dividend and buybacks as a more durable reward model. CLX’s heavy debt and payout risk weigh on long-term value. For 2026, I favor CHD for superior total shareholder return potential through prudent capital allocation and consistent cash flow generation.
Comparative Score Analysis: The Strategic Profile
The radar chart reveals the fundamental DNA and trade-offs of Church & Dwight and The Clorox Company, highlighting their financial strengths and valuation nuances:
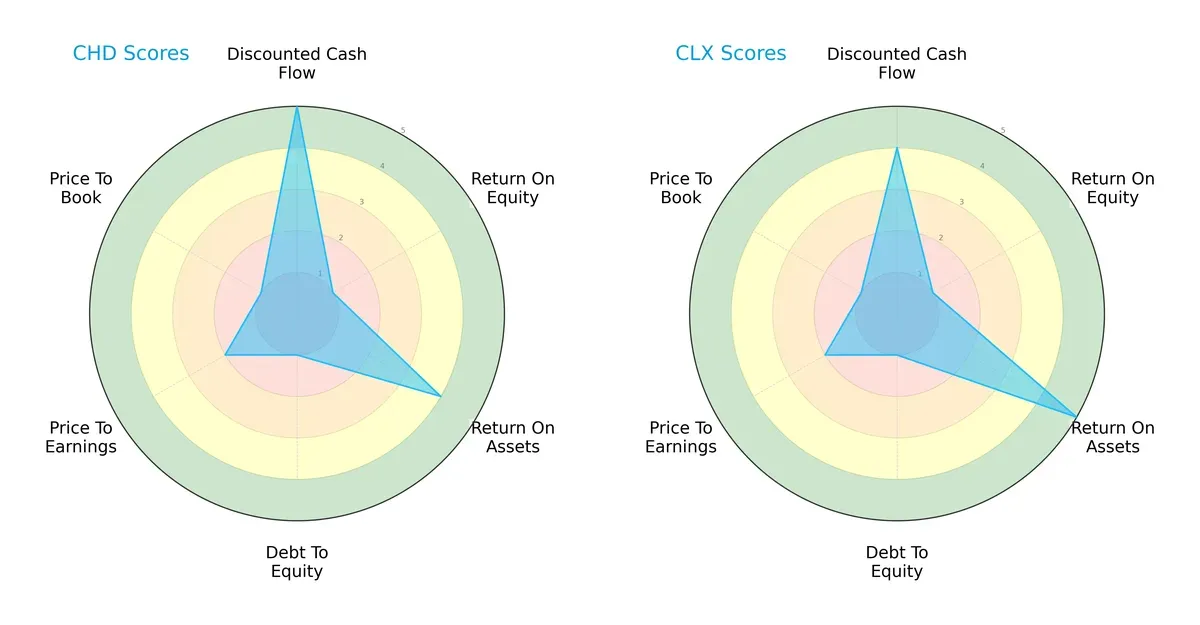
Church & Dwight leverages a higher discounted cash flow score (5 vs. 4) and strong asset utilization, while Clorox excels in return on assets (5 vs. 4). Both struggle with return on equity and carry high financial leverage (debt-to-equity score of 1 each). Valuation metrics (PE/PB) are similarly moderate to unfavorable, but Church & Dwight’s more balanced DCF and ROA scores suggest a steadier profile. Clorox leans more heavily on asset efficiency, indicating a specific operational edge.
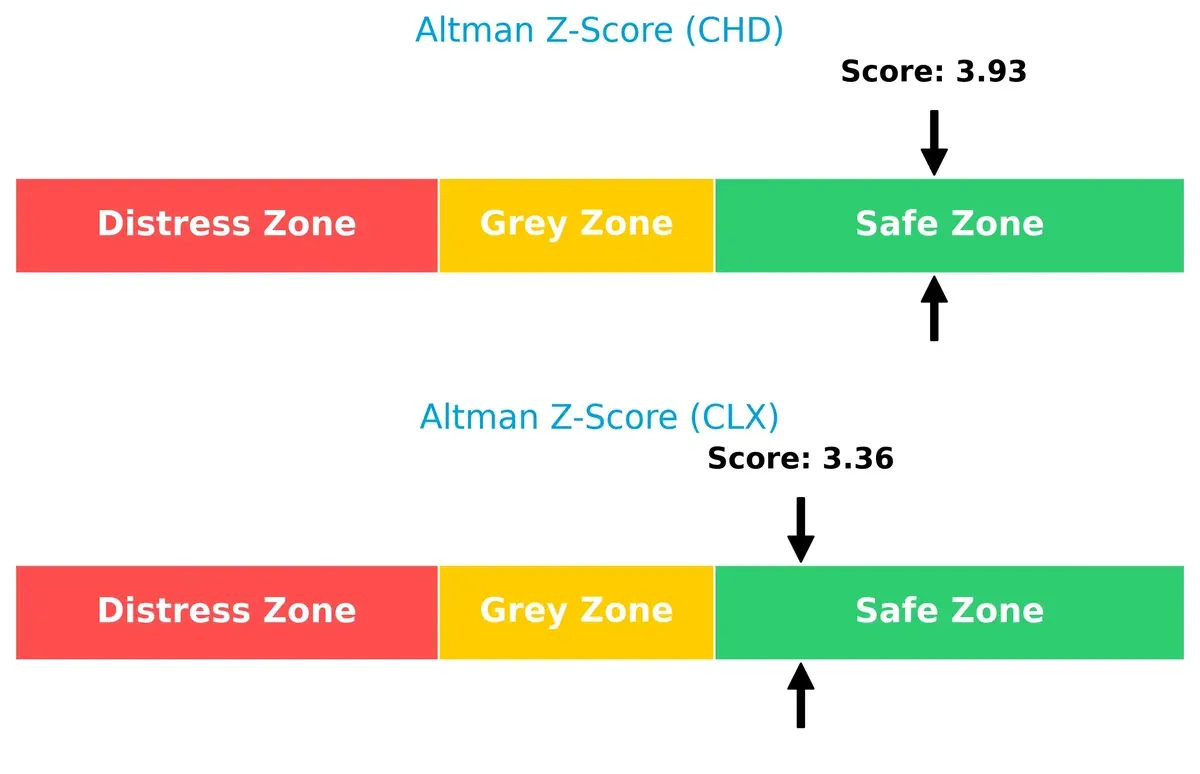
Bankruptcy Risk: Solvency Showdown
Church & Dwight’s Altman Z-Score of 3.93 slightly outpaces Clorox’s 3.36, placing both firmly in the safe zone for long-term survival in this economic cycle:
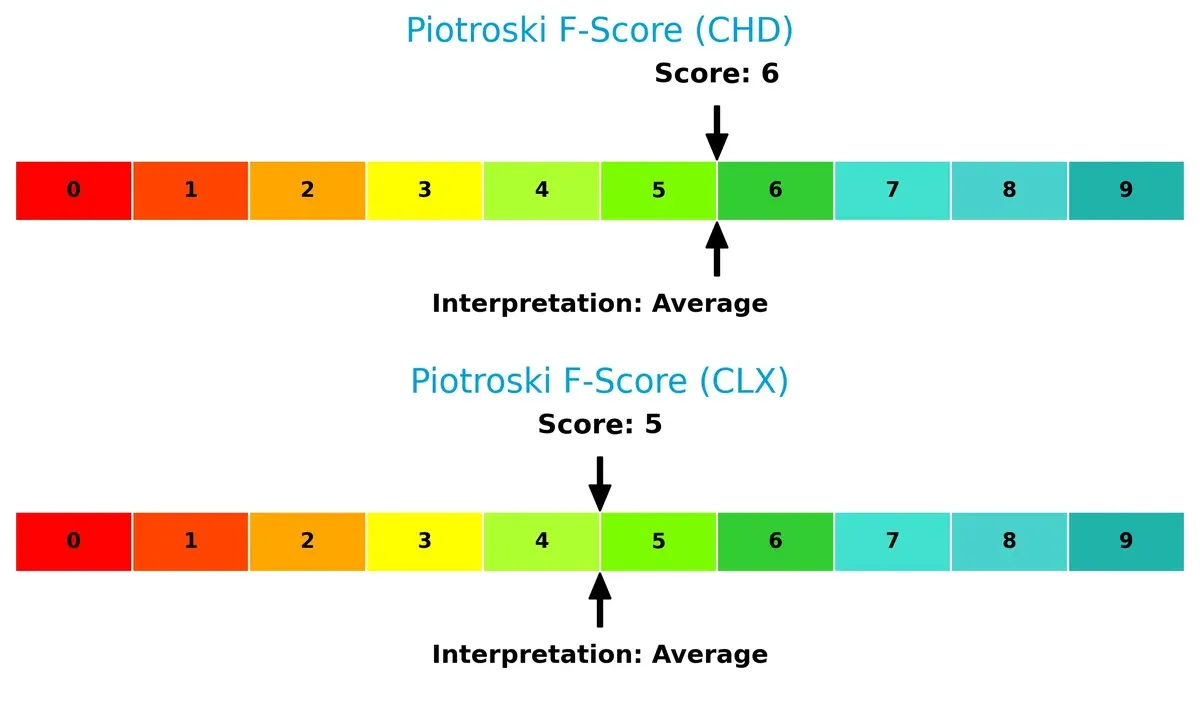
Financial Health: Quality of Operations
Church & Dwight’s Piotroski F-Score of 6 versus Clorox’s 5 signals marginally stronger financial health and fewer red flags in internal operations:
How are the two companies positioned?
This section dissects the operational DNA of Church & Dwight and Clorox by comparing their revenue distribution and internal dynamics. The goal is to confront their economic moats and identify which model offers the most resilient competitive advantage today.
Revenue Segmentation: The Strategic Mix
This visual comparison dissects how Church & Dwight and The Clorox Company diversify their income streams and reveals where their primary sector bets lie:
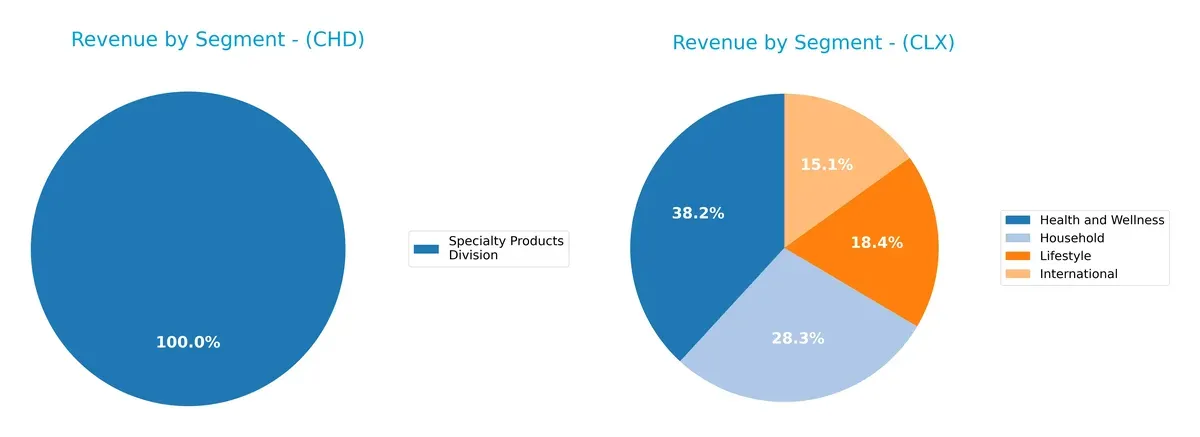
Church & Dwight anchors nearly all revenue in its Specialty Products Division, generating around $303M in 2024. In contrast, Clorox boasts a diversified portfolio across Health and Wellness ($2.7B), Household ($2B), International ($1.1B), and Lifestyle ($1.3B) segments in 2025. Clorox’s broad mix reduces concentration risk and leverages ecosystem lock-in, while Church & Dwight’s reliance on a single segment presents both niche focus and vulnerability to market shifts.
Strengths and Weaknesses Comparison
This table compares the Strengths and Weaknesses of Church & Dwight Co., Inc. and The Clorox Company:
CHD Strengths
- Favorable net margin and ROIC indicating efficient capital use
- Strong interest coverage and low debt-to-assets ratio
- Consistent domestic and international revenue streams
- Favorable fixed asset turnover ratio
CLX Strengths
- Higher ROE and ROIC reflecting strong profitability
- Favorable net margin and asset turnover ratios
- Diverse product segments and significant international presence
- Strong dividend yield and interest coverage
CHD Weaknesses
- Unfavorable P/E and P/B ratios suggesting valuation concerns
- Quick ratio below 1 indicates weaker liquidity
- Neutral to unfavorable leverage ratios
- Limited product segment diversification
CLX Weaknesses
- High debt-to-equity and debt-to-assets ratios imply greater financial risk
- Unfavorable liquidity ratios with current and quick ratios below 1
- Very high P/B ratio indicating possible overvaluation
- Lower product diversification in recent years
Both companies show solid profitability and global reach but differ in financial leverage and valuation metrics. CHD exhibits stronger balance sheet stability, while CLX leverages higher profitability at the cost of increased debt and valuation risks. This contrast influences their strategic priorities regarding risk management and growth investments.
The Moat Duel: Analyzing Competitive Defensibility
A structural moat is the only reliable barrier protecting long-term profits from relentless competitive erosion. Let’s dissect the moats of two industry leaders:
Church & Dwight Co., Inc.: Diverse Brand Portfolio with Cost Advantage
Church & Dwight leverages a strong brand portfolio and cost advantages. This reflects in stable 44.7% gross margins and 11.9% net margins. However, its ROIC is declining, signaling potential pressure on profitability in 2026.
The Clorox Company: Premium Brands and Innovation Leadership
Clorox’s moat stems from premium brands and innovation, driving a superior 16.6% EBIT margin and a rising ROIC. Its expanding profitability and product diversification strengthen its competitive edge for future growth.
Cost Efficiency vs. Innovation Powerhouse
Clorox commands a deeper moat with growing ROIC and accelerating net margin expansion, while Church & Dwight’s moat narrows amid declining profitability. Clorox stands better poised to defend and expand market share in 2026.
Which stock offers better returns?
The past year reveals contrasting dynamics: Church & Dwight (CHD) shows a moderate bearish drift with recent bullish momentum, while The Clorox Company (CLX) suffers steep declines despite a modest recovery lately.
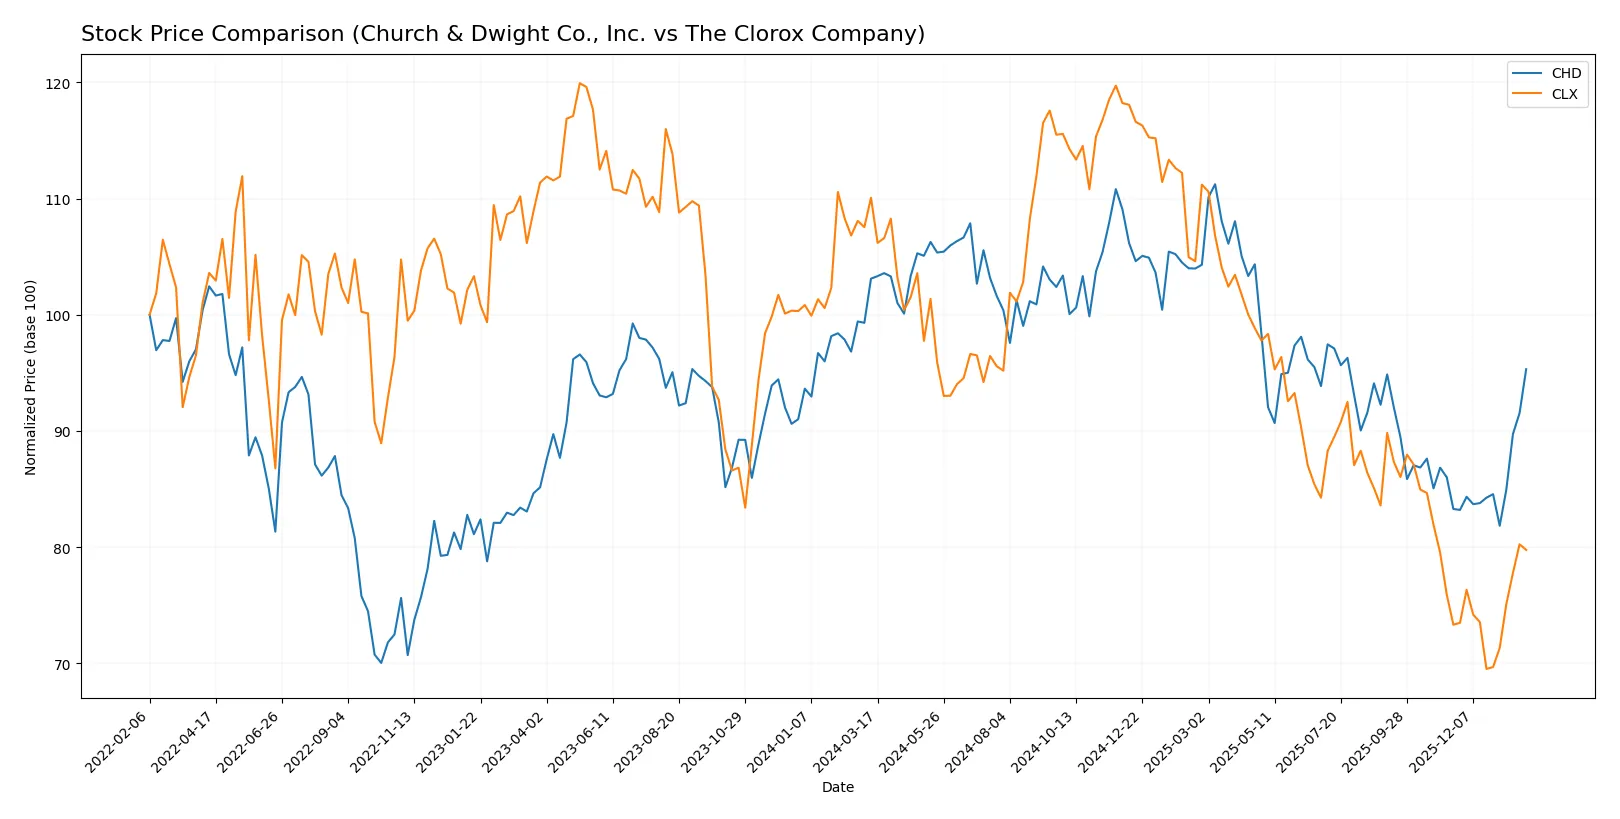
Trend Comparison
Church & Dwight (CHD) experienced a 7.56% price decline over 12 months, signaling a bearish trend with accelerating loss. Recent months reversed course with a 14.45% gain, suggesting renewed strength.
The Clorox Company (CLX) endured a sharper 27.54% drop over the year, confirming a bearish trend marked by acceleration. The recent 8.79% rise indicates partial recovery but remains weaker than CHD.
Comparing both, CHD delivered the highest recent market performance, showing stronger price resilience and buyer dominance than CLX on a 12-month horizon.
Target Prices
Analysts present a clear consensus on target prices for Church & Dwight Co., Inc. and The Clorox Company.
| Company | Target Low | Target High | Consensus |
|---|---|---|---|
| Church & Dwight Co., Inc. | 82 | 102 | 96.25 |
| The Clorox Company | 94 | 152 | 117.71 |
The consensus target for Church & Dwight matches its current price, indicating limited upside near-term. Clorox’s target consensus exceeds its current price by over 4%, suggesting moderate analyst optimism.

Don’t Let Luck Decide Your Entry Point
Optimize your entry points with our advanced ProRealTime indicators. You’ll get efficient buy signals with precise price targets for maximum performance. Start outperforming now!
How do institutions grade them?
Church & Dwight Co., Inc. Grades
The following table summarizes recent grades for Church & Dwight Co., Inc. from major grading firms.
| Grading Company | Action | New Grade | Date |
|---|---|---|---|
| Jefferies | Maintain | Buy | 2026-01-28 |
| UBS | Maintain | Neutral | 2026-01-14 |
| TD Cowen | Maintain | Hold | 2026-01-08 |
| Wells Fargo | Maintain | Overweight | 2026-01-05 |
| Raymond James | Upgrade | Outperform | 2026-01-05 |
| Citigroup | Upgrade | Neutral | 2025-12-17 |
| Jefferies | Upgrade | Buy | 2025-12-17 |
| Deutsche Bank | Maintain | Buy | 2025-12-10 |
| Argus Research | Maintain | Buy | 2025-12-04 |
| Barclays | Maintain | Underweight | 2025-11-04 |
The Clorox Company Grades
Below is a summary of recent grades for The Clorox Company from established grading firms.
| Grading Company | Action | New Grade | Date |
|---|---|---|---|
| Wells Fargo | Maintain | Equal Weight | 2026-01-23 |
| JP Morgan | Maintain | Neutral | 2026-01-16 |
| UBS | Maintain | Neutral | 2026-01-14 |
| TD Cowen | Maintain | Hold | 2026-01-08 |
| Goldman Sachs | Maintain | Sell | 2026-01-07 |
| Wells Fargo | Maintain | Equal Weight | 2026-01-05 |
| Citigroup | Maintain | Neutral | 2025-12-17 |
| Citigroup | Maintain | Neutral | 2025-11-04 |
| Wells Fargo | Maintain | Equal Weight | 2025-11-04 |
| Morgan Stanley | Maintain | Equal Weight | 2025-11-04 |
Which company has the best grades?
Church & Dwight holds stronger grades overall, including multiple Buy and Outperform ratings. Clorox mostly receives Neutral and Equal Weight grades, with a Sell from Goldman Sachs. Investors may see Church & Dwight as the more favorably viewed stock by analysts.
Risks specific to each company
The following categories identify critical pressure points and systemic threats facing Church & Dwight Co., Inc. and The Clorox Company in the 2026 market environment:
1. Market & Competition
Church & Dwight Co., Inc.
- Strong brand portfolio but faces stiff competition in Household & Personal Products sector.
The Clorox Company
- Diverse segment exposure but intense rivalry and premium pricing pressure hamper growth.
2. Capital Structure & Debt
Church & Dwight Co., Inc.
- Moderate debt-to-equity ratio (0.55), manageable leverage, favorable debt-to-assets (24.7%).
The Clorox Company
- High leverage with debt-to-equity near 9, and debt-to-assets over 51%, indicating financial risk.
3. Stock Volatility
Church & Dwight Co., Inc.
- Low beta (0.46) implies less sensitivity to market swings, offering stability.
The Clorox Company
- Slightly higher beta (0.58) suggests increased volatility but still below market average.
4. Regulatory & Legal
Church & Dwight Co., Inc.
- Operates mainly in US with exposure to consumer product regulations; no recent major legal issues.
The Clorox Company
- Global footprint increases regulatory complexity; potential legal risks in multiple jurisdictions.
5. Supply Chain & Operations
Church & Dwight Co., Inc.
- Relies on broad distribution channels; supply chain risks mitigated by diversified suppliers.
The Clorox Company
- Complex supply chain with international exposure; vulnerability to global disruptions.
6. ESG & Climate Transition
Church & Dwight Co., Inc.
- Faces pressure to improve sustainability practices; moderate ESG initiatives underway.
The Clorox Company
- Stronger ESG focus with initiatives in health and wellness segments but still evolving.
7. Geopolitical Exposure
Church & Dwight Co., Inc.
- Primarily US based, limited geopolitical risk but international segment adds some exposure.
The Clorox Company
- Significant international operations increase sensitivity to geopolitical tensions and trade policies.
Which company shows a better risk-adjusted profile?
Church & Dwight faces lower financial leverage and stock volatility, mitigating risk. Clorox’s high debt and international complexity raise concerns despite stronger operational metrics. Church & Dwight’s safer capital structure and stable beta grant it a superior risk-adjusted profile in 2026.
Final Verdict: Which stock to choose?
Church & Dwight’s superpower lies in its consistent value creation through efficient capital deployment and solid profitability. Its point of vigilance is a slightly declining ROIC trend and moderate liquidity ratios, which warrant close monitoring. It suits investors seeking steady income with moderate growth, fitting well into an Aggressive Growth portfolio.
The Clorox Company boasts a durable competitive moat with rising ROIC and robust free cash flow generation. Its strategic advantage rests on operational efficiency and a resilient product portfolio, despite a heavier debt load and weaker liquidity than Church & Dwight. Clorox fits investors favoring GARP strategies who prioritize growth balanced with reasonable valuation.
If you prioritize stable capital efficiency and moderate risk, Church & Dwight is the compelling choice due to its consistent value creation and solid profitability. However, if you seek durable competitive advantage paired with accelerating profitability, Clorox offers better growth momentum and operational leverage, albeit with higher financial risk. Both present viable scenarios depending on investor risk tolerance and growth preference.
Disclaimer: Investment carries a risk of loss of initial capital. The past performance is not a reliable indicator of future results. Be sure to understand risks before making an investment decision.
Go Further
I encourage you to read the complete analyses of Church & Dwight Co., Inc. and The Clorox Company to enhance your investment decisions: