Home > Comparison > Consumer Defensive > CHD vs SPB
The strategic rivalry between Church & Dwight Co., Inc. and Spectrum Brands Holdings, Inc. shapes the consumer defensive sector’s landscape. Church & Dwight operates as a diversified household and personal products manufacturer with strong brand heritage. Spectrum Brands focuses on branded consumer products across home care, pet care, and garden segments. This analysis will weigh their distinct operational approaches to reveal which offers superior risk-adjusted returns for a diversified portfolio in 2026.
Table of contents
Companies Overview
Church & Dwight and Spectrum Brands shape the global household and personal products market with distinct portfolios and strategies.
Church & Dwight Co., Inc.: Trusted Innovator in Consumer Essentials
Church & Dwight dominates with a diverse portfolio of household and specialty products including ARM & HAMMER baking soda and TROJAN personal care brands. Its revenue stems from broad consumer channels like supermarkets and e-commerce. In 2026, it sharpened focus on expanding its specialty products division and international consumer presence to sustain competitive advantage.
Spectrum Brands Holdings, Inc.: Multi-Category Consumer Products Leader
Spectrum Brands operates across home care, pet care, and garden segments, generating revenue through its extensive brand lineup such as Black & Decker and 8IN1 pet care. It sells via retailers and online platforms globally. The company’s 2026 strategy emphasizes strengthening its pet care and home and garden segments to capitalize on growing demand for specialty consumer solutions.
Strategic Collision: Similarities & Divergences
Both companies compete in the consumer defensive sector but diverge in business models. Church & Dwight leverages a focused portfolio with strong brand loyalty, while Spectrum Brands pursues a broad multi-category approach. Their primary battleground lies in specialty household and personal care products. Church & Dwight offers a stable, diversified investment profile; Spectrum presents growth potential through category expansion but with higher volatility.
Income Statement Comparison
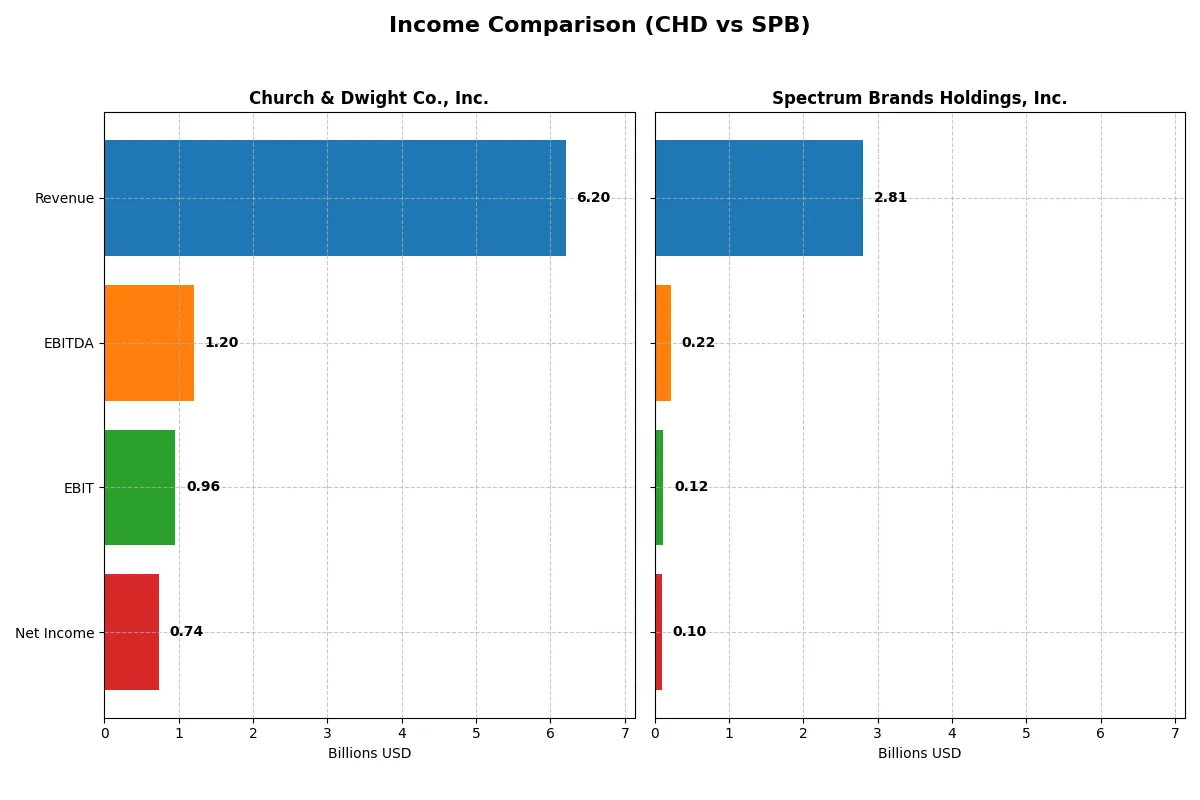
This data dissects the core profitability and scalability of both corporate engines to reveal who dominates the bottom line:
| Metric | Church & Dwight Co., Inc. (CHD) | Spectrum Brands Holdings, Inc. (SPB) |
|---|---|---|
| Revenue | 6.20B | 2.81B |
| Cost of Revenue | 3.43B | 1.78B |
| Operating Expenses | 1.70B | 907M |
| Gross Profit | 2.77B | 1.03B |
| EBITDA | 1.20B | 215M |
| EBIT | 957M | 117M |
| Interest Expense | 0 | 30M |
| Net Income | 737M | 100M |
| EPS | 3.04 | 3.88 |
| Fiscal Year | 2025 | 2025 |
Income Statement Analysis: The Bottom-Line Duel
This income statement comparison reveals which company runs its operations more efficiently and translates revenue into profit better.
Church & Dwight Co., Inc. Analysis
Church & Dwight steadily grew revenue from $5.19B in 2021 to $6.20B in 2025, reflecting a 19.5% increase overall. Net income showed volatility, peaking at $828M in 2021 before dipping and recovering to $737M in 2025. Gross margins remain robust near 44.7%, while net margins improved to 11.9%, signaling efficient cost control and margin resilience in 2025.
Spectrum Brands Holdings, Inc. Analysis
Spectrum Brands’ revenue declined from $3.00B in 2021 to $2.81B in 2025, a 6.3% decrease over the period. Net income swung dramatically, hitting $1.8B in 2023 due to a large discontinued operations gain but dropping to $100M in 2025. Gross margin compressed to 36.7%, with net margin at a modest 3.6%, highlighting weaker profitability and operational challenges.
Margin Strength vs. Revenue Growth
Church & Dwight shows superior margin strength and consistent revenue growth, while Spectrum Brands struggles with declining sales and volatile profits. The clear fundamental winner is Church & Dwight, whose stable margins and improving net income profile offer a more attractive investment foundation. Investors seeking steady operational efficiency would favor Church & Dwight’s reliable earnings engine.
Financial Ratios Comparison
These vital ratios act as a diagnostic tool to expose underlying fiscal health, valuation premiums, and capital efficiency of the companies compared below:
| Ratios | Church & Dwight Co., Inc. (CHD) | Spectrum Brands Holdings, Inc. (SPB) |
|---|---|---|
| ROE | 18.41% | 5.23% |
| ROIC | 11.19% | 4.31% |
| P/E | 27.62 | 13.51 |
| P/B | 5.08 | 0.71 |
| Current Ratio | 1.07 | 2.26 |
| Quick Ratio | 0.71 | 1.41 |
| D/E | 0.55 | 0.34 |
| Debt-to-Assets | 24.74% | 19.36% |
| Interest Coverage | N/A | 4.16 |
| Asset Turnover | 0.70 | 0.83 |
| Fixed Asset Turnover | 7.54 | 8.55 |
| Payout ratio | 38.98% | 48.25% |
| Dividend yield | 1.41% | 3.57% |
| Fiscal Year | 2025 | 2025 |
Efficiency & Valuation Duel: The Vital Signs
Ratios act as a company’s DNA, revealing hidden risks and operational excellence beneath surface-level financials.
Church & Dwight Co., Inc.
Church & Dwight shows strong profitability with an 18.41% ROE and an 11.88% net margin, signaling operational efficiency. However, its valuation is stretched, with a P/E of 27.62 and P/B at 5.08, above sector norms. The company returns value through a modest 1.41% dividend yield, balancing shareholder income and reinvestment.
Spectrum Brands Holdings, Inc.
Spectrum Brands posts weaker profitability, with a 5.23% ROE and 3.56% net margin, indicating lower operational efficiency. Its valuation appears attractive, featuring a P/E of 13.51 and a P/B of 0.71, suggesting undervaluation. The firm supports shareholders with a 3.57% dividend yield, reflecting a focus on income distribution over growth.
Premium Valuation vs. Income Focused Efficiency
Church & Dwight offers higher profitability but trades at a premium, raising valuation risk. Spectrum Brands provides a more favorable valuation and stronger dividend yield but lags on returns. Investors seeking growth might lean toward Church & Dwight, while income-focused profiles may prefer Spectrum’s stable yield and valuation.
Which one offers the Superior Shareholder Reward?
I see Church & Dwight (CHD) delivers steady dividends with a 1.41% yield and a conservative 39% payout ratio, backed by strong free cash flow coverage near 90%. Its buybacks are moderate but consistent, reinforcing sustainable shareholder returns. Spectrum Brands (SPB) boasts a higher 3.57% dividend yield and a similar payout ratio around 48%, supported by robust free cash flow and aggressive buybacks enhancing total returns. However, SPB’s higher financial leverage and volatile margins raise sustainability concerns. I conclude CHD offers a more balanced, reliable shareholder reward profile in 2026, emphasizing durability over yield alone.
Comparative Score Analysis: The Strategic Profile
The radar chart reveals the fundamental DNA and trade-offs of Church & Dwight Co., Inc. and Spectrum Brands Holdings, Inc. across key financial metrics:
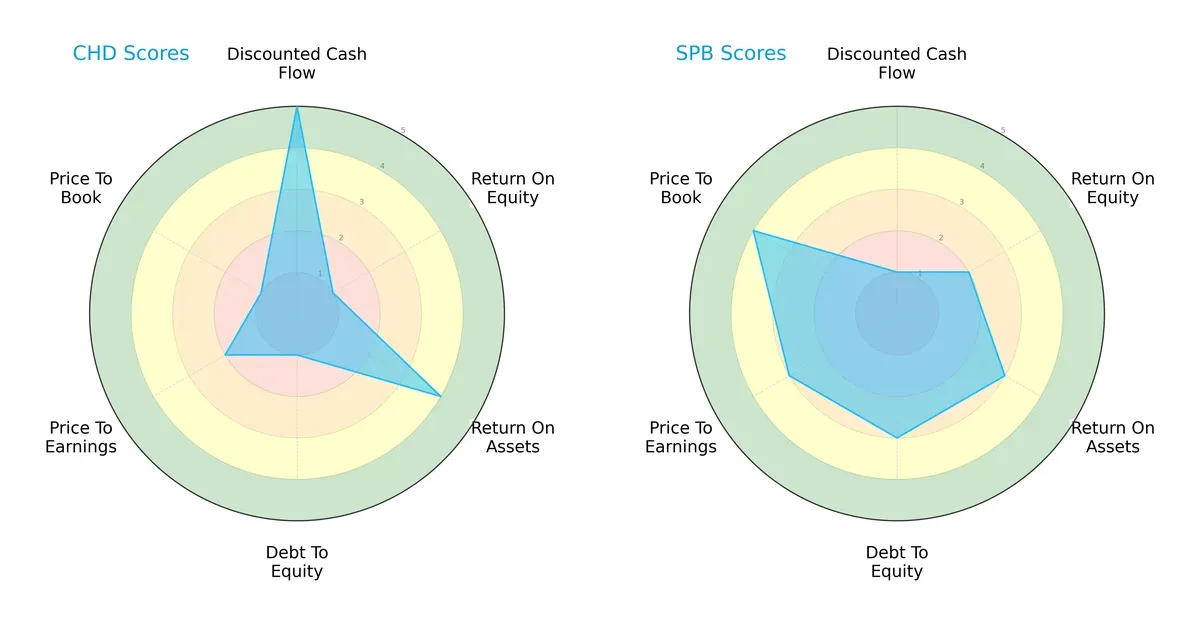
Church & Dwight boasts a very favorable DCF score (5) but struggles with profitability (ROE 1) and leverage (Debt/Equity 1), signaling reliance on cash flow rather than efficient capital use. Spectrum Brands shows a more balanced profile, with moderate scores across ROE (2), ROA (3), and Debt/Equity (3), though its DCF score (1) indicates potential overvaluation. Spectrum’s valuation metrics (P/E 3, P/B 4) also suggest better market pricing discipline.
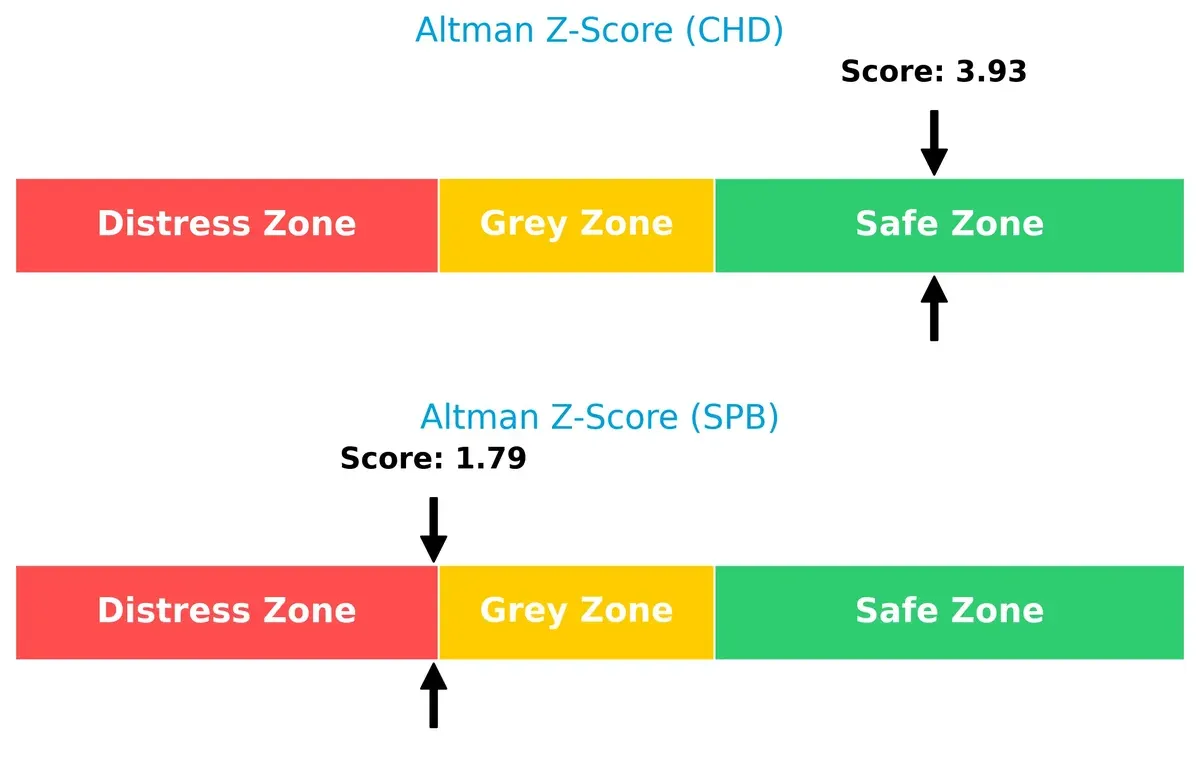
Bankruptcy Risk: Solvency Showdown
Church & Dwight’s Altman Z-Score of 3.93 places it comfortably in the safe zone, indicating strong long-term survival capacity. Spectrum Brands scores 1.79, landing in the distress zone and signaling elevated bankruptcy risk in this economic cycle:
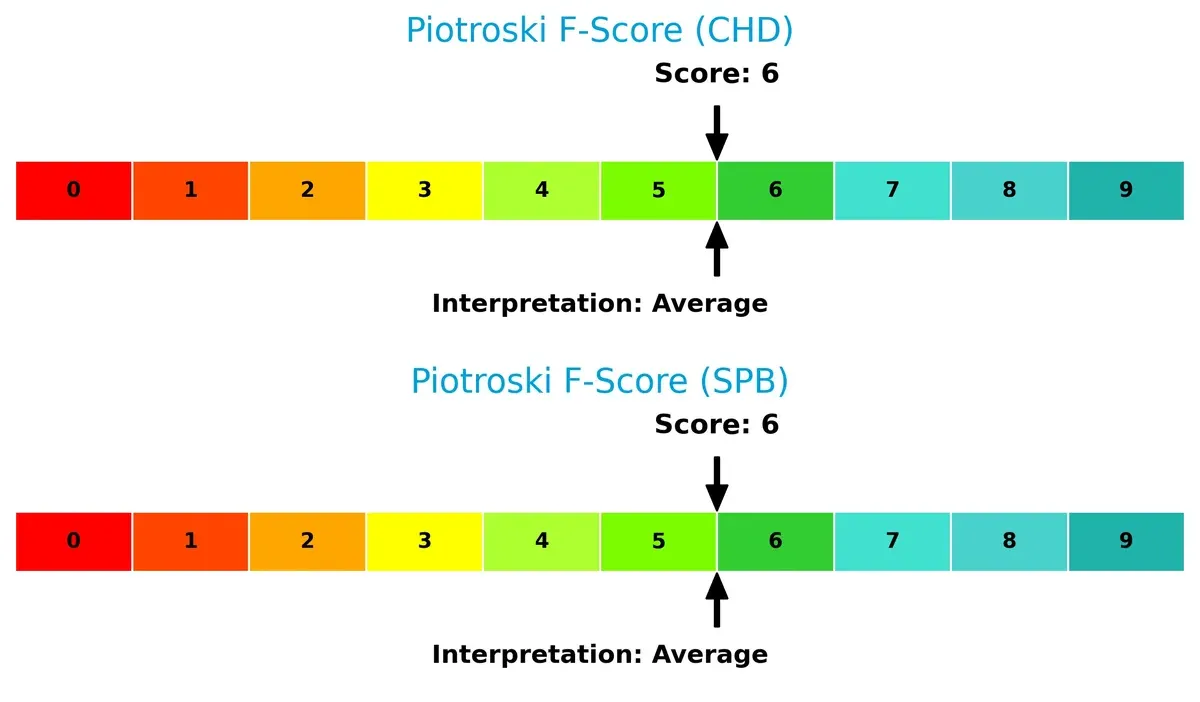
Financial Health: Quality of Operations
Both firms share a Piotroski F-Score of 6, reflecting average financial health. Neither shows acute red flags, but neither excels in operational robustness, suggesting room for improvement in earnings quality and balance sheet management:
How are the two companies positioned?
This section dissects the operational DNA of CHD and SPB by comparing their revenue distribution and internal dynamics. The goal is to confront their economic moats to reveal the more resilient and sustainable competitive advantage today.
Revenue Segmentation: The Strategic Mix
This visual comparison dissects how Church & Dwight Co., Inc. and Spectrum Brands Holdings, Inc. diversify their income streams and where their primary sector bets lie:
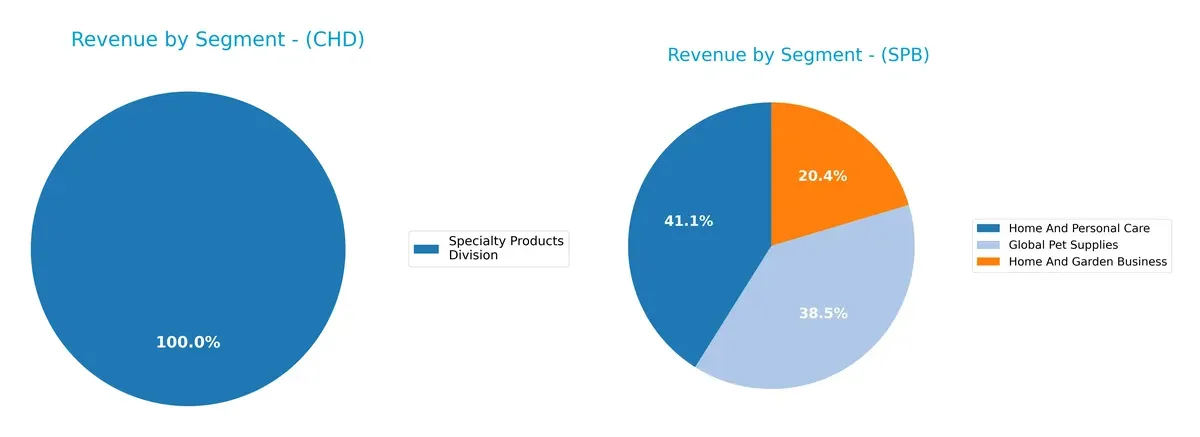
Church & Dwight relies heavily on its Specialty Products Division, generating around $303M in 2024, indicating a narrow focus. Spectrum Brands displays a broad portfolio with $1.15B in Home and Personal Care, $1.08B in Global Pet Supplies, and $573M in Home and Garden Business for 2025. Spectrum’s diversified mix reduces concentration risk, while Church & Dwight’s reliance on one segment may limit growth but anchors its niche expertise.
Strengths and Weaknesses Comparison
This table compares the Strengths and Weaknesses of Church & Dwight Co., Inc. and Spectrum Brands Holdings, Inc.:
CHD Strengths
- Favorable profitability with 11.88% net margin and 18.41% ROE
- ROIC at 11.19% exceeds WACC of 5.7% indicating strong capital efficiency
- Diversified revenue from specialty products and broad geographic presence
- Solid debt-to-assets ratio at 24.74% and infinite interest coverage
- Favorable fixed asset turnover at 7.54 and consistent dividend yield
SPB Strengths
- Favorable valuation metrics with PE of 13.51 and PB of 0.71
- Strong liquidity shown by current ratio of 2.26 and quick ratio of 1.41
- Favorable debt metrics including 19.36% debt-to-assets and 0.34 debt-to-equity
- Diversified revenue streams across pet supplies, home care, and garden segments
- Favorable dividend yield at 3.57% and high fixed asset turnover at 8.55
CHD Weaknesses
- Unfavorable high PE at 27.62 and PB at 5.08 suggest possible overvaluation
- Quick ratio of 0.71 signals weaker short-term liquidity
- Neutral current ratio and moderate asset turnover at 0.7
- Limited revenue diversification focused on specialty products only
- Dividend yield is modest at 1.41%
SPB Weaknesses
- Unfavorable profitability with 3.56% net margin and 5.23% ROE well below sector averages
- ROIC of 4.31% barely covers WACC of 5.47%, indicating weak capital returns
- Interest coverage at 3.91 is only neutral, posing some risk on debt service
- Lower asset turnover at 0.83 compared to CHD
- Geographic revenue skewed heavily toward the U.S. with limited international diversification
CHD excels in profitability and capital efficiency but shows valuation and liquidity concerns. SPB offers stronger liquidity and valuation but struggles with profitability and capital returns. Each company’s profile suggests distinct strategic focuses and financial priorities.
The Moat Duel: Analyzing Competitive Defensibility
A structural moat is the only reliable barrier protecting long-term profits from relentless competition and market share erosion:
Church & Dwight Co., Inc.: Intangible Assets Moat
Church & Dwight leverages strong brand equity and diversified household products. Its 5.5% ROIC premium over WACC shows value creation despite a declining trend. Expansion into specialty and international markets could deepen this moat in 2026.
Spectrum Brands Holdings, Inc.: Recovery in Operational Efficiency
Spectrum relies on a broad product portfolio with some brand recognition but lacks Church & Dwight’s intangible asset strength. Its negative ROIC spread signals value destruction, though improving ROIC trends suggest operational turnaround potential and market repositioning.
Intangible Assets vs. Operational Turnaround: Who Holds the Moat Edge?
Church & Dwight’s intangible asset moat is wider and currently more profitable. Spectrum’s improving ROIC is promising but insufficient to offset its value destruction. I believe Church & Dwight remains better equipped to defend its market share.
Which stock offers better returns?
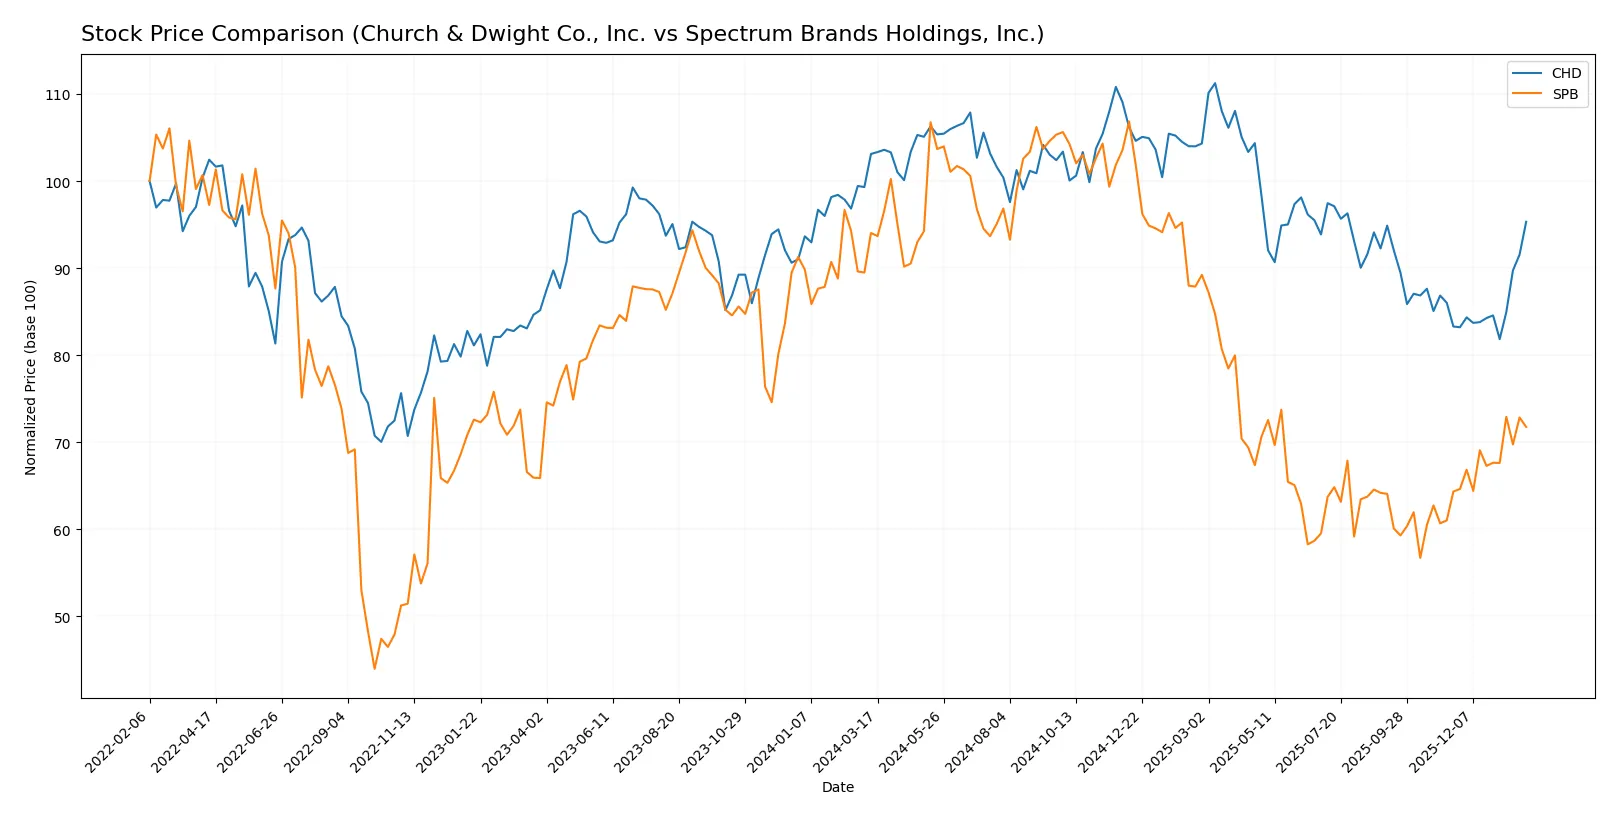
Over the past year, both Church & Dwight Co., Inc. and Spectrum Brands Holdings, Inc. experienced notable price declines followed by recent positive reversals, reflecting shifting trading dynamics and accelerating trends.
Trend Comparison
Church & Dwight Co., Inc. shows a bearish trend over the last 12 months with a -7.56% price change and accelerating downward momentum. A recent 14.45% rally from November 2025 to February 2026 indicates a strong short-term rebound.
Spectrum Brands Holdings, Inc. suffered a larger 12-month decline of -23.7% with accelerating bearish momentum and higher volatility. Its recent 11.54% price gain signals a modest recovery but remains well below prior highs.
Church & Dwight outperformed Spectrum Brands over the full year, delivering a smaller loss and stronger recent rebound, marking it as the better performing stock in this period.
Target Prices
Analysts present clear target consensus for Church & Dwight Co., Inc. and Spectrum Brands Holdings, Inc.
| Company | Target Low | Target High | Consensus |
|---|---|---|---|
| Church & Dwight Co., Inc. | 82 | 102 | 96.25 |
| Spectrum Brands Holdings, Inc. | 75 | 75 | 75 |
Church & Dwight’s consensus target matches its current price of 96.25, suggesting fair valuation. Spectrum Brands trades at 63.71, well below the 75 target, indicating potential upside.

Don’t Let Luck Decide Your Entry Point
Optimize your entry points with our advanced ProRealTime indicators. You’ll get efficient buy signals with precise price targets for maximum performance. Start outperforming now!
How do institutions grade them?
Here is a summary of recent institutional grades for Church & Dwight Co., Inc. and Spectrum Brands Holdings, Inc.:
Church & Dwight Co., Inc. Grades
This table shows recent grades from prominent financial institutions for Church & Dwight Co., Inc.
| Grading Company | Action | New Grade | Date |
|---|---|---|---|
| Jefferies | Maintain | Buy | 2026-01-28 |
| UBS | Maintain | Neutral | 2026-01-14 |
| TD Cowen | Maintain | Hold | 2026-01-08 |
| Wells Fargo | Maintain | Overweight | 2026-01-05 |
| Raymond James | Upgrade | Outperform | 2026-01-05 |
| Jefferies | Upgrade | Buy | 2025-12-17 |
| Citigroup | Upgrade | Neutral | 2025-12-17 |
| Deutsche Bank | Maintain | Buy | 2025-12-10 |
| Argus Research | Maintain | Buy | 2025-12-04 |
| Barclays | Maintain | Underweight | 2025-11-04 |
Spectrum Brands Holdings, Inc. Grades
This table presents recent grades from recognized grading firms for Spectrum Brands Holdings, Inc.
| Grading Company | Action | New Grade | Date |
|---|---|---|---|
| Canaccord Genuity | Maintain | Buy | 2025-11-17 |
| Wells Fargo | Maintain | Equal Weight | 2025-11-14 |
| Wells Fargo | Maintain | Equal Weight | 2025-09-25 |
| Canaccord Genuity | Maintain | Buy | 2025-08-08 |
| Wells Fargo | Maintain | Equal Weight | 2025-07-09 |
| Canaccord Genuity | Maintain | Buy | 2025-06-25 |
| UBS | Maintain | Buy | 2025-05-09 |
| UBS | Maintain | Buy | 2025-04-17 |
| Wells Fargo | Maintain | Equal Weight | 2025-04-16 |
| Wells Fargo | Maintain | Equal Weight | 2025-04-02 |
Which company has the best grades?
Church & Dwight Co., Inc. generally receives higher grades including multiple Buy and Outperform ratings. Spectrum Brands Holdings, Inc. mostly holds Buy and Equal Weight grades. Higher grades for Church & Dwight may signal greater institutional confidence, potentially affecting investor sentiment positively.
Risks specific to each company
The following categories identify the critical pressure points and systemic threats facing both firms in the 2026 market environment:
1. Market & Competition
Church & Dwight Co., Inc. (CHD)
- Strong brand portfolio supports resilience but high P/E and P/B ratios may limit growth potential.
Spectrum Brands Holdings, Inc. (SPB)
- Diverse product lines but weaker profitability and moderate market position increase competitive pressure.
2. Capital Structure & Debt
Church & Dwight Co., Inc. (CHD)
- Moderate debt levels with favorable interest coverage; debt-to-assets at 24.7%.
Spectrum Brands Holdings, Inc. (SPB)
- Lower debt-to-assets at 19.4% and stronger liquidity ratios enhance financial flexibility.
3. Stock Volatility
Church & Dwight Co., Inc. (CHD)
- Low beta (0.46) suggests defensive stock with less price volatility.
Spectrum Brands Holdings, Inc. (SPB)
- Slightly higher beta (0.68) implies moderate sensitivity to market swings.
4. Regulatory & Legal
Church & Dwight Co., Inc. (CHD)
- Operating in consumer products; regulatory risks modest but must monitor product safety standards.
Spectrum Brands Holdings, Inc. (SPB)
- Broader product categories raise exposure to varying regulatory regimes globally, increasing compliance risk.
5. Supply Chain & Operations
Church & Dwight Co., Inc. (CHD)
- Established supply chains with moderate asset turnover (0.7); some operational efficiency opportunities.
Spectrum Brands Holdings, Inc. (SPB)
- Slightly better asset turnover (0.83) but complex global supply chains may pose disruption risks.
6. ESG & Climate Transition
Church & Dwight Co., Inc. (CHD)
- Increasing pressure to reduce environmental footprint in household products; progress needed.
Spectrum Brands Holdings, Inc. (SPB)
- Exposure to pet care and outdoor products demands robust ESG policies; transitional risks rising.
7. Geopolitical Exposure
Church & Dwight Co., Inc. (CHD)
- Primarily U.S.-focused with some international sales; geopolitical risks relatively contained.
Spectrum Brands Holdings, Inc. (SPB)
- More global footprint increases vulnerability to trade tensions and currency fluctuations.
Which company shows a better risk-adjusted profile?
Church & Dwight’s strongest risk lies in valuation stretch, risking downside in a market correction. Spectrum Brands faces profitability and financial distress risks, as reflected by its Altman Z-score in the distress zone. Despite weaker margins, SPB’s balance sheet and liquidity ratios present less financial risk. I view SPB as having a marginally better risk-adjusted profile due to stronger capital structure and valuation metrics. The stark contrast between CHD’s lofty price multiples and SPB’s financial distress signals warrants caution for growth investors.
Final Verdict: Which stock to choose?
Church & Dwight’s superpower lies in its consistent value creation and strong operational efficiency, reflected in robust returns on invested capital above its cost of capital. Its main point of vigilance is a slightly stretched balance sheet liquidity, which may pressure short-term flexibility. This stock fits well within an Aggressive Growth portfolio seeking steady profitability with manageable risks.
Spectrum Brands commands a strategic moat through disciplined cost control and a conservative capital structure, offering a safer investment profile compared to Church & Dwight. While its profitability lags, its lower valuation multiples and stronger liquidity make it suitable for a GARP (Growth at a Reasonable Price) investor focused on value and stability.
If you prioritize sustainable value creation and operational strength, Church & Dwight is the compelling choice due to its superior return on capital and earnings quality. However, if you seek better balance sheet safety and attractive valuation, Spectrum Brands offers superior stability despite current profitability challenges. Both represent distinct analytical scenarios tailored to differing investor risk tolerances and growth expectations.
Disclaimer: Investment carries a risk of loss of initial capital. The past performance is not a reliable indicator of future results. Be sure to understand risks before making an investment decision.
Go Further
I encourage you to read the complete analyses of Church & Dwight Co., Inc. and Spectrum Brands Holdings, Inc. to enhance your investment decisions: