Home > Comparison > Consumer Defensive > CHD vs NUS
The strategic rivalry between Church & Dwight Co., Inc. and Nu Skin Enterprises, Inc. defines the evolving dynamics of the consumer defensive sector. Church & Dwight operates as a diversified manufacturer of household and specialty products with broad retail distribution. Nu Skin focuses on high-margin beauty and wellness products marketed through direct sales and distributors. This analysis will clarify which company offers a superior risk-adjusted return for a diversified portfolio amid shifting consumer preferences.
Table of contents
Companies Overview
Church & Dwight and Nu Skin Enterprises both shape the competitive landscape of the household and personal products market.
Church & Dwight Co., Inc.: Household Products Powerhouse
Church & Dwight dominates with a diverse portfolio in household and personal care products. Its core revenue stems from established brands like ARM & HAMMER and OXICLEAN, spanning consumer and specialty segments. In 2026, the company focuses on expanding its product reach across retail and e-commerce channels, leveraging its broad distribution network and trusted brand equity.
Nu Skin Enterprises, Inc.: Direct-to-Consumer Beauty Innovator
Nu Skin specializes in beauty and wellness, generating revenue primarily through skin care systems and nutritional supplements. Its competitive edge lies in direct sales via distributors and online platforms, targeting anti-aging and weight management markets. The 2026 strategy centers on product innovation and geographic expansion, particularly in Mainland China retail and service operations.
Strategic Collision: Similarities & Divergences
Both companies compete in personal care but differ in distribution; Church & Dwight relies on broad retail presence, while Nu Skin pursues a direct selling model. Their key battleground is consumer loyalty within health and beauty segments. Church & Dwight offers a stable, diversified profile, whereas Nu Skin carries higher growth potential paired with elevated market volatility.
Income Statement Comparison
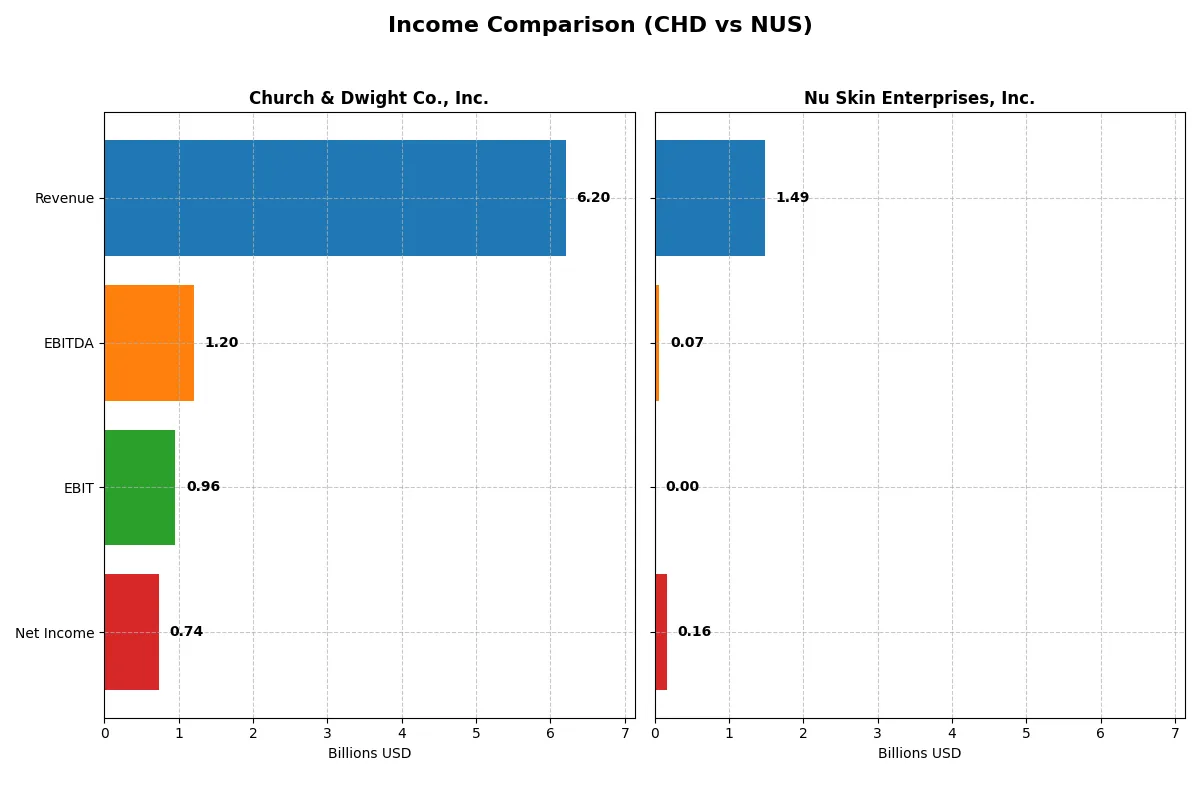
The following data dissects the core profitability and scalability of both corporate engines to reveal who dominates the bottom line:
| Metric | Church & Dwight Co., Inc. (CHD) | Nu Skin Enterprises, Inc. (NUS) |
|---|---|---|
| Revenue | 6.2B | 1.5B |
| Cost of Revenue | 3.4B | 454M |
| Operating Expenses | 1.7B | 941M |
| Gross Profit | 2.8B | 1.0B |
| EBITDA | 1.2B | 66M |
| EBIT | 957M | 0 |
| Interest Expense | 0 | 14M |
| Net Income | 737M | 160M |
| EPS | 3.04 | 3.25 |
| Fiscal Year | 2025 | 2025 |
Income Statement Analysis: The Bottom-Line Duel
This income statement comparison reveals each company’s operational efficiency and profitability trajectory over recent years.
Church & Dwight Co., Inc. Analysis
Church & Dwight’s revenue steadily climbs, reaching 6.2B in 2025, while net income shows volatility, dropping overall since 2021. Gross margins maintain a healthy 44.7%, reflecting cost control. The 2025 year highlights improved EBIT margin at 15.4% and a 23.9% net margin growth, signaling stronger bottom-line momentum despite modest revenue growth.
Nu Skin Enterprises, Inc. Analysis
Nu Skin’s revenue declines sharply by 14.3% in 2025 to 1.49B, yet net income rebounds to 160M, reversing prior losses. The company boasts a robust gross margin near 69.5%, but EBIT margin remains flat at zero, indicating operational challenges. The latest year shows a strong net margin improvement of 227.5%, fueled by expense reductions despite shrinking top-line.
Margin Resilience vs. Revenue Consistency
Church & Dwight delivers consistent revenue growth with solid margin expansion, but net income trends appear uneven. Nu Skin faces top-line contraction but achieves impressive profitability recovery and margin improvements. For investors, Church & Dwight offers steady scale and margin health, while Nu Skin presents a turnaround profile with higher margin upside potential.
Financial Ratios Comparison
These vital ratios act as a diagnostic tool to expose the underlying fiscal health, valuation premiums, and capital efficiency of the companies compared below:
| Ratios | Church & Dwight Co., Inc. (CHD) | Nu Skin Enterprises, Inc. (NUS) |
|---|---|---|
| ROE | 18.41% | 19.90% |
| ROIC | 11.19% | 4.62% |
| P/E | 27.62 | 2.96 |
| P/B | 5.08 | 0.59 |
| Current Ratio | 1.07 | 2.08 |
| Quick Ratio | 0.71 | 1.40 |
| D/E | 0.55 | 0.35 |
| Debt-to-Assets | 24.7% | 20.1% |
| Interest Coverage | 0 (not reported) | 4.71 |
| Asset Turnover | 0.70 | 1.06 |
| Fixed Asset Turnover | 7.54 | 3.29 |
| Payout Ratio | 39.0% | 7.39% |
| Dividend Yield | 1.41% | 2.50% |
| Fiscal Year | 2025 | 2025 |
Efficiency & Valuation Duel: The Vital Signs
Ratios act as a company’s DNA, exposing hidden risks and operational excellence beneath surface-level financials.
Church & Dwight Co., Inc.
Church & Dwight delivers strong profitability with an 18.4% ROE and 11.9% net margin, signaling operational efficiency. However, its valuation looks stretched, trading at a 27.6 P/E and 5.1 P/B, above sector averages. The company offers a modest 1.4% dividend yield, balancing shareholder returns with steady cash flow management.
Nu Skin Enterprises, Inc.
Nu Skin posts an impressive 19.9% ROE and a solid 10.8% net margin, reflecting profitable operations despite a weaker 4.6% ROIC. Its valuation remains attractive with a low 3.0 P/E and 0.6 P/B, indicating undervaluation. The firm supports shareholders through a 2.5% dividend yield, highlighting cash return amid cautious capital allocation.
Valuation Discipline vs. Operational Strength
Nu Skin shows a more balanced risk-reward profile with strong profitability and a very favorable valuation. Church & Dwight, while operationally robust, trades at a premium with some valuation risk. Investors seeking value and yield may prefer Nu Skin’s profile; those favoring established efficiency might lean toward Church & Dwight.
Which one offers the Superior Shareholder Reward?
Church & Dwight (CHD) delivers a steady dividend yield near 1.4% with a moderate payout ratio around 39%, supported by strong free cash flow coverage (~90%). Its buyback program, though less aggressive, complements dividends for consistent shareholder returns. Nu Skin (NUS) offers a higher dividend yield near 2.5% but with a very low payout ratio (~7%) and weaker free cash flow conversion (~57%), signaling cautious distribution. NUS also pursues share buybacks more actively, enhancing total returns despite recent operating volatility. I view CHD’s balanced, sustainable distribution strategy as superior for long-term investors in 2026, offering dependable income and capital appreciation with lower risk.
Comparative Score Analysis: The Strategic Profile
The radar chart reveals the fundamental DNA and trade-offs of Church & Dwight and Nu Skin, highlighting their core financial strengths and vulnerabilities:
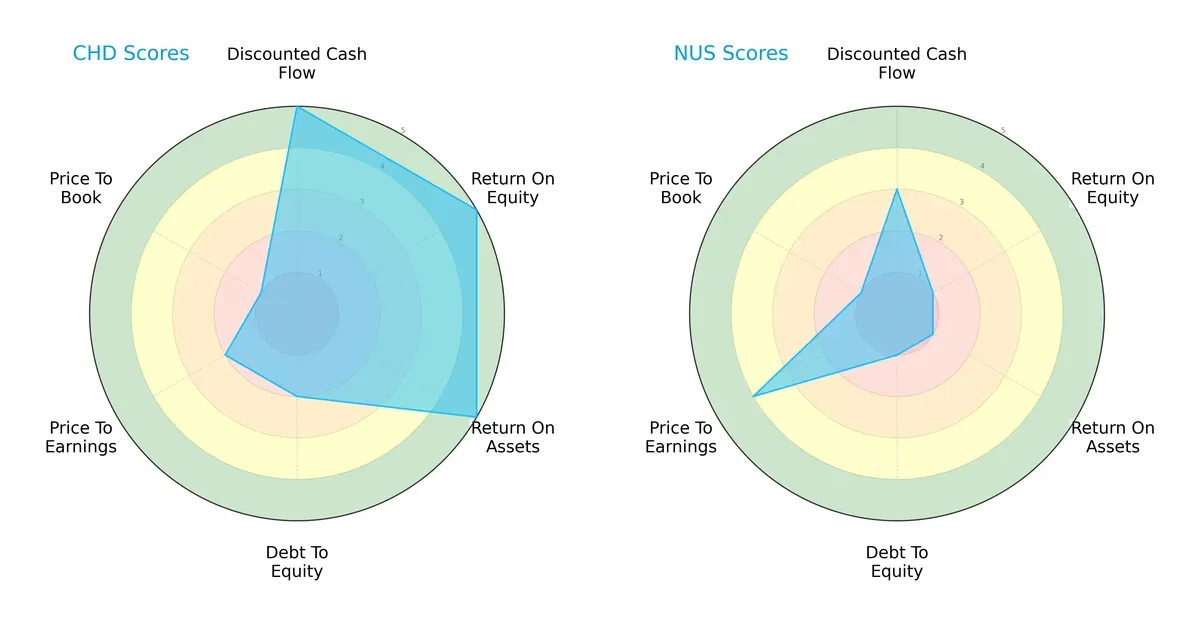
Church & Dwight dominates in DCF, ROE, and ROA, demonstrating operational efficiency and strong cash flow generation. Nu Skin lags on profitability and leverage but shows relative strength in valuation metrics like P/E. Church & Dwight’s profile is more balanced, while Nu Skin relies heavily on favorable valuation despite weaker fundamentals.
Bankruptcy Risk: Solvency Showdown
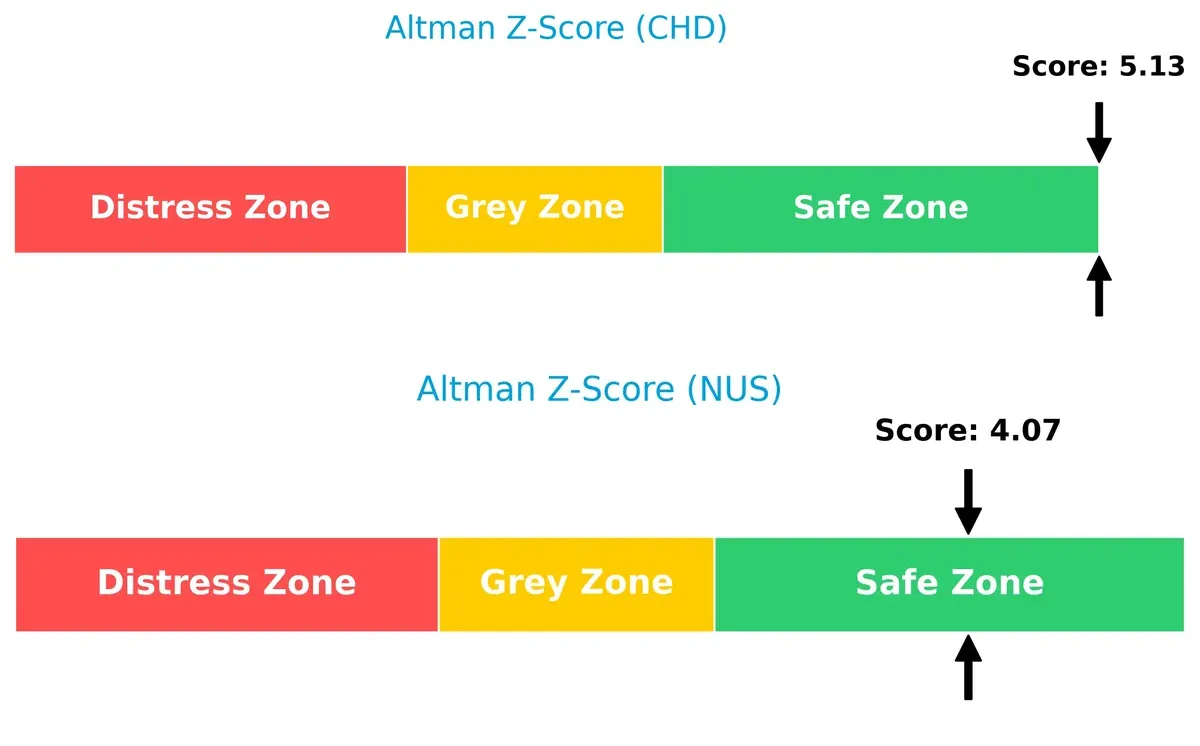
Church & Dwight’s Altman Z-Score of 5.13 versus Nu Skin’s 4.07 places both firms safely above distress thresholds, but Church & Dwight exhibits stronger long-term solvency and resilience in this economic cycle:
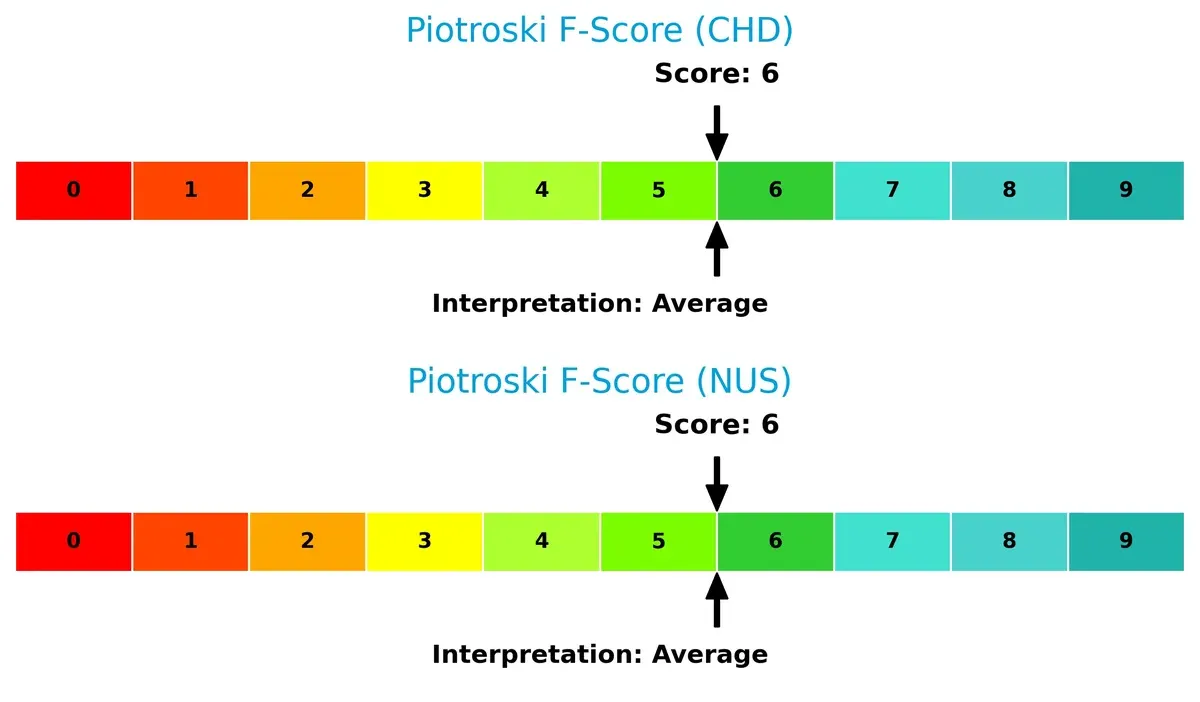
Financial Health: Quality of Operations
Both companies score a Piotroski F-Score of 6, indicating average financial health. Neither shows critical red flags, but this middling score suggests room for improvement in operational quality and balance sheet robustness:
How are the two companies positioned?
This section dissects the operational DNA of CHD and NUS by comparing their revenue distribution and internal dynamics. The goal is to confront their economic moats to reveal which model offers the most resilient competitive advantage today.
Revenue Segmentation: The Strategic Mix
The following comparison dissects how Church & Dwight and Nu Skin diversify their income streams and where their primary sector bets lie:
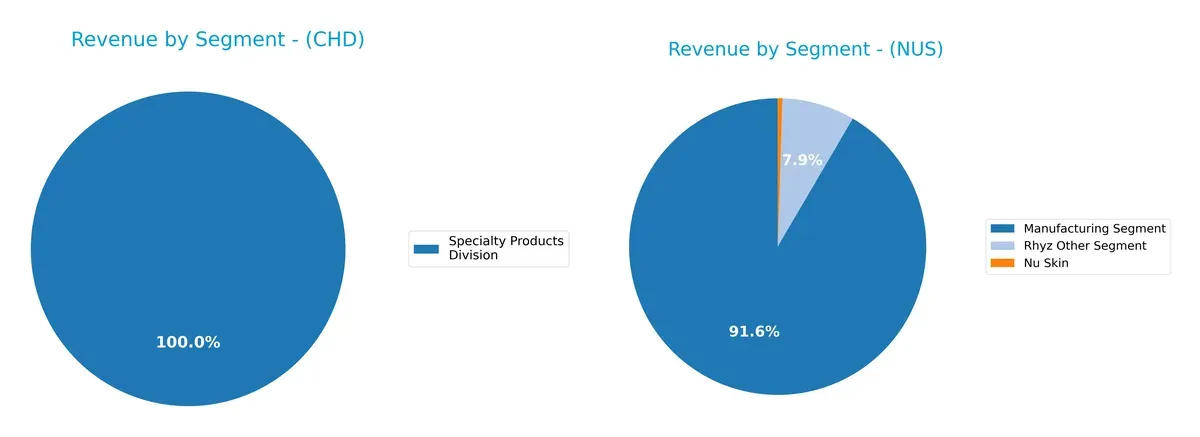
Church & Dwight relies exclusively on its Specialty Products Division, generating stable revenue around $300M annually, reflecting a focused business model. Nu Skin displays a more diversified mix, with Nu Skin segment revenues exceeding $1.1B in 2025, supported by Manufacturing at $206M and Rhyz Other at $18M. Nu Skin’s diversification reduces concentration risk, while Church & Dwight’s single-segment reliance highlights vulnerability but benefits from product specialization.
Strengths and Weaknesses Comparison
This table compares the Strengths and Weaknesses of Church & Dwight Co., Inc. and Nu Skin Enterprises, Inc.:
CHD Strengths
- Favorable profitability ratios with net margin at 11.88% and ROE at 18.41%
- Strong ROIC of 11.19% above WACC of 5.57%
- Debt to assets ratio at 24.74% is favorable
- High fixed asset turnover of 7.54 indicates efficient asset use
- Large global presence with $4.77B domestic and $1.13B international revenue
- Consistent specialty products revenue around $299M
NUS Strengths
- Very favorable overall financial ratios with 85.71% favorable
- High ROE at 19.9% but lower ROIC at 4.62%
- Favorable valuation multiples with P/E of 2.96 and P/B of 0.59
- Strong liquidity with current ratio of 2.08 and quick ratio 1.4
- Diversified geographic footprint across Americas, Europe, Asia with multiple segments
- Higher dividend yield at 2.5% and good asset turnover at 1.06
CHD Weaknesses
- Unfavorable valuation metrics with P/E of 27.62 and P/B of 5.08
- Quick ratio at 0.71 signals weaker short-term liquidity
- Moderate current ratio at 1.07 may raise working capital concerns
- Lower asset turnover at 0.7 suggests less efficient asset use compared to peers
- Limited product diversification, mainly specialty products division
- Dividend yield is neutral at 1.41%
NUS Weaknesses
- Unfavorable ROIC below WACC signals potential capital allocation inefficiency
- Interest coverage at zero indicates financial stress on debt servicing
- Smaller manufacturing segment revenue of $206M compared to main segment
- Lower fixed asset turnover at 3.29 versus CHD’s 7.54
- Global revenue more fragmented, possibly complicating operations
- Net margin slightly lower at 10.79% compared to CHD
Both companies show clear strengths in profitability and global reach but differ in capital efficiency and liquidity profiles. CHD’s higher ROIC and asset turnover contrast with NUS’s stronger liquidity and valuation metrics. These differences imply distinct strategic priorities in asset management and market positioning.
The Moat Duel: Analyzing Competitive Defensibility
A strong structural moat protects long-term profits from relentless competition erosion. Let’s dissect the defensive barriers of Church & Dwight and Nu Skin:
Church & Dwight Co., Inc.: Intangible Assets and Brand Power
Church & Dwight leverages its iconic brands like ARM & HAMMER to sustain high margins and a 5.6% ROIC premium over WACC. Despite a recent ROIC decline, its product diversification and steady domestic growth deepen its moat in 2026.
Nu Skin Enterprises, Inc.: Innovation and Direct Sales Network
Nu Skin’s moat hinges on its proprietary ageLOC technology and multi-level marketing channel. However, a negative ROIC spread and sharp profitability decline signal weakening competitive defensibility. Expansion into Asia-Pacific remains a key opportunity to regain ground.
Brand Legacy vs. Innovation Edge: The Moat Showdown
Church & Dwight’s wider moat stems from robust brand equity and consistent value creation. Nu Skin’s shrinking ROIC and value destruction expose vulnerability. Church & Dwight is better positioned to defend market share amid evolving consumer trends.
Which stock offers better returns?
Over the past 12 months, both stocks show bearish trends with notable price fluctuations and shifts in trading volume dynamics.
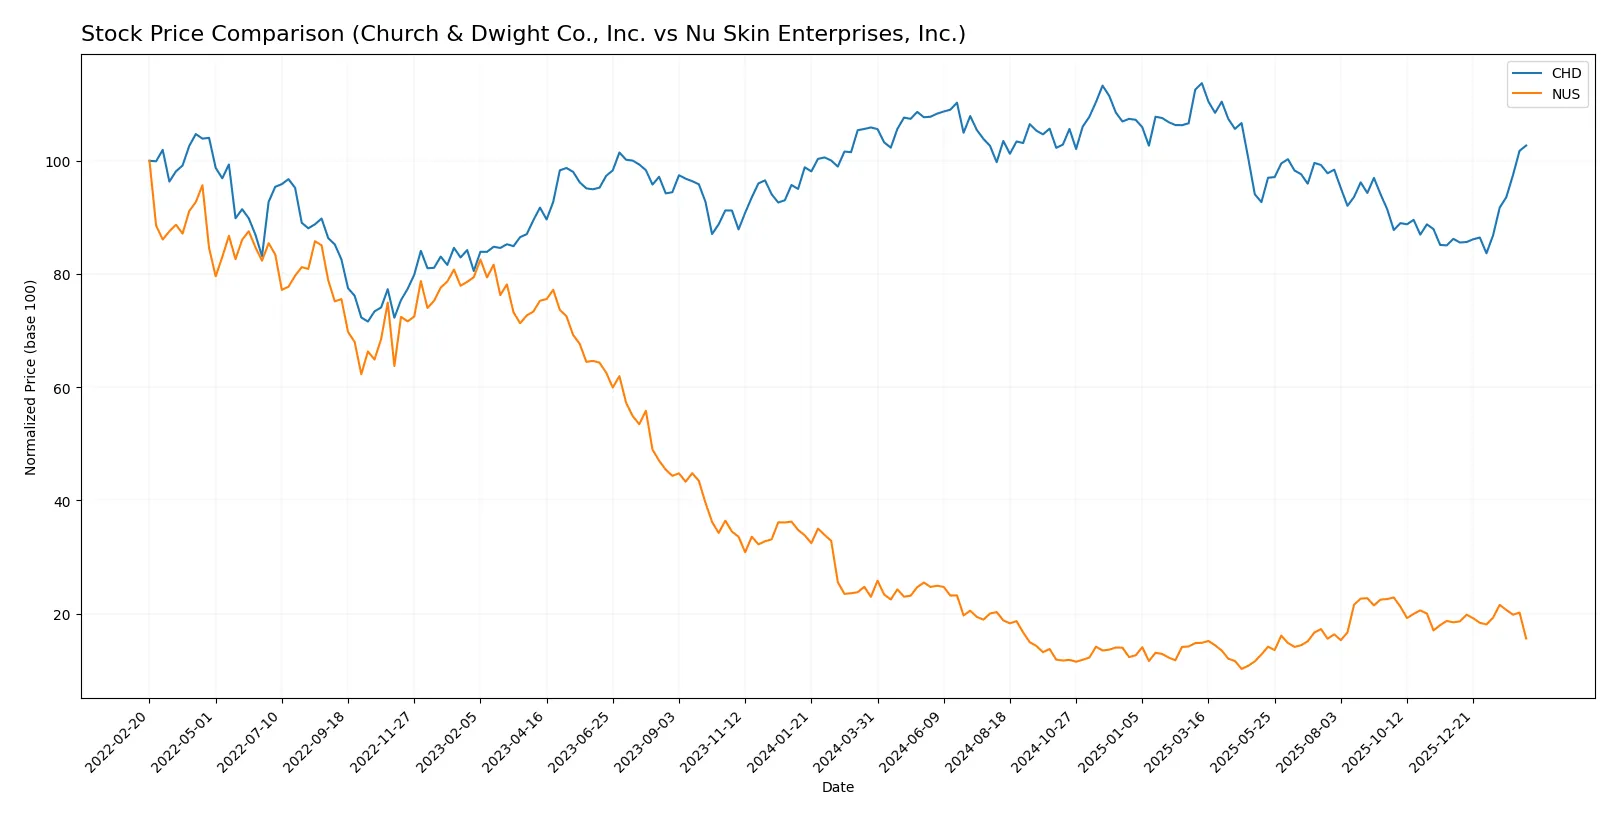
Trend Comparison
Church & Dwight Co., Inc. (CHD) posted a -3.01% price decline over the past year, signaling a bearish trend with accelerating downward momentum. The stock ranged between 82.64 and 112.33, showing increased volatility (std dev 7.81).
Nu Skin Enterprises, Inc. (NUS) suffered a steeper 32.03% drop over the same period, confirming a bearish trend with accelerating pressure. Its price fluctuated between 5.48 and 13.83, but volatility remained modest (std dev 2.26).
CHD’s smaller decline and strong recent buyer dominance contrast with NUS’s deeper losses and seller dominance, indicating CHD delivered the better market performance overall.
Target Prices
Analysts present a clear target consensus for Church & Dwight and Nu Skin Enterprises.
| Company | Target Low | Target High | Consensus |
|---|---|---|---|
| Church & Dwight Co., Inc. | 82 | 105 | 97.9 |
| Nu Skin Enterprises, Inc. | 11 | 11 | 11 |
The target consensus for Church & Dwight sits slightly below its current price of 101.45, suggesting limited upside. Nu Skin’s consensus price of 11 significantly exceeds its current 8.36, indicating potential recovery.

Don’t Let Luck Decide Your Entry Point
Optimize your entry points with our advanced ProRealTime indicators. You’ll get efficient buy signals with precise price targets for maximum performance. Start outperforming now!
How do institutions grade them?
Church & Dwight Co., Inc. Grades
The following table summarizes recent grades from reputable financial institutions for Church & Dwight Co., Inc.:
| Grading Company | Action | New Grade | Date |
|---|---|---|---|
| Evercore ISI Group | Maintain | In Line | 2026-02-02 |
| JP Morgan | Upgrade | Neutral | 2026-02-02 |
| Wells Fargo | Maintain | Overweight | 2026-02-02 |
| Citigroup | Maintain | Neutral | 2026-02-02 |
| Morgan Stanley | Maintain | Equal Weight | 2026-02-02 |
| Jefferies | Maintain | Buy | 2026-02-02 |
| Jefferies | Maintain | Buy | 2026-01-28 |
| UBS | Maintain | Neutral | 2026-01-14 |
| TD Cowen | Maintain | Hold | 2026-01-08 |
| Wells Fargo | Maintain | Overweight | 2026-01-05 |
Nu Skin Enterprises, Inc. Grades
The following table shows recent grades from recognized financial firms for Nu Skin Enterprises, Inc.:
| Grading Company | Action | New Grade | Date |
|---|---|---|---|
| DA Davidson | Maintain | Neutral | 2024-12-20 |
| Citigroup | Maintain | Neutral | 2024-10-22 |
| DA Davidson | Maintain | Neutral | 2024-08-12 |
| Citigroup | Maintain | Neutral | 2024-08-09 |
| DA Davidson | Maintain | Neutral | 2024-05-09 |
| DA Davidson | Maintain | Neutral | 2024-01-05 |
| Stifel | Maintain | Hold | 2023-10-16 |
| Stifel | Maintain | Hold | 2023-10-15 |
| Citigroup | Maintain | Neutral | 2023-09-29 |
| Citigroup | Maintain | Neutral | 2023-09-28 |
Which company has the best grades?
Church & Dwight Co., Inc. holds generally stronger grades, including multiple “Buy” and “Overweight” ratings, compared to Nu Skin Enterprises, Inc.’s consistent “Neutral” and “Hold” marks. This difference may influence investors seeking higher conviction from institutional analysts.
Risks specific to each company
The following categories identify critical pressure points and systemic threats facing Church & Dwight Co., Inc. and Nu Skin Enterprises, Inc. in the 2026 market environment:
1. Market & Competition
Church & Dwight Co., Inc.
- Operates in a mature household products sector with steady demand but intense brand competition.
Nu Skin Enterprises, Inc.
- Faces fierce competition in the beauty and wellness space, with pressure from innovative direct-selling models.
2. Capital Structure & Debt
Church & Dwight Co., Inc.
- Moderate leverage with debt-to-assets at 24.7%, interest coverage infinite, showing solid debt management.
Nu Skin Enterprises, Inc.
- Lower debt-to-assets at 20.1% but zero interest coverage raises red flags on debt servicing ability.
3. Stock Volatility
Church & Dwight Co., Inc.
- Beta of 0.47 indicates low volatility; stock price stable within $81-$116 range.
Nu Skin Enterprises, Inc.
- Beta near 1.0 shows market-level volatility; recent 18% price drop signals higher risk.
4. Regulatory & Legal
Church & Dwight Co., Inc.
- Operates in multiple regulated consumer product segments with moderate compliance risk.
Nu Skin Enterprises, Inc.
- Faces heightened scrutiny due to direct selling practices and international operations, increasing legal risk.
5. Supply Chain & Operations
Church & Dwight Co., Inc.
- Diverse supplier base and strong operational efficiency with high fixed asset turnover at 7.54.
Nu Skin Enterprises, Inc.
- Relies heavily on global supply chain; asset turnover lower at 3.29, reflecting operational challenges.
6. ESG & Climate Transition
Church & Dwight Co., Inc.
- Established sustainability initiatives in consumer products; ESG risks moderate but manageable.
Nu Skin Enterprises, Inc.
- ESG risks higher due to international footprint and product claims in wellness sector.
7. Geopolitical Exposure
Church & Dwight Co., Inc.
- Primarily US-based with international sales; geopolitical risks limited but present.
Nu Skin Enterprises, Inc.
- Significant exposure to Mainland China retail and service centers, increasing geopolitical uncertainty.
Which company shows a better risk-adjusted profile?
Church & Dwight’s strongest risk is modest liquidity ratios, potentially impacting short-term flexibility. Nu Skin’s dominant risk is weak interest coverage and recent stock volatility, signaling financial stress. I see Church & Dwight as having the better risk-adjusted profile supported by its superior Altman Z-score (5.13) and stable market position. Nu Skin’s recent 18% price plunge and zero interest coverage amplify caution for investors.
Final Verdict: Which stock to choose?
Church & Dwight’s superpower lies in its robust value creation and strong profitability metrics. It maintains a healthy economic moat with returns well above its cost of capital, signaling efficient capital deployment. A point of vigilance is its slightly elevated valuation multiples, which may pressure near-term upside. It fits well in portfolios seeking steady, quality growth.
Nu Skin’s strategic moat is its lean capital structure combined with attractive valuation multiples. It offers a compelling entry point for value-oriented investors, supported by a very favorable score profile and solid liquidity. Relative to Church & Dwight, it carries more operational risk given its declining ROIC trend, but rewards patience. It suits portfolios focused on turnaround potential and deep value.
If you prioritize durable economic moats and consistent profitability, Church & Dwight outshines due to its superior capital efficiency and income quality. However, if you seek deep value with potential upside from operational recovery, Nu Skin offers better stability in valuation and balance sheet strength despite profitability headwinds. Both present distinct analytical scenarios tailored to different investor risk appetites.
Disclaimer: Investment carries a risk of loss of initial capital. The past performance is not a reliable indicator of future results. Be sure to understand risks before making an investment decision.
Go Further
I encourage you to read the complete analyses of Church & Dwight Co., Inc. and Nu Skin Enterprises, Inc. to enhance your investment decisions: