Home > Comparison > Consumer Defensive > CHD vs NWL
The strategic rivalry between Church & Dwight Co., Inc. and Newell Brands Inc. shapes the competitive landscape of the household and personal products sector. Church & Dwight operates as a focused consumer products manufacturer with strong brand portfolios. Newell Brands, by contrast, spans diverse consumer and commercial product segments with a broad operational footprint. This analysis evaluates which company presents a superior risk-adjusted investment opportunity for a diversified portfolio amid evolving market dynamics.
Table of contents
Companies Overview
Church & Dwight and Newell Brands hold pivotal roles in the household and personal products sector.
Church & Dwight Co., Inc.: Specialty Consumer Products Leader
Church & Dwight dominates with a diverse portfolio of household and personal care products driven by brands like ARM & HAMMER and OXICLEAN. Its revenue stems from consumer staples such as cleaning agents, oral care, and specialty animal nutrition products. In 2026, the company emphasizes expanding its international consumer segment and specialty product innovation to sustain growth.
Newell Brands Inc.: Diverse Consumer Goods Conglomerate
Newell Brands operates across five segments, including commercial solutions and home appliances, generating revenue through a broad brand spectrum like Rubbermaid and Coleman. It focuses strategically on diversifying product lines and strengthening e-commerce channels to capture wider market penetration in 2026. The company’s scale supports its vast global distribution network.
Strategic Collision: Similarities & Divergences
Both companies compete in household and personal products but differ in approach. Church & Dwight leans on specialty products and brand depth, while Newell embraces a broader, multi-segment portfolio. Their battleground centers on consumer loyalty and product innovation amid evolving retail landscapes. This contrast defines distinct investment profiles: focused niche strength versus diversified scale and reach.
Income Statement Comparison
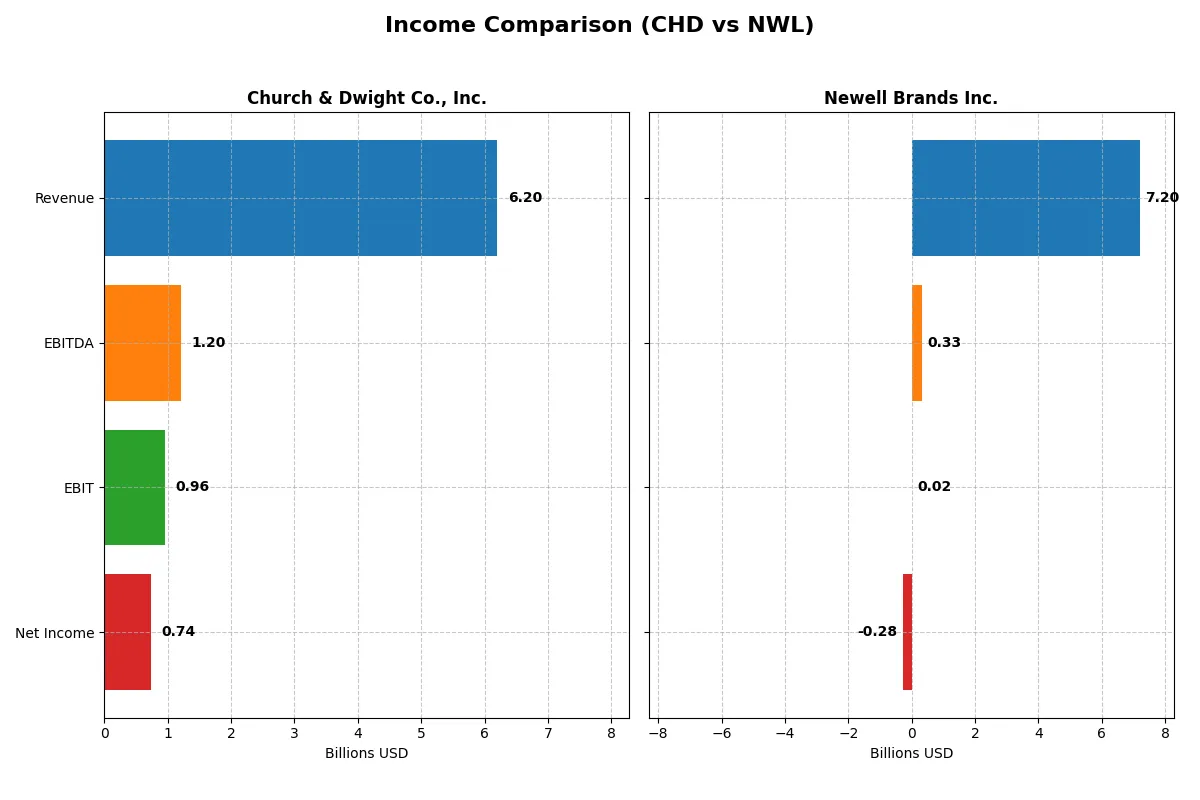
This data dissects the core profitability and scalability of both corporate engines to reveal who dominates the bottom line:
| Metric | Church & Dwight Co., Inc. (CHD) | Newell Brands Inc. (NWL) |
|---|---|---|
| Revenue | 6.2B | 7.2B |
| Cost of Revenue | 3.4B | 4.8B |
| Operating Expenses | 1.7B | 2.0B |
| Gross Profit | 2.8B | 2.4B |
| EBITDA | 1.2B | 331M |
| EBIT | 957M | 20M |
| Interest Expense | 0 | 321M |
| Net Income | 737M | -285M |
| EPS | 3.04 | -0.68 |
| Fiscal Year | 2025 | 2025 |
Income Statement Analysis: The Bottom-Line Duel
This income statement comparison reveals the true operational efficiency and profitability trends of two distinct corporate engines over recent years.
Church & Dwight Co., Inc. Analysis
Church & Dwight’s revenue steadily rises from 5.19B in 2021 to 6.20B in 2025, showing solid top-line growth. Net income fluctuates but remains positive, peaking at 827M in 2021 and settling at 737M in 2025. Gross margins stay favorable near 45%, signaling strong cost control, while net margins improve significantly in 2025, reflecting enhanced bottom-line momentum and operational efficiency.
Newell Brands Inc. Analysis
Newell’s revenue declines from 10.59B in 2021 to 7.20B in 2025, indicating a shrinking scale. Net income turns negative starting 2023, with a loss of 285M in 2025. Despite a gross margin around 34%, the net margin drops to -4% in 2025, highlighting weak profitability. Operating income shrank sharply, pointing to deteriorating efficiency and sustained pressure on earnings.
Margin Strength vs. Revenue Contraction
Church & Dwight outperforms Newell Brands by maintaining profitable growth and solid margins despite slower revenue growth. Newell’s shrinking revenue and persistent losses mark a clear disadvantage. For investors, Church & Dwight’s stable margin profile and positive earnings momentum offer a more resilient and attractive earnings model.
Financial Ratios Comparison
These vital ratios act as a diagnostic tool to expose the underlying fiscal health, valuation premiums, and capital efficiency of the companies compared below:
| Ratios | Church & Dwight Co., Inc. (CHD) | Newell Brands Inc. (NWL) |
|---|---|---|
| ROE | 18.41% | -11.92% |
| ROIC | 11.19% | 5.09% |
| P/E | 27.62 | -5.46 |
| P/B | 5.08 | 0.65 |
| Current Ratio | 1.07 | 1.07 |
| Quick Ratio | 0.71 | 0.57 |
| D/E | 0.55 | 2.32 |
| Debt-to-Assets | 24.74% | 51.69% |
| Interest Coverage | 0 (not available) | 1.39 |
| Asset Turnover | 0.70 | 0.67 |
| Fixed Asset Turnover | 7.54 | 4.33 |
| Payout ratio | 38.98% | -42.11% |
| Dividend yield | 1.41% | 7.71% |
| Fiscal Year | 2025 | 2025 |
Efficiency & Valuation Duel: The Vital Signs
Financial ratios act as a company’s DNA, unveiling hidden risks and operational strengths that shape investor decisions.
Church & Dwight Co., Inc.
Church & Dwight posts strong profitability, with an 18.4% ROE and 11.9% net margin signaling efficient operations. The stock trades at a stretched P/E of 27.6 and a high P/B of 5.1, indicating premium valuation. Shareholders receive a moderate 1.4% dividend yield, reflecting balanced capital return and reinvestment discipline.
Newell Brands Inc.
Newell endures profitability challenges, with a negative ROE of -11.9% and a -4.0% net margin, showing operational strain. Its valuation appears cheap, with a negative P/E and a low P/B of 0.65, suggesting market skepticism. The firm offers a healthy 7.7% dividend yield despite weaker fundamentals, indicating a focus on shareholder income amid difficulties.
Valuation Premium vs. Profitability Resilience
Church & Dwight delivers superior profitability and moderate dividend returns but at a premium valuation. Newell offers an attractive yield and low valuation yet suffers from poor profitability and high leverage. Investors prioritizing operational strength may lean toward Church & Dwight, while income-focused profiles might find Newell’s yield compelling despite risks.
Which one offers the Superior Shareholder Reward?
Church & Dwight (CHD) offers a more balanced and sustainable shareholder reward than Newell Brands (NWL) in 2026. CHD pays a steady dividend with a 1.41% yield and a prudent 39% payout ratio, well covered by free cash flow (4.5/share), while maintaining aggressive buybacks. NWL, despite a higher dividend yield of 7.7%, struggles with negative net margins and minimal free cash flow (0.04/share), making its dividend and buybacks less sustainable. I see CHD’s disciplined capital allocation and healthy cash flow as superior for long-term total returns.
Comparative Score Analysis: The Strategic Profile
The radar chart reveals the fundamental DNA and trade-offs of Church & Dwight and Newell Brands, illustrating their contrasting strategic strengths and weaknesses:
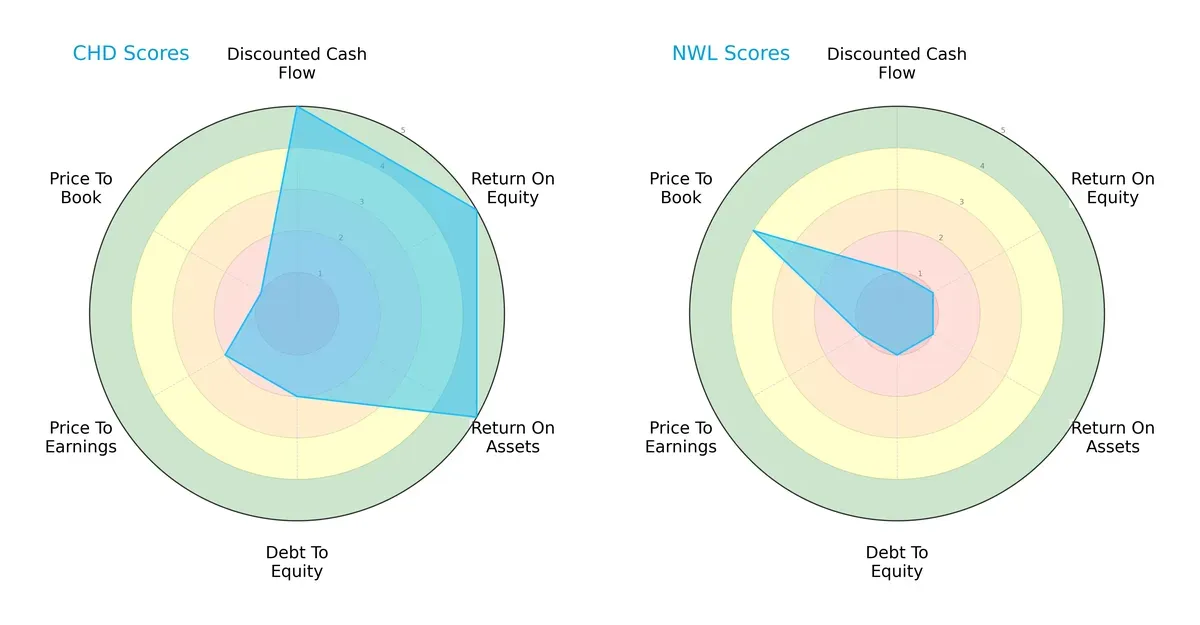
Church & Dwight dominates in DCF, ROE, and ROA scores, reflecting robust profitability and cash flow generation. However, its higher debt-to-equity and poor valuation metrics show financial leverage concerns and potential overpricing. Newell Brands displays a more favorable price-to-book score but suffers across profitability and leverage metrics, indicating reliance on valuation rather than operational strength. Church & Dwight maintains a more balanced profile, while Newell leans heavily on valuation appeal.
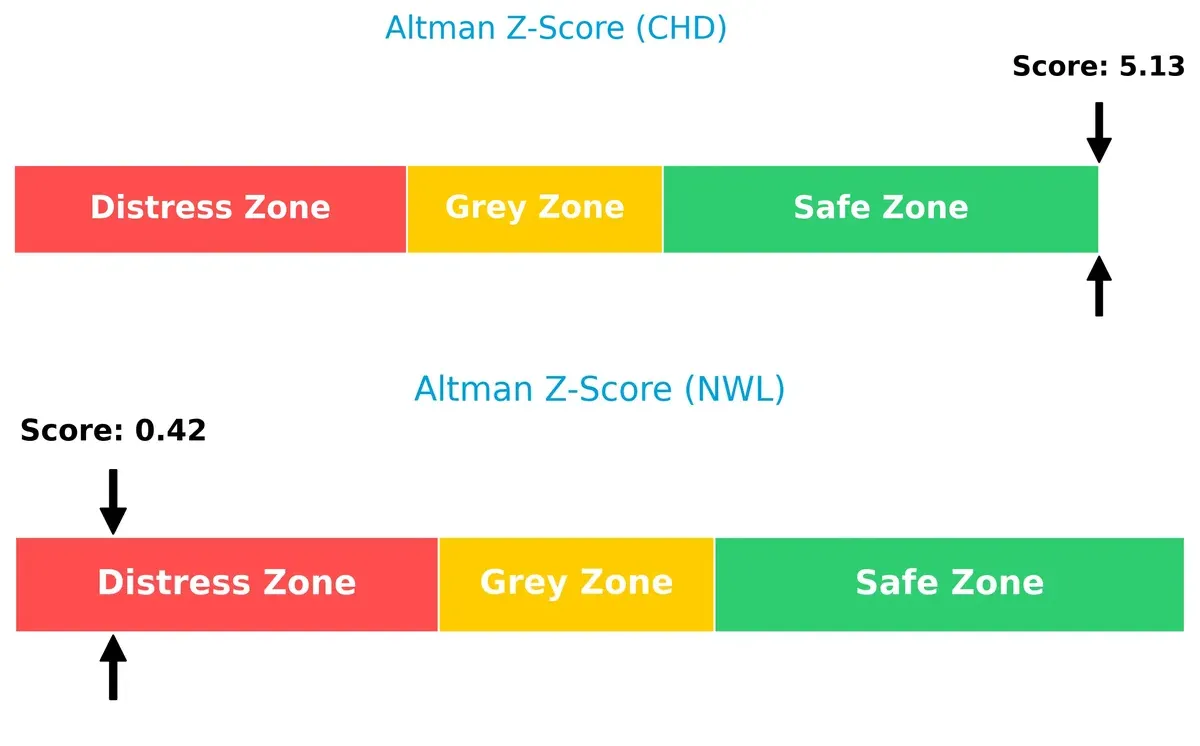
Bankruptcy Risk: Solvency Showdown
Church & Dwight’s Altman Z-Score of 5.1 places it firmly in the safe zone, signaling strong solvency. Newell Brands, with a score of 0.4, sits deep in the distress zone, warning of elevated bankruptcy risk in this cycle:
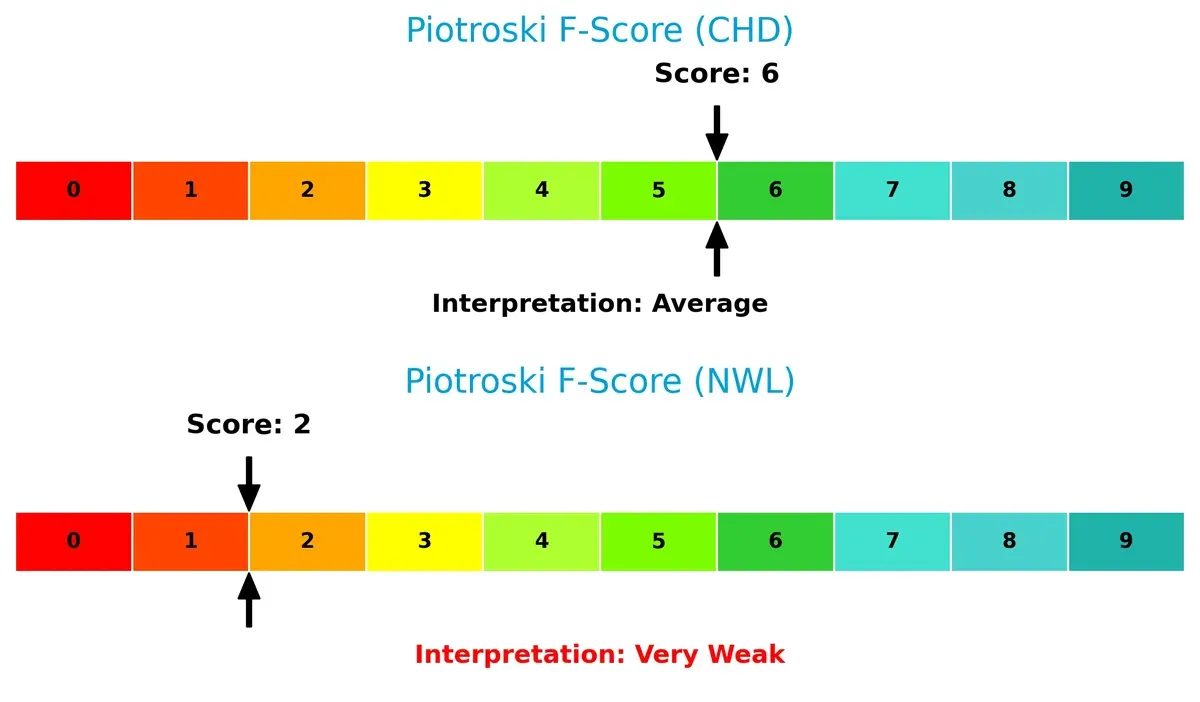
Financial Health: Quality of Operations
Church & Dwight’s Piotroski F-Score of 6 indicates average financial health with solid internal metrics. Newell Brands scores a weak 2, flagging red flags in profitability and operational efficiency compared to its peer:
How are the two companies positioned?
This section dissects the operational DNA of CHD and NWL by comparing their revenue distribution and internal dynamics. The goal is to confront their economic moats and identify the more resilient, sustainable competitive advantage today.
Revenue Segmentation: The Strategic Mix
This visual comparison dissects how both firms diversify their income streams and reveals their primary sector bets for investors to consider:
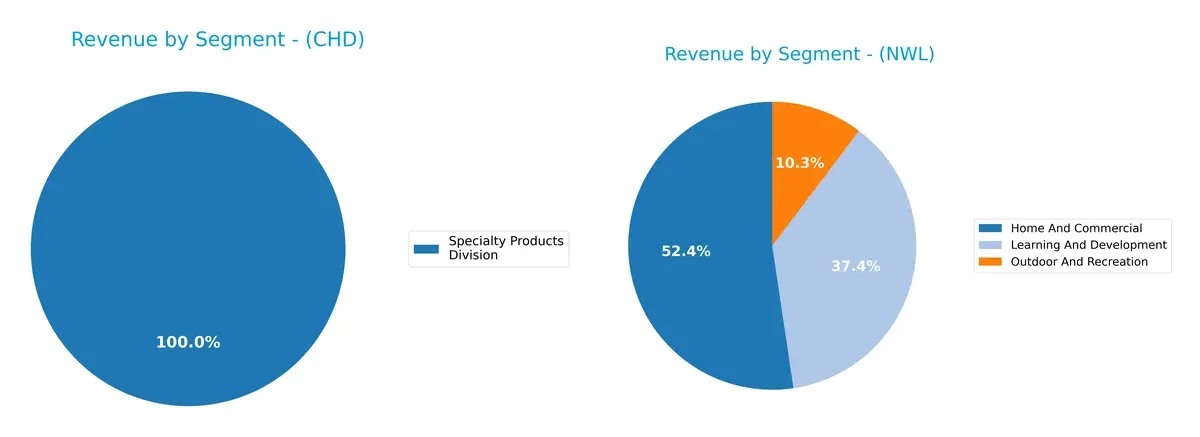
Church & Dwight Co., Inc. relies almost exclusively on its Specialty Products Division, generating about $299M in 2025, signaling concentrated exposure. Newell Brands Inc. dwarfs this with a broad portfolio, anchoring revenue in Home And Commercial ($3.77B), Learning And Development ($2.69B), and Outdoor And Recreation ($741M). Newell’s diversified mix reduces concentration risk, while Church & Dwight’s focus may heighten vulnerability but allows niche dominance.
Strengths and Weaknesses Comparison
This table compares the Strengths and Weaknesses of Church & Dwight Co., Inc. (CHD) and Newell Brands Inc. (NWL):
CHD Strengths
- Strong profitability with 11.88% net margin and 18.41% ROE
- Favorable ROIC above WACC at 11.19%
- Low debt-to-assets at 24.74% limits financial risk
- High fixed asset turnover at 7.54 indicates efficient asset use
- Stable domestic and international consumer revenue streams
NWL Strengths
- Diverse product segments with large revenues in Home, Learning, and Outdoor
- Favorable valuation metrics with PE and PB ratios below 1
- Favorable WACC supports cost of capital management
- High dividend yield at 7.71% attracts income-focused investors
- Global footprint spans North America, EMEA, Latin America, and Asia Pacific
CHD Weaknesses
- Limited product diversification, Specialty Products division dominates revenue
- Unfavorable high PE (27.62) and PB (5.08) indicate premium valuation
- Quick ratio below 1 at 0.71 may strain short-term liquidity
- Moderate asset turnover at 0.7 limits revenue generation from assets
NWL Weaknesses
- Negative net margin (-3.96%) and ROE (-11.92%) indicate profitability challenges
- High debt-to-equity (2.32) and debt-to-assets (51.69%) increase leverage risk
- Interest coverage very low at 0.06 suggests difficulty servicing debt
- Quick ratio at 0.57 indicates weak liquidity position
Church & Dwight’s strengths lie in solid profitability and conservative leverage, though product concentration and valuation remain concerns. Newell Brands shows broad diversification and attractive yield but faces significant profitability and financial risk challenges. These factors are critical in shaping each company’s strategic priorities.
The Moat Duel: Analyzing Competitive Defensibility
A structural moat is the only thing protecting long-term profits from the erosion of competition. Let’s analyze the core competitive advantages:
Church & Dwight Co., Inc.: Brand Power with Cost Advantage
Church & Dwight’s moat stems from strong brand equity and cost advantage, reflected in a favorable 44.7% gross margin and stable net margin near 12%. Despite a declining ROIC trend, its diverse consumer products and expanding international presence offer growth potential in 2026.
Newell Brands Inc.: Diversified Product Portfolio Facing Margin Pressure
Newell relies on a broad brand portfolio but lacks Church & Dwight’s cost edge, shown by a weaker 33.8% gross margin and negative net margin. The company is shedding value with a declining ROIC and shrinking revenues, signaling risk in defending market share.
Cost Leadership vs. Portfolio Complexity: The Moat Battle
Church & Dwight holds a wider, more sustainable moat with consistent value creation and margin stability. Newell’s declining profitability and value destruction leave it poorly equipped to fend off competition in 2026 and beyond.
Which stock offers better returns?
The past year shows contrasting price dynamics for Church & Dwight and Newell Brands, with both experiencing overall declines but recent sharp rallies from late 2025 to early 2026.
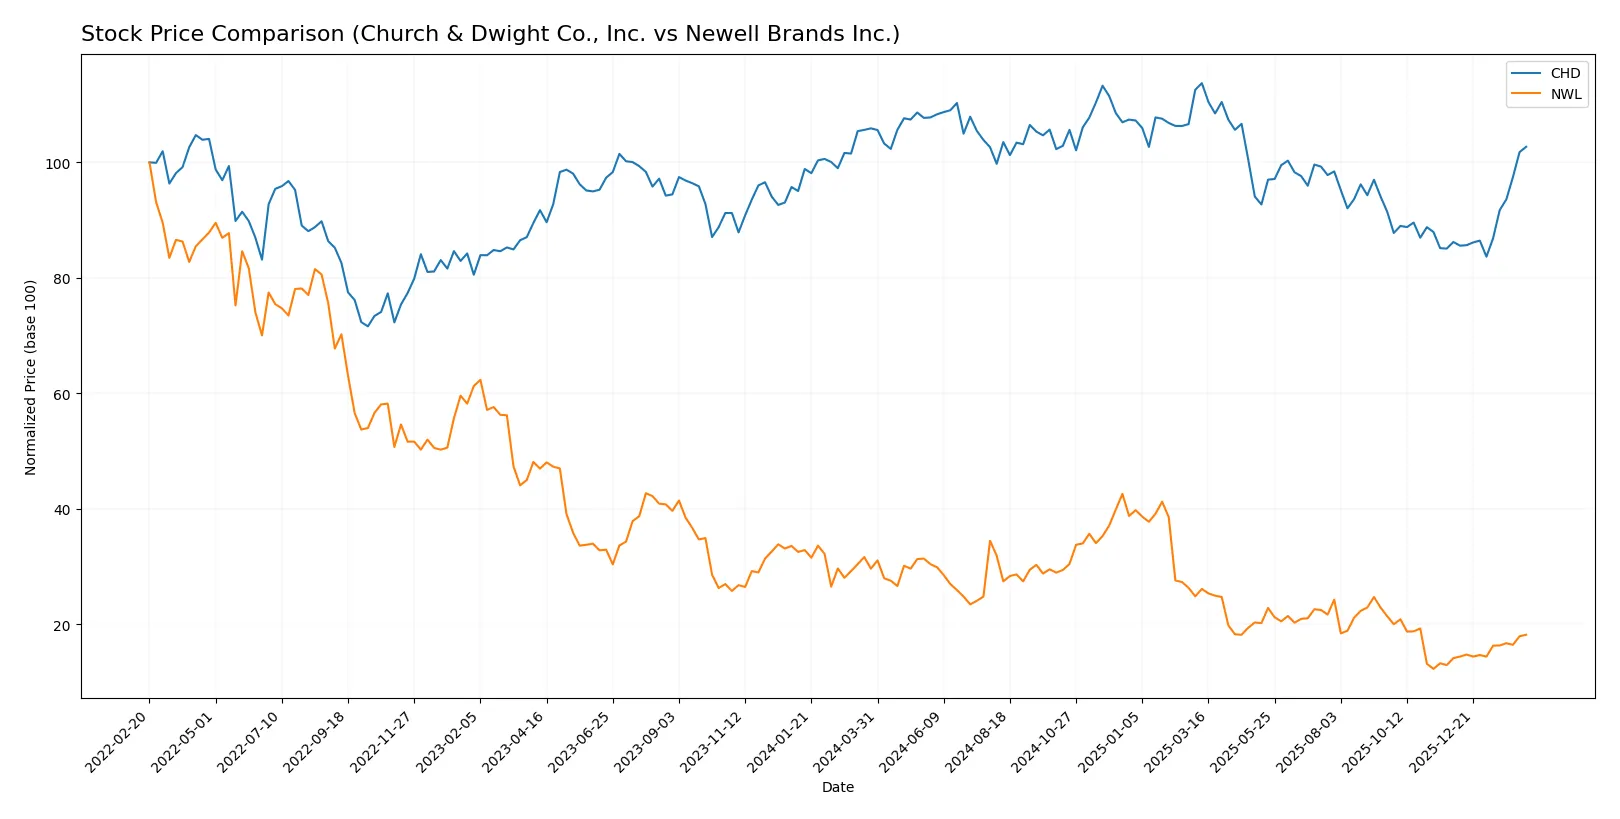
Trend Comparison
Church & Dwight’s stock fell 3.01% over the past year, marking a bearish trend with accelerating decline. The price ranged from $82.64 to $112.33, showing recent strong recovery of 19.13% since November 2025.
Newell Brands’ stock declined sharply by 38.64% in the past year, also bearish with accelerating losses. Prices fluctuated between $3.17 and $11.01, followed by a 28.77% rebound starting late 2025, though with low volatility.
Newell Brands suffered a far steeper annual decline but shows a stronger recent rebound. Church & Dwight’s smaller loss and recent rally suggest comparatively better market performance.
Target Prices
Analysts present a mixed but clear target consensus for both Church & Dwight Co., Inc. and Newell Brands Inc.
| Company | Target Low | Target High | Consensus |
|---|---|---|---|
| Church & Dwight Co., Inc. | 82 | 105 | 97.9 |
| Newell Brands Inc. | 4.5 | 8 | 5.83 |
Church & Dwight’s consensus target of 97.9 sits just below its current price of 101.45, suggesting moderate upside risk. Newell Brands’ consensus of 5.83 exceeds its current 4.7 price, indicating potential for appreciation.

Don’t Let Luck Decide Your Entry Point
Optimize your entry points with our advanced ProRealTime indicators. You’ll get efficient buy signals with precise price targets for maximum performance. Start outperforming now!
How do institutions grade them?
Church & Dwight Co., Inc. Grades
The table below summarizes recent grades from key institutional analysts for Church & Dwight Co., Inc.:
| Grading Company | Action | New Grade | Date |
|---|---|---|---|
| Evercore ISI Group | maintain | In Line | 2026-02-02 |
| JP Morgan | upgrade | Neutral | 2026-02-02 |
| Wells Fargo | maintain | Overweight | 2026-02-02 |
| Citigroup | maintain | Neutral | 2026-02-02 |
| Morgan Stanley | maintain | Equal Weight | 2026-02-02 |
| Jefferies | maintain | Buy | 2026-02-02 |
| Jefferies | maintain | Buy | 2026-01-28 |
| UBS | maintain | Neutral | 2026-01-14 |
| TD Cowen | maintain | Hold | 2026-01-08 |
| Wells Fargo | maintain | Overweight | 2026-01-05 |
Newell Brands Inc. Grades
The table below summarizes recent grades from key institutional analysts for Newell Brands Inc.:
| Grading Company | Action | New Grade | Date |
|---|---|---|---|
| Morgan Stanley | maintain | Equal Weight | 2026-02-10 |
| Citigroup | maintain | Neutral | 2026-02-09 |
| Canaccord Genuity | maintain | Buy | 2026-01-26 |
| UBS | maintain | Neutral | 2026-01-14 |
| Citigroup | maintain | Neutral | 2026-01-14 |
| Citigroup | maintain | Neutral | 2025-12-17 |
| UBS | maintain | Neutral | 2025-12-02 |
| JP Morgan | maintain | Overweight | 2025-11-03 |
| RBC Capital | maintain | Sector Perform | 2025-11-03 |
| Citigroup | maintain | Neutral | 2025-11-03 |
Which company has the best grades?
Church & Dwight displays more Buy and Overweight ratings, reflecting stronger analyst conviction. Newell’s grades mostly cluster at Neutral and Equal Weight, signaling cautious optimism. Investors may perceive Church & Dwight as having a slightly more favorable outlook.
Risks specific to each company
The following categories identify critical pressure points and systemic threats facing Church & Dwight Co., Inc. and Newell Brands Inc. in the 2026 market environment:
1. Market & Competition
Church & Dwight Co., Inc.
- Strong brand portfolio with ARM & HAMMER and TROJAN, sustaining competitive moat.
Newell Brands Inc.
- Diverse segments but struggling with negative margins and weaker profitability.
2. Capital Structure & Debt
Church & Dwight Co., Inc.
- Moderate debt-to-equity (0.55), manageable leverage, and infinite interest coverage.
Newell Brands Inc.
- High debt-to-equity (2.32) and poor interest coverage (0.06) pose significant financial risk.
3. Stock Volatility
Church & Dwight Co., Inc.
- Low beta (0.468) indicates stable stock with below-market volatility.
Newell Brands Inc.
- Higher beta (0.929) suggests increased sensitivity to market swings.
4. Regulatory & Legal
Church & Dwight Co., Inc.
- Operates in consumer defensive sector with steady regulatory environment.
Newell Brands Inc.
- Exposure to multiple segments increases regulatory complexity and risk.
5. Supply Chain & Operations
Church & Dwight Co., Inc.
- Efficient asset turnover (0.7) and high fixed asset turnover (7.54) reflect operational strength.
Newell Brands Inc.
- Neutral asset turnover (0.67) and lower fixed asset turnover (4.33) may indicate operational inefficiencies.
6. ESG & Climate Transition
Church & Dwight Co., Inc.
- Commitment to sustainable products under specialty segments; moderate ESG risk.
Newell Brands Inc.
- Larger company size complicates ESG integration; potential lag in climate transition efforts.
7. Geopolitical Exposure
Church & Dwight Co., Inc.
- Primarily US-based with some international exposure; geopolitical risk is contained.
Newell Brands Inc.
- Broader global footprint raises vulnerability to international trade tensions.
Which company shows a better risk-adjusted profile?
Church & Dwight faces its greatest risk in its elevated valuation multiples, which may limit upside despite solid fundamentals. Newell’s most impactful risk is its heavy debt load and financial distress signals, including a distress-zone Altman Z-score. Overall, Church & Dwight’s conservative leverage, stable margins, and market resilience grant it a superior risk-adjusted profile. Newell’s weak profitability and liquidity ratios highlight ongoing recovery challenges. The recent sharp contrast in interest coverage—effectively infinite for Church & Dwight versus near-default for Newell—justifies my heightened concern over Newell’s financial stability.
Final Verdict: Which stock to choose?
Church & Dwight (CHD) stands out for its robust capital efficiency and consistent value creation, delivering solid returns above its cost of capital. Its main point of vigilance is a stretched valuation relative to earnings, which could temper near-term upside. CHD suits investors seeking steady income with moderate growth in a balanced portfolio.
Newell Brands (NWL) offers a strategic moat rooted in tangible asset value and a lower price-to-book ratio, signaling potential undervaluation. However, its high leverage and deteriorating profitability pose notable risks. NWL fits investors with a higher risk tolerance aiming for turnaround opportunities or deep value plays.
If you prioritize durable capital efficiency and stable returns, CHD is the compelling choice due to its proven value creation and financial resilience. However, if you seek contrarian value with potential upside from restructuring, NWL offers a scenario for higher risk-reward despite its financial challenges.
Disclaimer: Investment carries a risk of loss of initial capital. The past performance is not a reliable indicator of future results. Be sure to understand risks before making an investment decision.
Go Further
I encourage you to read the complete analyses of Church & Dwight Co., Inc. and Newell Brands Inc. to enhance your investment decisions: