Home > Comparison > Consumer Defensive > KMB vs CHD
The strategic rivalry between Kimberly-Clark Corporation and Church & Dwight Co., Inc. shapes the competitive landscape in the Household & Personal Products sector. Kimberly-Clark operates as a global consumer tissue and personal care manufacturer with extensive scale. In contrast, Church & Dwight emphasizes diversified specialty and household products with a strong niche focus. This analysis explores which company’s operational model offers superior risk-adjusted returns for a diversified portfolio amid evolving consumer demands.
Table of contents
Companies Overview
Kimberly-Clark Corporation and Church & Dwight Co., Inc. both hold solid positions in the household and personal products market.
Kimberly-Clark Corporation: Leader in Personal Care and Tissue Products
Kimberly-Clark dominates the personal care and consumer tissue sectors with its diverse brand portfolio including Huggies and Kleenex. It generates revenue by selling disposable diapers, wipes, and professional tissue products globally. In 2026, the company focuses on expanding its K-C Professional segment to capture away-from-home commercial demand.
Church & Dwight Co., Inc.: Specialty and Consumer Household Innovator
Church & Dwight drives growth through its distinctive product range featuring ARM & HAMMER and OXICLEAN brands. Its revenue streams come from household cleaning, personal care, and specialty animal productivity products. The firm emphasizes innovation in specialty segments and broadening international consumer reach in recent operations.
Strategic Collision: Similarities & Divergences
Both companies operate in consumer defensives but pursue different competitive moats: Kimberly-Clark leverages brand scale and global distribution, while Church & Dwight emphasizes niche innovation and specialty products. Their primary battleground is household essentials retail channels. Investors encounter contrasting profiles—Kimberly-Clark’s broad-based global reach versus Church & Dwight’s focused specialty growth.
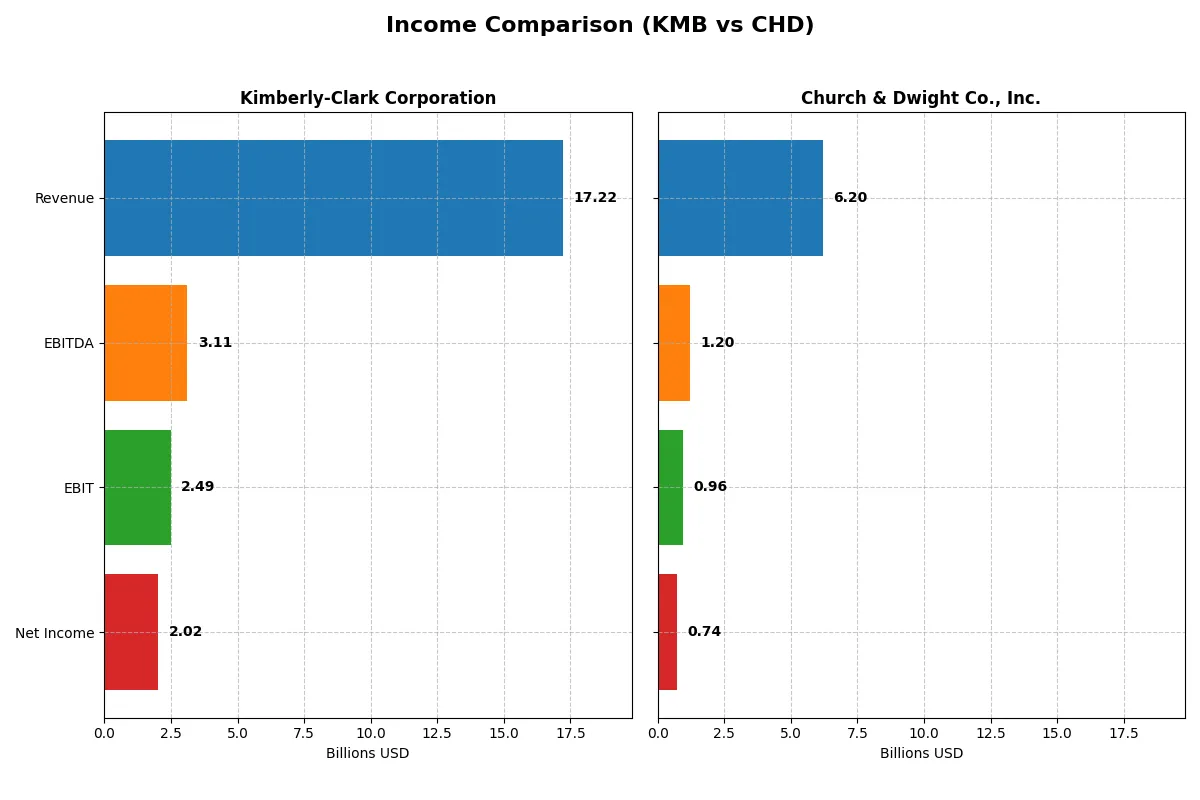
Income Statement Comparison
This data dissects the core profitability and scalability of both corporate engines to reveal who dominates the bottom line:
| Metric | Kimberly-Clark Corporation (KMB) | Church & Dwight Co., Inc. (CHD) |
|---|---|---|
| Revenue | 17.2B | 6.2B |
| Cost of Revenue | 11.1B | 3.4B |
| Operating Expenses | 3.6B | 1.7B |
| Gross Profit | 6.1B | 2.8B |
| EBITDA | 3.1B | 1.2B |
| EBIT | 2.5B | 957M |
| Interest Expense | 256M | 0 |
| Net Income | 2.0B | 737M |
| EPS | 6.08 | 3.04 |
| Fiscal Year | 2025 | 2025 |
Income Statement Analysis: The Bottom-Line Duel
This income statement comparison exposes which company operates with greater efficiency and delivers stronger profitability to shareholders.
Kimberly-Clark Corporation Analysis
Kimberly-Clark’s revenue declined from 20B in 2024 to 17.2B in 2025, a 14% drop, yet net income held firm at 2B in 2025. Gross and net margins remain healthy at 35.6% and 11.7%, respectively. Despite recent revenue pressure, the company sustains solid profitability and margin resilience, signaling operational discipline amid top-line challenges.
Church & Dwight Co., Inc. Analysis
Church & Dwight grew revenue modestly by 1.6% to 6.2B in 2025, while net income rose 26% to 737M, boosting net margin to 11.9%. Its gross margin outperforms at 44.7%, and EBIT margin improves to 15.4%. The company demonstrates momentum with expanding earnings and improved operational efficiency in the latest fiscal year.
Margin Strength vs. Revenue Scale
Kimberly-Clark leverages scale with stable profit margins despite shrinking revenue, while Church & Dwight delivers margin expansion and earnings momentum on a smaller base. The fundamental winner depends on investor preference: Kimberly-Clark offers steady profitability amid top-line softness, whereas Church & Dwight appeals with growth-driven margin improvement and earnings acceleration.
Financial Ratios Comparison
These vital ratios act as a diagnostic tool to expose the underlying fiscal health, valuation premiums, and capital efficiency of the companies compared:
| Ratios | Kimberly-Clark (KMB) | Church & Dwight (CHD) |
|---|---|---|
| ROE | 1.35 | 0.18 |
| ROIC | 0.18 | 0.11 |
| P/E | 16.63 | 27.62 |
| P/B | 22.37 | 5.08 |
| Current Ratio | 0.75 | 1.07 |
| Quick Ratio | 0.54 | 0.71 |
| D/E | 4.77 | 0.55 |
| Debt-to-Assets | 0.42 | 0.25 |
| Interest Coverage | 9.72 | 0 |
| Asset Turnover | 1.00 | 0.70 |
| Fixed Asset Turnover | 2.54 | 7.54 |
| Payout Ratio | 0.82 | 0.39 |
| Dividend Yield | 4.94% | 1.41% |
| Fiscal Year | 2025 | 2025 |
Efficiency & Valuation Duel: The Vital Signs
Financial ratios serve as a company’s DNA, exposing hidden risks and operational strengths crucial for investment decisions.
Kimberly-Clark Corporation
Kimberly-Clark delivers strong profitability with a stellar 135% ROE and a solid 11.7% net margin. Its P/E at 16.6 signals reasonable valuation, though a high P/B at 22.4 raises caution. The firm rewards shareholders with a healthy 4.9% dividend yield, reflecting stable cash returns over aggressive reinvestment.
Church & Dwight Co., Inc.
Church & Dwight posts solid margins of 11.9% and an 18.4% ROE, but trades at a stretched P/E of 27.6 and a P/B of 5.1, suggesting premium pricing. Its lower 1.4% dividend yield indicates moderate shareholder returns, favoring reinvestment in growth and operational efficiency given its robust fixed asset turnover.
Premium Valuation vs. Operational Safety
Kimberly-Clark combines superior returns and attractive dividend income with moderate valuation risk. Church & Dwight offers operational efficiency but at a higher valuation premium and lower yield. Investors seeking income might prefer Kimberly-Clark, while growth-focused profiles could consider Church & Dwight’s reinvestment emphasis.
Which one offers the Superior Shareholder Reward?
I see Kimberly-Clark (KMB) delivers a 4.94% dividend yield with an 82% payout ratio, signaling a strong income focus but thin FCF coverage at 59%. Its buybacks are moderate but debt-heavy leverage poses risk. Church & Dwight (CHD) yields just 1.41% with a 39% payout, prioritizing buybacks and reinvestment. CHD’s lower leverage and higher FCF coverage (90%) make its distribution more sustainable. For 2026 total return, I favor CHD’s balanced, growth-oriented model over KMB’s income-heavy but riskier approach.
Comparative Score Analysis: The Strategic Profile
The radar chart reveals the fundamental DNA and trade-offs between Kimberly-Clark and Church & Dwight, highlighting their strategic strengths and vulnerabilities:
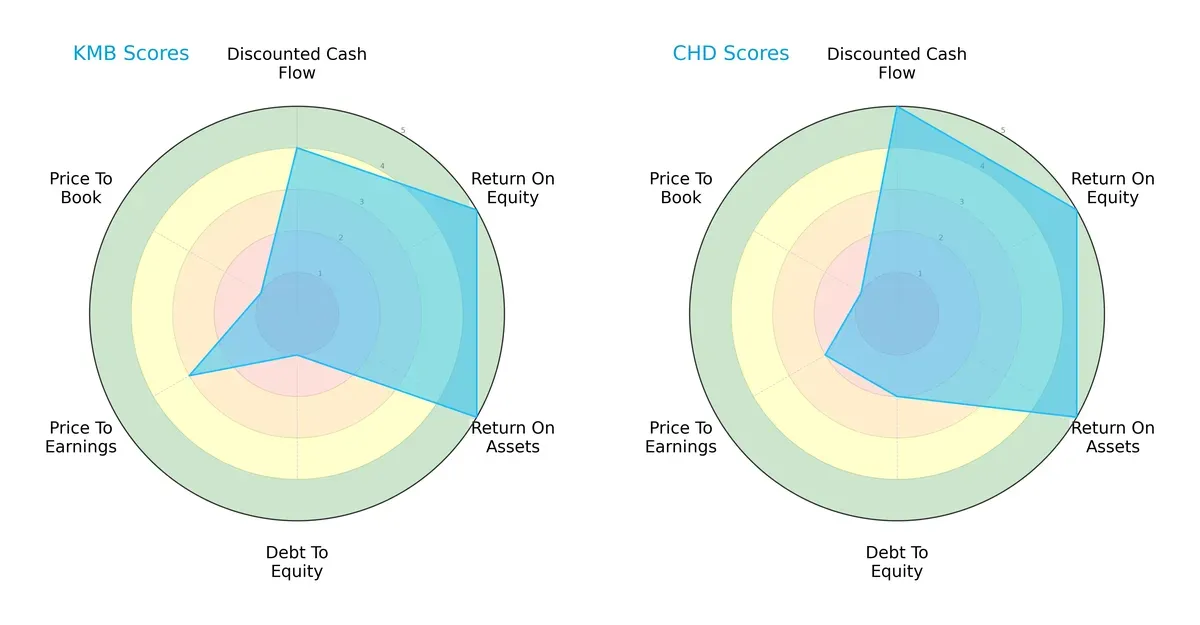
Kimberly-Clark shows strong operational efficiency with top ROE and ROA scores but suffers from a weak debt-to-equity and price-to-book profile. Church & Dwight presents a more balanced financial structure, excelling in discounted cash flow and maintaining moderate leverage, though its valuation metrics suggest caution. I see Church & Dwight as having a steadier overall profile, while Kimberly-Clark relies heavily on operational excellence despite balance sheet risks.
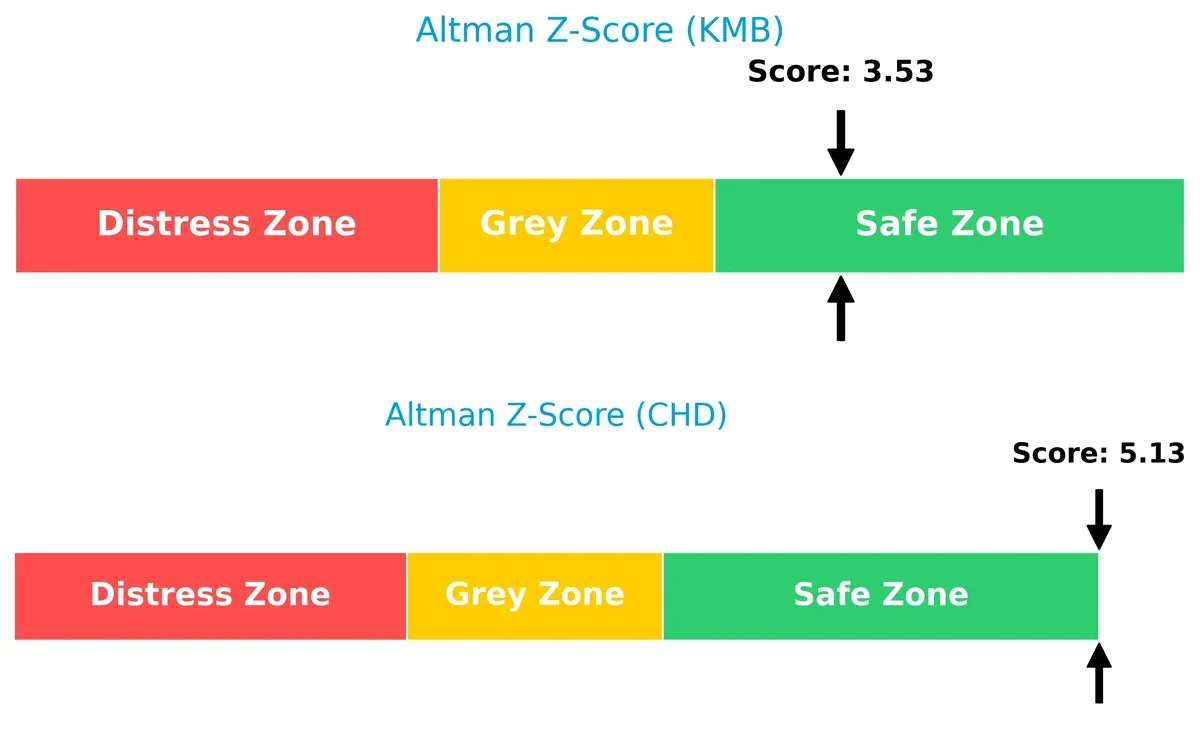
Bankruptcy Risk: Solvency Showdown
Kimberly-Clark’s Altman Z-Score of 3.53 versus Church & Dwight’s 5.13 confirms both companies reside safely above distress thresholds, but Church & Dwight exhibits superior solvency and lower bankruptcy risk in this cycle:
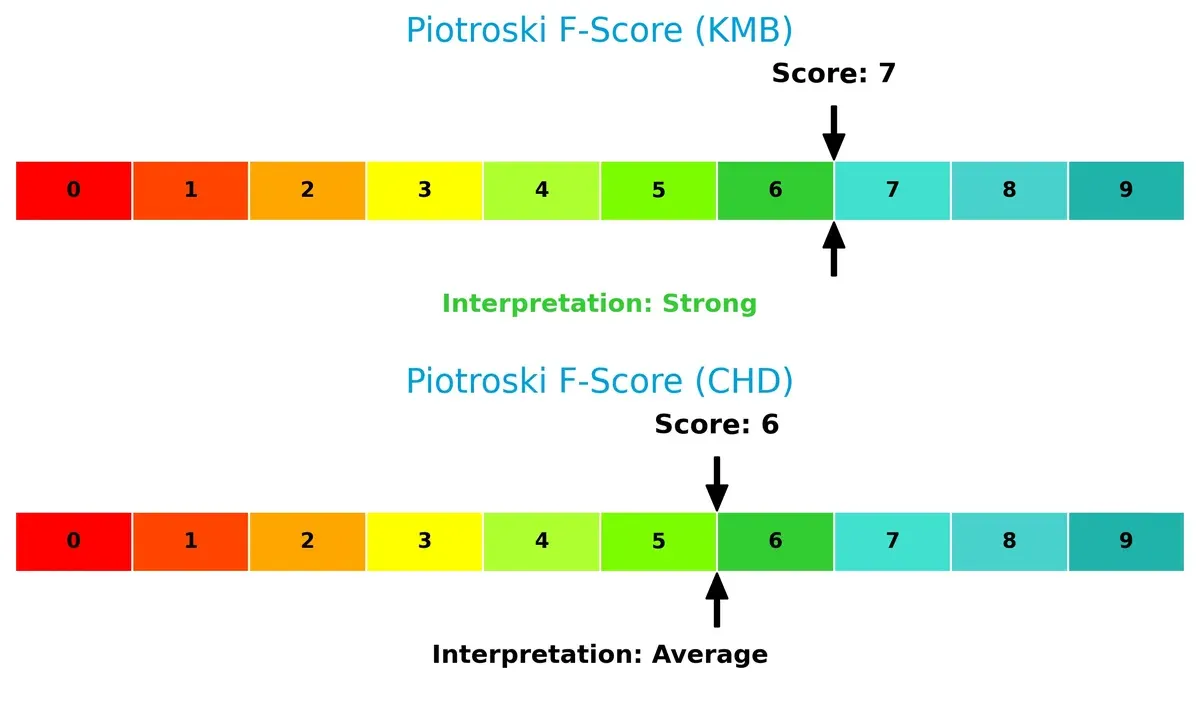
Financial Health: Quality of Operations
Kimberly-Clark’s Piotroski score of 7 indicates robust financial health, surpassing Church & Dwight’s 6, which suggests moderate strength but some caution on internal metrics:
How are the two companies positioned?
This section dissects KMB and CHD’s operational DNA by comparing their revenue distribution across segments and analyzing their internal strengths and weaknesses. The final objective is to confront their economic moats to identify which model offers the most resilient, sustainable competitive advantage today.
Revenue Segmentation: The Strategic Mix
This visual comparison dissects how Kimberly-Clark Corporation and Church & Dwight Co., Inc. diversify their income streams and where their primary sector bets lie:
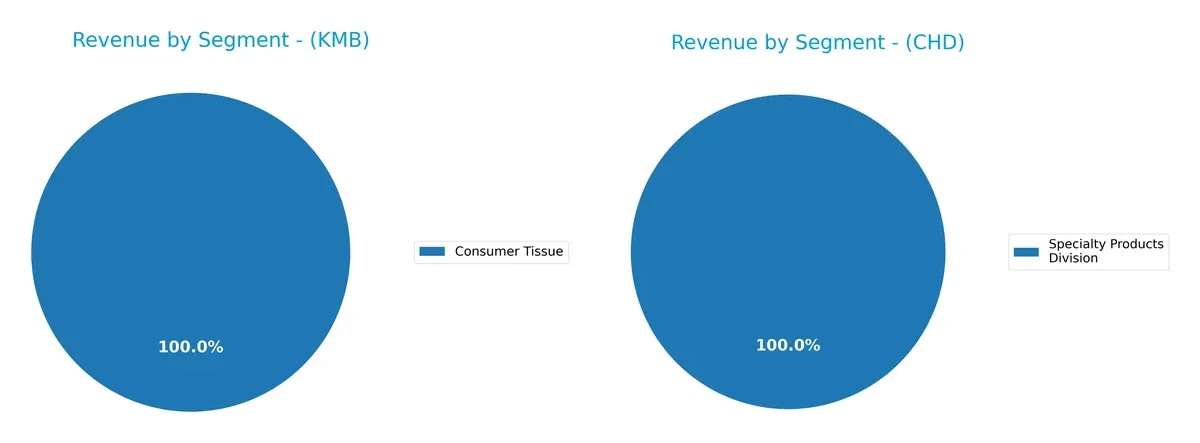
Kimberly-Clark anchors revenue in three robust segments: Personal Care (~$10.7B), Consumer Tissue (~$6.3B), and K-C Professional (~$3.4B) as of 2023. This diversification cushions against volatility in any single area. In contrast, Church & Dwight pivots almost entirely on its Specialty Products Division (~$321M in 2023), signaling concentration risk but potential for niche leadership. Kimberly-Clark’s broad base suggests ecosystem lock-in; Church & Dwight’s focus demands vigilance on segment health.
Strengths and Weaknesses Comparison
This table compares the Strengths and Weaknesses of Kimberly-Clark Corporation and Church & Dwight Co., Inc.:
Kimberly-Clark Corporation Strengths
- Diversified revenue streams across Consumer Tissue, Personal Care, and K-C Professional
- Strong profitability with 11.74% net margin and 17.62% ROIC above WACC
- High dividend yield at 4.94% supports shareholder returns
Church & Dwight Co., Inc. Strengths
- Favorable profitability metrics with 11.88% net margin, 18.41% ROE, and 11.19% ROIC
- Lower debt-to-assets ratio at 24.74% indicates stronger balance sheet
- High fixed asset turnover (7.54) suggests efficient asset use
Kimberly-Clark Corporation Weaknesses
- High leverage with debt-to-equity at 4.77 raises financial risk
- Liquidity concerns reflected in current ratio 0.75 and quick ratio 0.54 below 1
- Elevated price-to-book ratio at 22.37 may indicate overvaluation
Church & Dwight Co., Inc. Weaknesses
- Elevated valuation multiples with PE at 27.62 and PB at 5.08 could pressure returns
- Quick ratio at 0.71 warns of potential liquidity tightness
- Lower asset turnover (0.7) may limit operational efficiency
Kimberly-Clark’s strengths lie in diversification and robust profitability but face risks from leverage and liquidity. Church & Dwight benefits from a stronger balance sheet and asset efficiency but contends with higher valuation and liquidity concerns. Each company’s financial profile suggests different strategic priorities for risk and growth management.
The Moat Duel: Analyzing Competitive Defensibility
A structural moat is the only thing protecting long-term profits from the erosion of competition. Let’s examine how Kimberly-Clark and Church & Dwight defend their turf:
Kimberly-Clark Corporation: Intangible Assets and Brand Strength
Kimberly-Clark’s moat stems from powerful brands and product innovation, reflected in a strong 13% ROIC above WACC. Despite recent revenue dips, its stable profitability and global reach support a resilient market position in 2026.
Church & Dwight Co., Inc.: Cost Advantage and Product Diversification
Church & Dwight leverages cost efficiencies and a broad product portfolio to sustain value creation, with a 5.6% ROIC spread above WACC. However, its declining ROIC trend signals pressure; growth in specialty segments could offset challenges this year.
Moat Strengths in Battle: Brand Equity vs. Operational Efficiency
Kimberly-Clark’s deeper moat, anchored by brand equity and consistent value creation, outmatches Church & Dwight’s cost-driven but eroding advantage. Kimberly-Clark stands better equipped to defend and expand market share in 2026’s competitive landscape.
Which stock offers better returns?
The past year reveals contrasting trends: Kimberly-Clark’s price dropped sharply, while Church & Dwight shows a milder decline overall with a recent strong rebound.
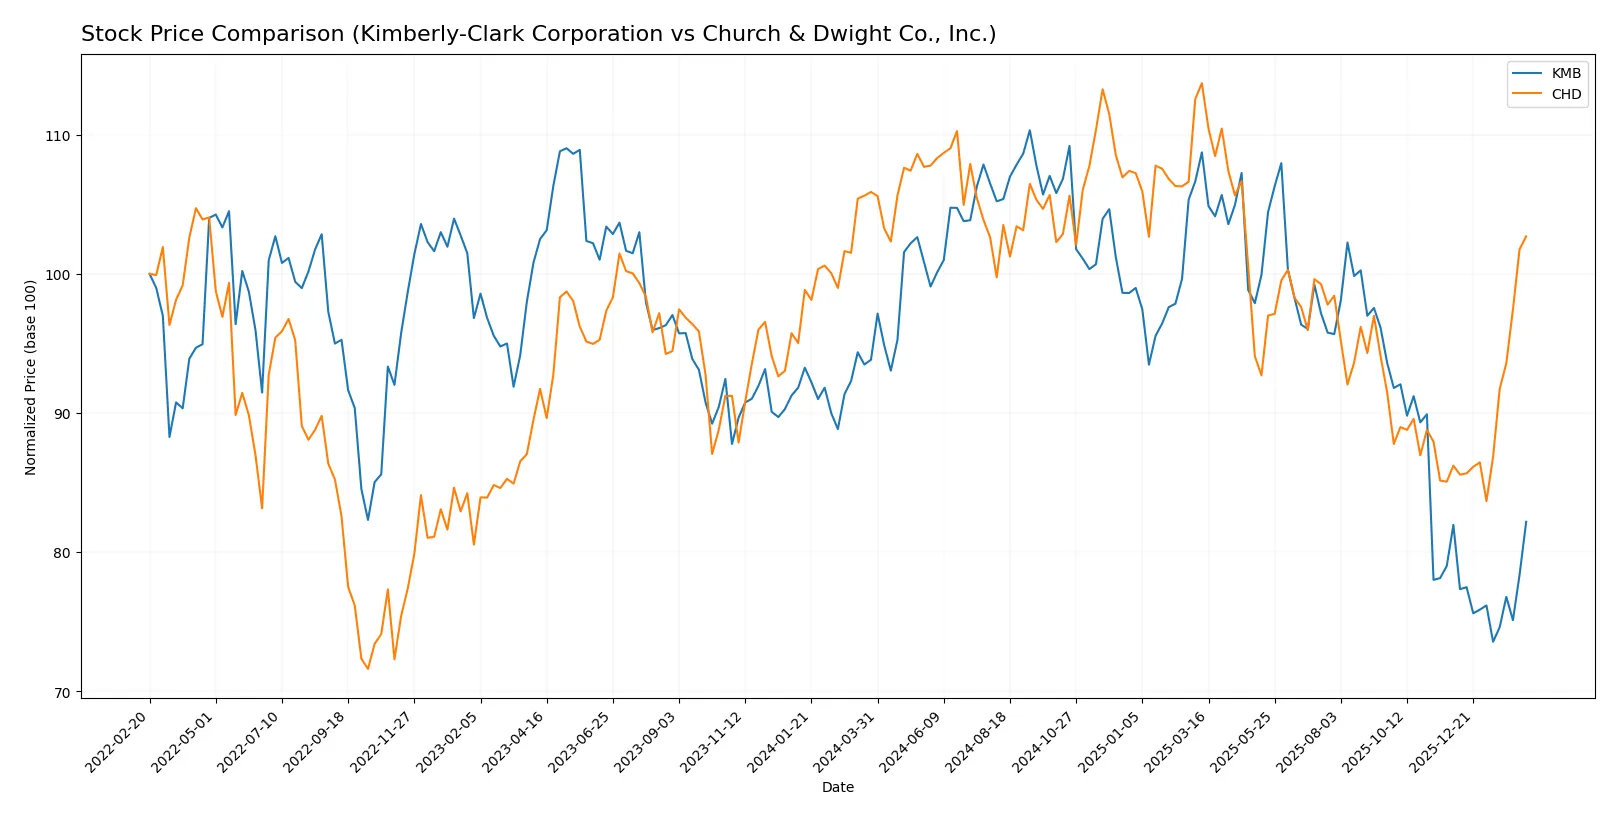
Trend Comparison
Kimberly-Clark’s stock fell 12.42% over the past year, marking a bearish trend with accelerating decline and high volatility (12.88 std dev). It hit lows near 98 and highs around 147.
Church & Dwight’s stock slid 3.01%, also bearish but less severe, with accelerating losses offset by a recent 19.13% surge and moderate volatility (7.81 std dev). Prices ranged between 83 and 112.
Comparing trends, Church & Dwight delivered a superior market performance due to its smaller annual loss and strong recent price acceleration versus Kimberly-Clark.
Target Prices
Analysts present a moderate upside for Kimberly-Clark and Church & Dwight, reflecting steady confidence in their defensive consumer profiles.
| Company | Target Low | Target High | Consensus |
|---|---|---|---|
| Kimberly-Clark Corporation | 102 | 162 | 122.38 |
| Church & Dwight Co., Inc. | 82 | 105 | 97.9 |
The consensus targets imply a 12% upside for Kimberly-Clark from $109.41 and a slight downside for Church & Dwight from $101.45, signaling cautious optimism.

Don’t Let Luck Decide Your Entry Point
Optimize your entry points with our advanced ProRealTime indicators. You’ll get efficient buy signals with precise price targets for maximum performance. Start outperforming now!
How do institutions grade them?
Kimberly-Clark Corporation Grades
The table below summarizes recent grades assigned to Kimberly-Clark Corporation by leading institutions.
| Grading Company | Action | New Grade | Date |
|---|---|---|---|
| UBS | Maintain | Neutral | 2026-01-28 |
| UBS | Maintain | Neutral | 2026-01-14 |
| Citigroup | Maintain | Sell | 2026-01-14 |
| TD Cowen | Maintain | Hold | 2026-01-08 |
| Wells Fargo | Maintain | Equal Weight | 2026-01-05 |
| Citigroup | Maintain | Sell | 2025-12-17 |
| BNP Paribas Exane | Maintain | Neutral | 2025-12-01 |
| Argus Research | Upgrade | Buy | 2025-11-13 |
| Morgan Stanley | Maintain | Equal Weight | 2025-11-04 |
| Wells Fargo | Maintain | Equal Weight | 2025-11-04 |
Church & Dwight Co., Inc. Grades
Below is a summary of recent grades given to Church & Dwight Co., Inc. by reputable financial institutions.
| Grading Company | Action | New Grade | Date |
|---|---|---|---|
| Evercore ISI Group | Maintain | In Line | 2026-02-02 |
| JP Morgan | Upgrade | Neutral | 2026-02-02 |
| Wells Fargo | Maintain | Overweight | 2026-02-02 |
| Citigroup | Maintain | Neutral | 2026-02-02 |
| Morgan Stanley | Maintain | Equal Weight | 2026-02-02 |
| Jefferies | Maintain | Buy | 2026-02-02 |
| Jefferies | Maintain | Buy | 2026-01-28 |
| UBS | Maintain | Neutral | 2026-01-14 |
| TD Cowen | Maintain | Hold | 2026-01-08 |
| Wells Fargo | Maintain | Overweight | 2026-01-05 |
Which company has the best grades?
Church & Dwight consistently receives more positive grades, including multiple “Buy” and “Overweight” ratings. Kimberly-Clark shows more neutral to negative grades, with some “Sell” ratings. Investors may interpret Church & Dwight’s stronger grades as a sign of better growth or risk-adjusted potential.
Risks specific to each company
The following categories identify the critical pressure points and systemic threats facing both firms in the 2026 market environment:
1. Market & Competition
Kimberly-Clark Corporation
- Faces intense competition in personal care and tissue markets with established global brands.
Church & Dwight Co., Inc.
- Competes across diverse consumer and specialty product segments, reliant on brand innovation and niche markets.
2. Capital Structure & Debt
Kimberly-Clark Corporation
- High debt-to-equity ratio (4.77) signals elevated leverage and financial risk.
Church & Dwight Co., Inc.
- Low debt-to-equity ratio (0.55) indicates conservative balance sheet and lower financial risk.
3. Stock Volatility
Kimberly-Clark Corporation
- Very low beta (0.277) shows stock is less sensitive to market swings, offering stability.
Church & Dwight Co., Inc.
- Moderate beta (0.468) implies higher sensitivity to market fluctuations and volatility.
4. Regulatory & Legal
Kimberly-Clark Corporation
- Operates globally with exposure to personal care regulations and product safety standards.
Church & Dwight Co., Inc.
- Faces regulatory risks across multiple product categories, including specialty and health products.
5. Supply Chain & Operations
Kimberly-Clark Corporation
- Global supply chain complexity may expose it to disruptions and cost inflation.
Church & Dwight Co., Inc.
- Smaller scale operations reduce complexity but increase dependence on key suppliers.
6. ESG & Climate Transition
Kimberly-Clark Corporation
- Increasing pressure to improve sustainability in product sourcing and packaging.
Church & Dwight Co., Inc.
- Growing need to align specialty products with ESG standards and reduce environmental footprint.
7. Geopolitical Exposure
Kimberly-Clark Corporation
- Global footprint exposes it to geopolitical risks, including trade tensions and tariffs.
Church & Dwight Co., Inc.
- More domestically focused, with lower direct exposure to geopolitical disruptions.
Which company shows a better risk-adjusted profile?
Church & Dwight’s lower leverage and stronger Altman Z-Score suggest a more resilient balance sheet. Kimberly-Clark’s high debt and weaker liquidity ratios raise caution. However, Kimberly-Clark offers a more stable stock with lower volatility. The most impactful risk for Kimberly-Clark is its elevated financial leverage. For Church & Dwight, valuation risks from high P/E ratios and exposure to regulatory complexity stand out. Recent data indicate Kimberly-Clark’s debt-to-equity ratio at 4.77, a significant red flag, while Church & Dwight maintains safer leverage and a superior Altman Z-Score of 5.13, underscoring its stronger financial stability. Overall, Church & Dwight presents a better risk-adjusted profile despite slightly higher market volatility.
Final Verdict: Which stock to choose?
Kimberly-Clark Corporation’s superpower lies in its robust capital efficiency and strong return on invested capital. This cash-generative machine delivers consistent value creation despite recent revenue headwinds. Its point of vigilance is a stretched liquidity profile, which could challenge flexibility. It suits portfolios targeting resilient, dividend-oriented income with moderate growth.
Church & Dwight’s strategic moat is its higher gross margins and superior asset turnover, backed by a safer debt structure and excellent interest coverage. The company offers a steadier balance sheet and favorable free cash flow growth, though at a premium valuation. It aligns well with investors who favor GARP—growth at a reasonable price—seeking stability with upside potential.
If you prioritize capital efficiency and dividend yield, Kimberly-Clark outshines with a compelling value creation track record, albeit with liquidity risks. However, if you seek growth paired with financial stability, Church & Dwight offers better stability and margin resilience, commanding a premium for its quality and growth profile. Both present analytical scenarios worth considering based on your risk tolerance and investment horizon.
Disclaimer: Investment carries a risk of loss of initial capital. The past performance is not a reliable indicator of future results. Be sure to understand risks before making an investment decision.
Go Further
I encourage you to read the complete analyses of Kimberly-Clark Corporation and Church & Dwight Co., Inc. to enhance your investment decisions: