Home > Comparison > Consumer Defensive > KVUE vs CHD
The strategic rivalry between Kenvue Inc. and Church & Dwight Co., Inc. defines the trajectory of the consumer defensive sector. Kenvue operates as a global consumer health company with a broad portfolio spanning self-care to skin health. Church & Dwight focuses on household and specialty products, emphasizing innovation in everyday essentials. This analysis pits Kenvue’s expansive health brands against Church & Dwight’s niche product strength, seeking the superior risk-adjusted investment case.
Table of contents
Companies Overview
Kenvue Inc. and Church & Dwight Co., Inc. stand as key players shaping the household and personal products market in the US.
Kenvue Inc.: Consumer Health Powerhouse
Kenvue Inc. defines itself as a global consumer health leader. It generates revenue through three core segments: Self Care, Skin Health and Beauty, and Essential Health. The company leverages iconic brands like Tylenol, Neutrogena, and Listerine. In 2026, Kenvue sharpens its strategic focus on expanding its health and beauty portfolio, driving growth via innovation in self care products.
Church & Dwight Co., Inc.: Diverse Household Innovator
Church & Dwight Co., Inc. excels as a manufacturer of household and personal care products. Its revenue base spans consumer and specialty segments with flagship brands such as ARM & HAMMER and OXICLEAN. The 2026 strategy emphasizes broadening product reach across mass merchandisers and e-commerce, capitalizing on its diversified portfolio that includes dietary supplements and specialty animal products.
Strategic Collision: Similarities & Divergences
Both companies operate in the consumer defensive sector with strong brand portfolios but differ in business philosophy. Kenvue focuses on a health-centric ecosystem while Church & Dwight pursues a broad, multi-category approach. They compete primarily in household and personal care retail channels. Their investment profiles diverge by Kenvue’s innovation-driven growth versus Church & Dwight’s diversification and stable cash flow model.
Income Statement Comparison
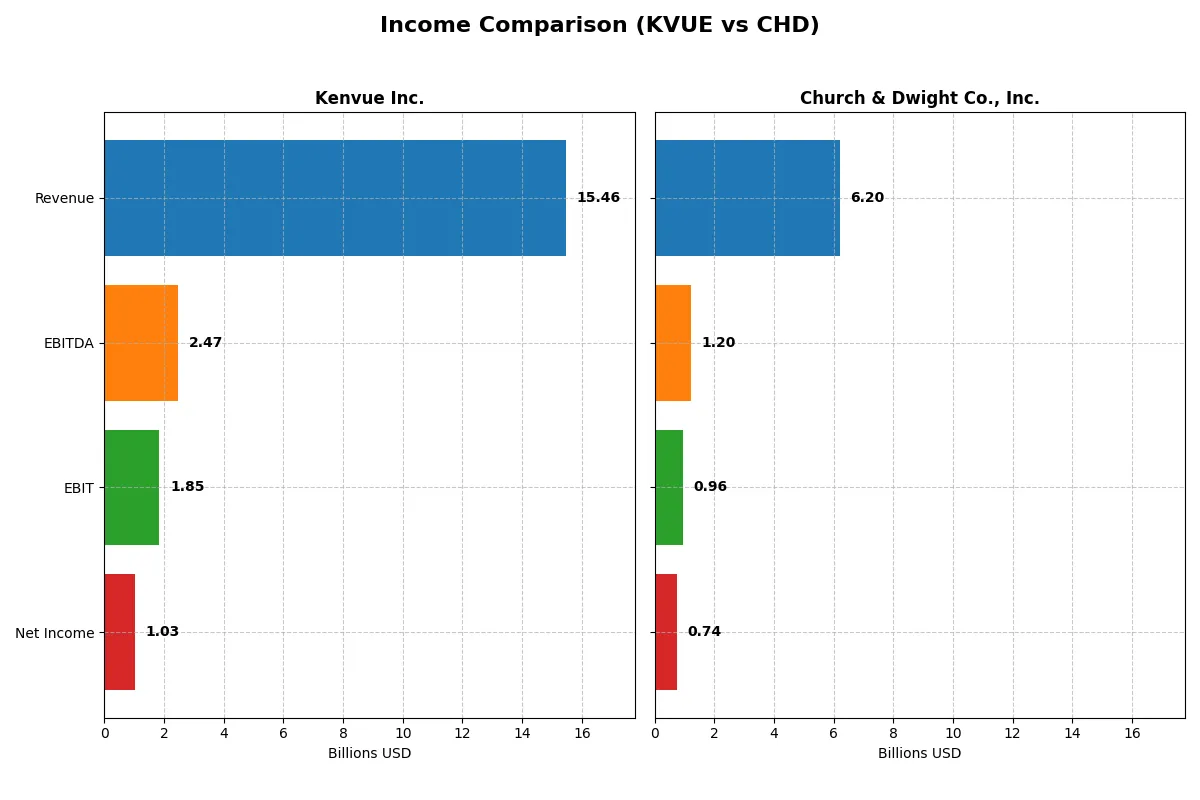
This data dissects the core profitability and scalability of both corporate engines to reveal who dominates the bottom line:
| Metric | Kenvue Inc. (KVUE) | Church & Dwight Co., Inc. (CHD) |
|---|---|---|
| Revenue | 15.5B | 6.2B |
| Cost of Revenue | 6.5B | 3.4B |
| Operating Expenses | 7.1B | 1.7B |
| Gross Profit | 9.0B | 2.8B |
| EBITDA | 2.5B | 1.2B |
| EBIT | 1.8B | 957M |
| Interest Expense | 431M | 0 |
| Net Income | 1.0B | 737M |
| EPS | 0.54 | 3.04 |
| Fiscal Year | 2024 | 2025 |
Income Statement Analysis: The Bottom-Line Duel
This income statement comparison reveals which company runs a more efficient and profitable corporate engine through its revenue and net income performance.
Kenvue Inc. Analysis
Kenvue’s revenue stayed stable around 15.45B in 2024, yet net income declined sharply to 1.03B, down from 1.66B in 2023. Its gross margin holds strong near 58%, but net margin fell to 6.66%, signaling margin compression. The company faces unfavorable EBIT and EPS growth over the last year, indicating weakening profitability momentum.
Church & Dwight Co., Inc. Analysis
Church & Dwight grew revenue modestly to 6.2B in 2025, with net income rising to 737M from 585M the prior year. Gross margin remains healthy at 44.7%, while net margin improved to 11.9%. EBIT and EPS both expanded over the past year, reflecting stronger operational efficiency and earnings momentum despite a slower revenue growth pace.
Margin Resilience vs. Earnings Momentum
Kenvue sustains higher absolute revenue but struggles with declining net margins, while Church & Dwight posts lower top-line scale but improves profitability metrics. Church & Dwight’s growth in EBIT and net margin signals superior earnings quality. Investors seeking stable margin expansion may favor Church & Dwight’s profile, whereas Kenvue’s scale offers a different risk-reward dynamic.
Financial Ratios Comparison
These vital ratios act as a diagnostic tool to expose the underlying fiscal health, valuation premiums, and capital efficiency of the companies compared below:
| Ratios | Kenvue Inc. (KVUE) | Church & Dwight Co., Inc. (CHD) |
|---|---|---|
| ROE | 10.7% | 18.4% |
| ROIC | 6.2% | 11.2% |
| P/E | 39.4 | 27.6 |
| P/B | 4.20 | 5.08 |
| Current Ratio | 0.96 | 1.07 |
| Quick Ratio | 0.69 | 0.71 |
| D/E | 0.90 | 0.55 |
| Debt-to-Assets | 34.1% | 24.7% |
| Interest Coverage | 4.27 | N/A |
| Asset Turnover | 0.60 | 0.70 |
| Fixed Asset Turnover | 8.36 | 7.54 |
| Payout ratio | 151% | 39% |
| Dividend yield | 3.83% | 1.41% |
| Fiscal Year | 2024 | 2025 |
Efficiency & Valuation Duel: The Vital Signs
Financial ratios act as a company’s DNA, uncovering hidden risks and operational excellence essential for informed investment decisions.
Kenvue Inc.
Kenvue posts a moderate 10.65% ROE and 6.66% net margin, signaling steady profitability but no standout efficiency. Its P/E of 39.38 and P/B of 4.2 mark the stock as expensive and stretched. The 3.83% dividend yield offers solid shareholder returns amid a slight liquidity concern with a 0.96 current ratio.
Church & Dwight Co., Inc.
Church & Dwight delivers robust profitability with an 18.41% ROE and an 11.88% net margin, demonstrating operational strength. Despite a high P/E of 27.62 and P/B of 5.08, it appears less stretched than Kenvue. Dividend yield at 1.41% is modest, complemented by strong balance sheet metrics, including a 1.07 current ratio and favorable debt levels.
Premium Valuation vs. Operational Safety
Church & Dwight offers superior profitability and healthier liquidity at a more balanced valuation. Kenvue’s higher dividend compensates for its stretched multiples but carries greater liquidity risk. Investors prioritizing growth and operational safety may lean toward Church & Dwight’s profile.
Which one offers the Superior Shareholder Reward?
I observe Kenvue Inc. (KVUE) and Church & Dwight (CHD) pursue distinct distribution models. KVUE yields 3.8%, but its payout ratio exceeds free cash flow, risking sustainability. CHD offers a modest 1.4% yield with a conservative 39% payout ratio, supported by 90% free cash flow coverage. KVUE’s buybacks appear minimal, while CHD maintains steady share repurchases, enhancing total return. I find CHD’s balanced dividend and buyback strategy more sustainable and attractive for long-term investors in 2026. Church & Dwight offers the superior shareholder reward.
Comparative Score Analysis: The Strategic Profile
The radar chart reveals the fundamental DNA and trade-offs of Kenvue Inc. and Church & Dwight Co., Inc.:
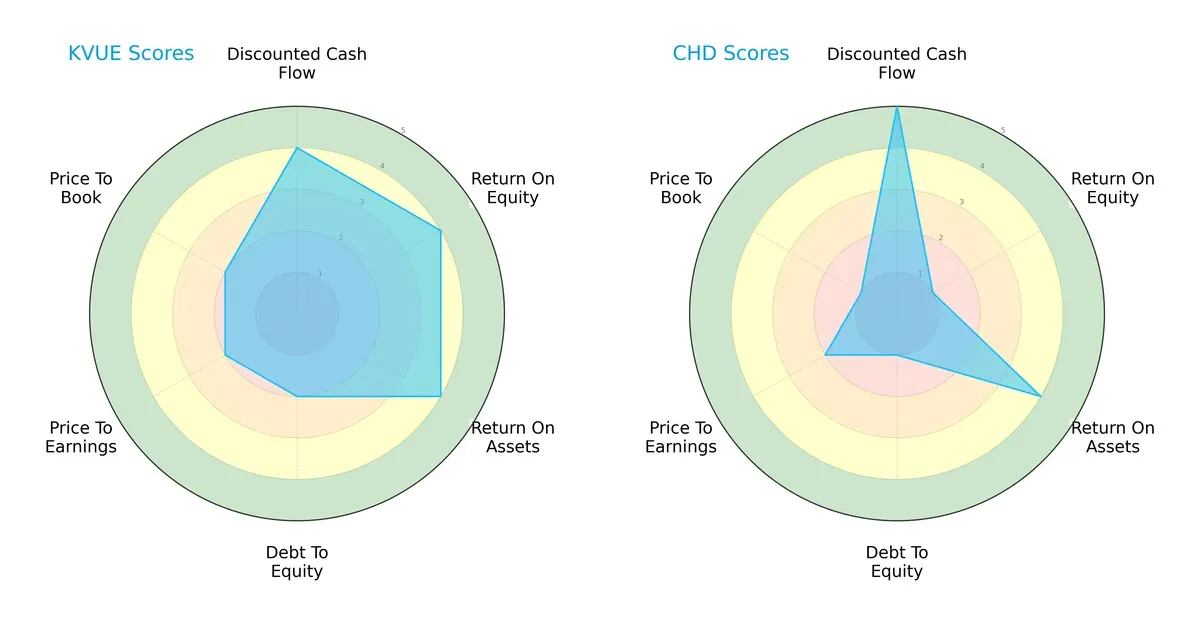
Kenvue shows a balanced profile with solid ROE and ROA scores (4 each), indicating efficient profit generation and asset use. Church & Dwight excels in discounted cash flow (5) but struggles with ROE (1) and debt management (1). Kenvue’s moderate debt-to-equity and valuation scores suggest prudent financial structure, whereas Church & Dwight leans heavily on cash flow strength but carries higher financial risk.
Bankruptcy Risk: Solvency Showdown
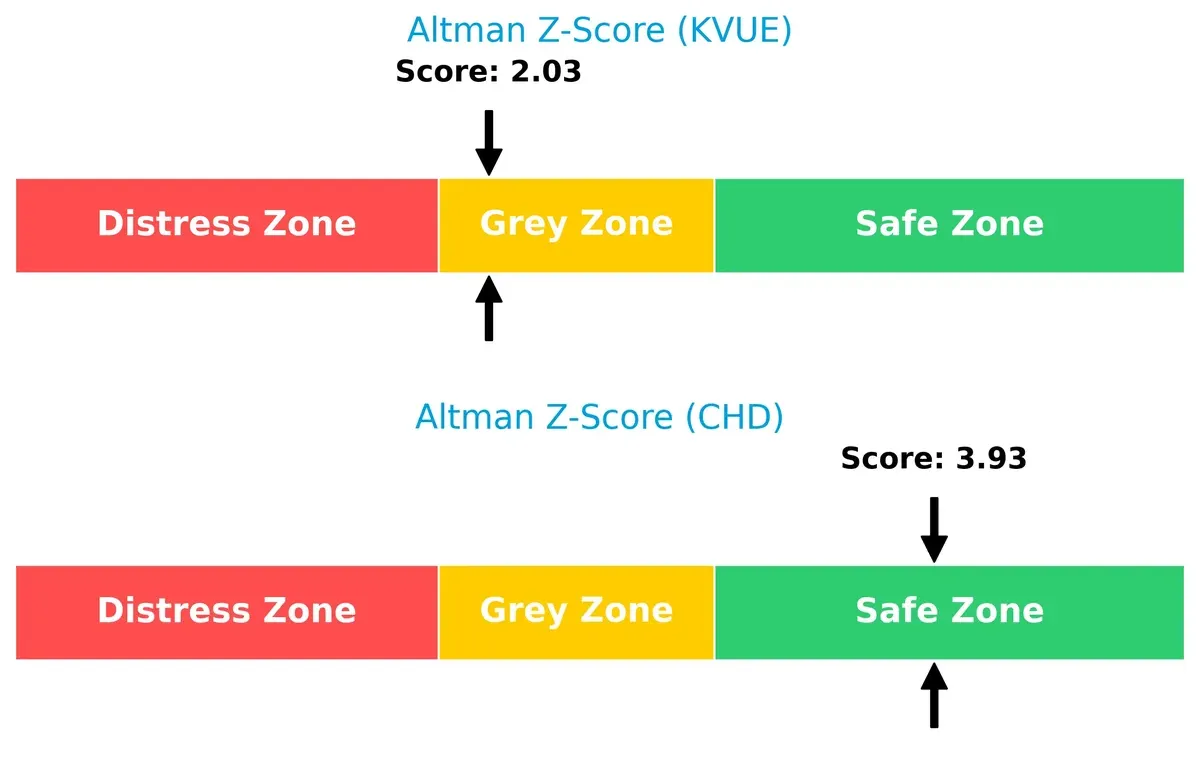
Church & Dwight’s Altman Z-Score (3.93) places it safely above distress, signaling strong long-term solvency. Kenvue’s score (2.03) sits in the grey zone, implying moderate bankruptcy risk in this cycle:
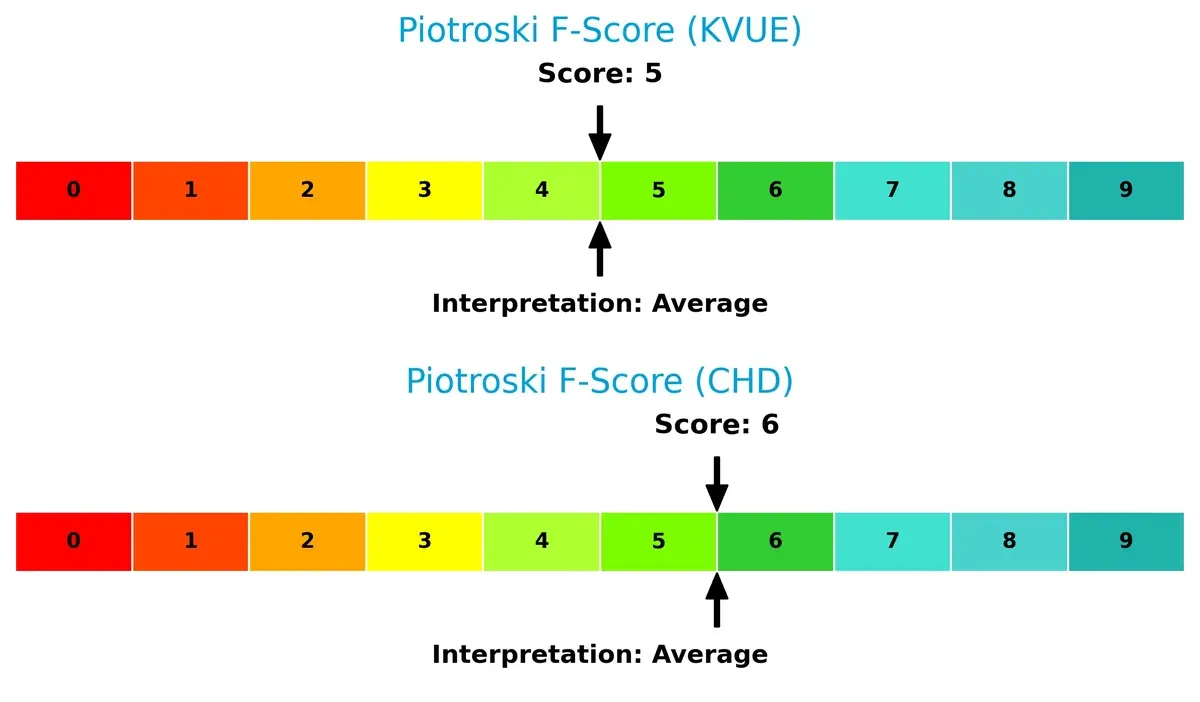
Financial Health: Quality of Operations
Both firms display average Piotroski F-Scores, with Church & Dwight slightly ahead at 6 versus Kenvue’s 5. This suggests Church & Dwight maintains marginally stronger internal financial health, though neither shows red flags severe enough to raise immediate concern:
How are the two companies positioned?
This section dissects the operational DNA of KVUE and CHD by comparing their revenue distribution and internal strengths and weaknesses. The final objective is to confront their economic moats to identify which model offers the most resilient competitive advantage today.
Revenue Segmentation: The Strategic Mix
This visual comparison dissects how Kenvue Inc. and Church & Dwight Co., Inc. diversify their income streams and reveals where each firm places its primary sector bets:
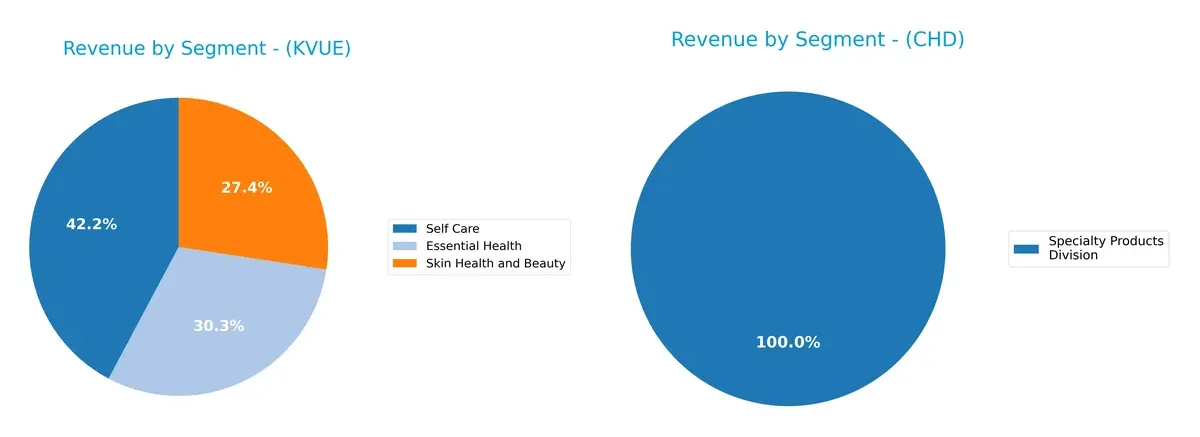
Kenvue Inc. boasts a well-balanced revenue mix, anchoring on Self Care with $6.5B, but also generating $4.7B and $4.2B from Essential Health and Skin Health & Beauty. Church & Dwight Co. relies almost entirely on Specialty Products, with revenues around $300M, showing high concentration risk. Kenvue’s diverse portfolio reduces dependency on any single sector, enabling resilience and ecosystem lock-in, while CHD’s narrow focus limits flexibility but might sharpen niche expertise.
Strengths and Weaknesses Comparison
This table compares the strengths and weaknesses of Kenvue Inc. and Church & Dwight Co., Inc.:
Kenvue Inc. Strengths
- Diversified revenue across Essential Health, Self Care, Skin Health and Beauty
- Strong global presence in North America, EMEA, Asia Pacific, Latin America
- Favorable fixed asset turnover and dividend yield
- WACC below ROIC supports capital efficiency
Church & Dwight Co., Inc. Strengths
- Higher profitability with favorable net margin, ROE, and ROIC
- Strong consumer domestic revenue dominance
- Favorable debt-to-assets and interest coverage ratios
- Global ratios show a slightly favorable financial position
Kenvue Inc. Weaknesses
- Unfavorable valuation multiples (high P/E and P/B)
- Low liquidity ratios below 1 signal potential short-term risk
- Neutral to slightly unfavorable overall ratio profile
- Moderate leverage level
Church & Dwight Co., Inc. Weaknesses
- Unfavorable P/E and P/B ratios suggest valuation concerns
- Quick ratio below 1 indicates liquidity pressure
- Lower dividend yield compared to peer
- Narrower product segment focus limits diversification
Kenvue’s broad product and geographic diversification contrasts with Church & Dwight’s stronger profitability and financial health. Each company faces valuation and liquidity challenges that could influence strategic priorities.
The Moat Duel: Analyzing Competitive Defensibility
A structural moat is the only thing protecting long-term profits from the erosion of competition. Here’s how Kenvue Inc. and Church & Dwight Co., Inc. compare:
Kenvue Inc.: Emerging Brand and Product Portfolio Strength
Kenvue’s moat stems from its intangible assets—strong consumer brands like Tylenol and Neutrogena. This shows in growing ROIC despite value shedding, signaling rising profitability but no dominant moat yet. Expansion into skin health and self-care markets in 2026 could deepen its advantage.
Church & Dwight Co., Inc.: Established Operational Efficiency and Cost Advantage
Church & Dwight leverages cost advantages and operational scale, delivering ROIC well above WACC. Its margin stability and broad product range contrast with Kenvue’s emerging edge. However, declining ROIC warns of margin pressure. Growth in specialty and international segments offers upside.
Brand Equity vs. Operational Excellence: Who Builds the Deeper Moat?
Church & Dwight commands a wider moat through consistent value creation and operational efficiency. Kenvue shows a promising moat trajectory but lacks Church & Dwight’s entrenched cost and scale advantages. Therefore, Church & Dwight is better equipped to defend its market share in a competitive consumer staples landscape.
Which stock offers better returns?
Over the past year, both Kenvue Inc. and Church & Dwight Co., Inc. experienced bearish trends with accelerating declines, yet recent months show emerging positive momentum in their stock prices.
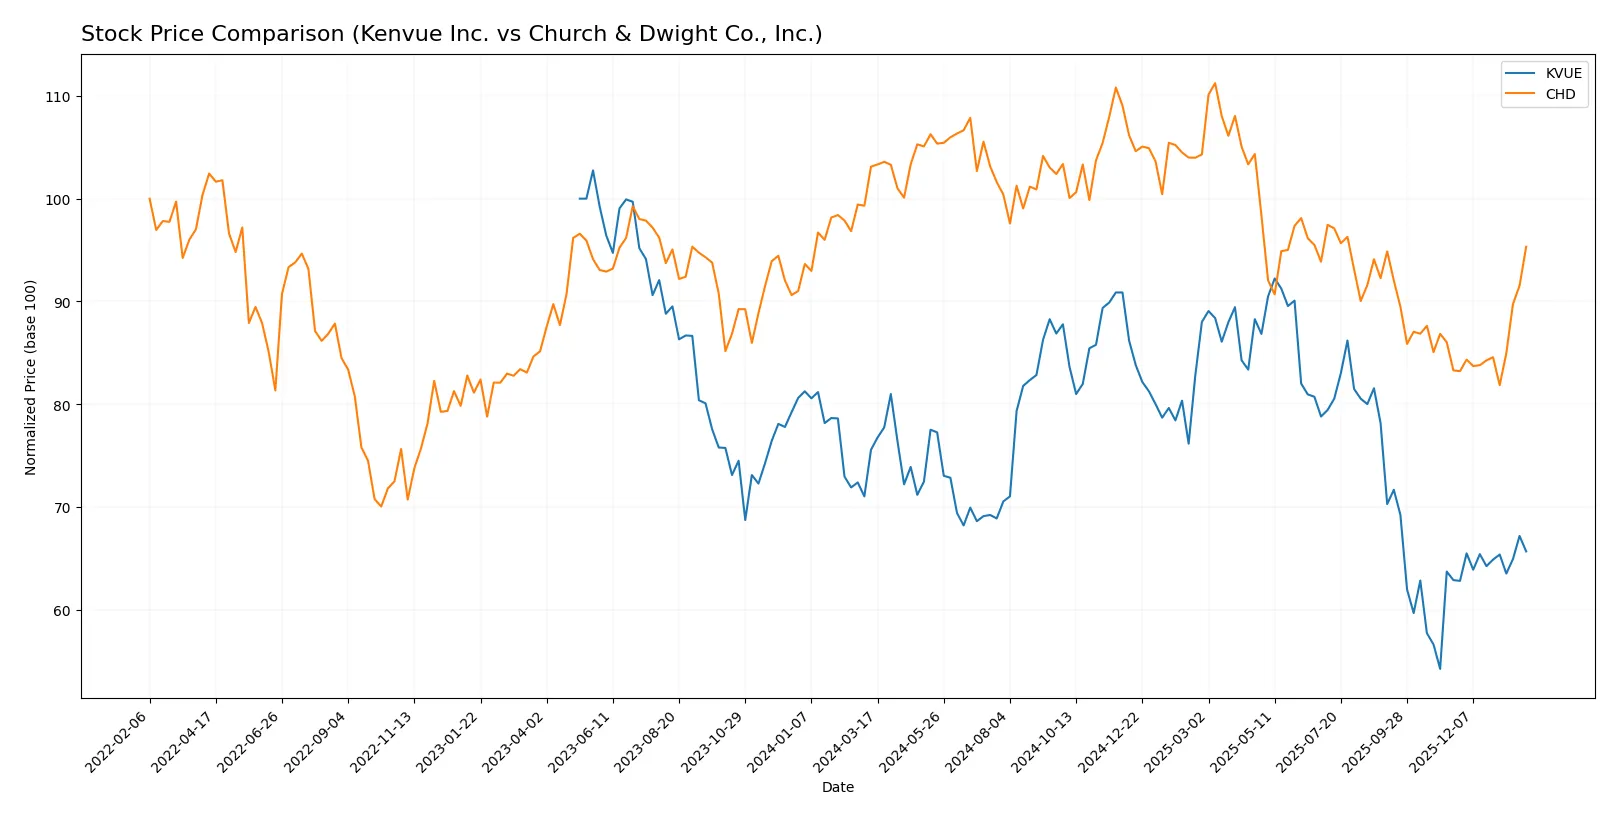
Trend Comparison
Kenvue’s stock declined 13.09% over the past year, marking a bearish trend with accelerating losses. It hit a low of 14.37 and a high of 24.44, showing moderate volatility with a 2.49 std deviation.
Church & Dwight’s stock fell 7.56% last year, also bearish with accelerating decline. It ranged between 82.64 and 112.33, demonstrating higher volatility at a 7.84 std deviation.
Recently, Church & Dwight outperformed Kenvue with a 14.45% gain versus 4.44%, delivering the strongest market performance in the analyzed period.
Target Prices
Analysts present a balanced target consensus reflecting moderate upside potential for both Kenvue Inc. and Church & Dwight Co., Inc.
| Company | Target Low | Target High | Consensus |
|---|---|---|---|
| Kenvue Inc. | 15 | 22 | 17.86 |
| Church & Dwight Co., Inc. | 82 | 102 | 96.25 |
Kenvue’s consensus target of 17.86 sits just above its current price of 17.4, signaling modest upside. Church & Dwight’s target consensus exactly matches its current price, indicating market expectations are fully priced in.

Don’t Let Luck Decide Your Entry Point
Optimize your entry points with our advanced ProRealTime indicators. You’ll get efficient buy signals with precise price targets for maximum performance. Start outperforming now!
How do institutions grade them?
Kenvue Inc. Grades
The following table summarizes recent institutional grade updates for Kenvue Inc.:
| Grading Company | Action | New Grade | Date |
|---|---|---|---|
| Jefferies | Downgrade | Hold | 2026-01-30 |
| Barclays | Maintain | Equal Weight | 2025-11-10 |
| Canaccord Genuity | Downgrade | Hold | 2025-10-29 |
| Jefferies | Maintain | Buy | 2025-10-27 |
| JP Morgan | Maintain | Overweight | 2025-10-10 |
| Citigroup | Maintain | Neutral | 2025-10-09 |
| UBS | Maintain | Neutral | 2025-10-08 |
| B of A Securities | Maintain | Buy | 2025-10-08 |
| Goldman Sachs | Maintain | Neutral | 2025-10-02 |
| Barclays | Maintain | Equal Weight | 2025-10-01 |
Church & Dwight Co., Inc. Grades
The following table summarizes recent institutional grade updates for Church & Dwight Co., Inc.:
| Grading Company | Action | New Grade | Date |
|---|---|---|---|
| Jefferies | Maintain | Buy | 2026-01-28 |
| UBS | Maintain | Neutral | 2026-01-14 |
| TD Cowen | Maintain | Hold | 2026-01-08 |
| Wells Fargo | Maintain | Overweight | 2026-01-05 |
| Raymond James | Upgrade | Outperform | 2026-01-05 |
| Jefferies | Upgrade | Buy | 2025-12-17 |
| Citigroup | Upgrade | Neutral | 2025-12-17 |
| Deutsche Bank | Maintain | Buy | 2025-12-10 |
| Argus Research | Maintain | Buy | 2025-12-04 |
| Barclays | Maintain | Underweight | 2025-11-04 |
Which company has the best grades?
Church & Dwight holds stronger and more consistent buy and outperform ratings than Kenvue, which shows several downgrades to hold. This divergence may influence investors seeking more positive analyst sentiment.
Risks specific to each company
The following categories identify critical pressure points and systemic threats both Kenvue Inc. and Church & Dwight face in the 2026 market environment:
1. Market & Competition
Kenvue Inc.
- Faces intense competition in consumer health with legacy brands but limited scale compared to sector giants.
Church & Dwight Co., Inc.
- Competes broadly in household and specialty products with strong brand diversification and established market presence.
2. Capital Structure & Debt
Kenvue Inc.
- Moderate leverage with debt-to-assets at 34%, current ratio below 1 signals liquidity pressure.
Church & Dwight Co., Inc.
- Lower leverage with debt-to-assets at 25%, current ratio slightly above 1, indicating better short-term solvency.
3. Stock Volatility
Kenvue Inc.
- Beta of 0.55 implies lower volatility, but wide trading range (14.02–25.17) reflects market uncertainty post-IPO.
Church & Dwight Co., Inc.
- Lower beta at 0.46 and tighter price range (81.33–116.46) shows steadier investor confidence.
4. Regulatory & Legal
Kenvue Inc.
- Exposure to consumer health regulations and potential litigation from legacy product lines.
Church & Dwight Co., Inc.
- Faces regulatory scrutiny in household chemicals and specialty products but with established compliance frameworks.
5. Supply Chain & Operations
Kenvue Inc.
- Global supply chain risks due to diverse product segments; operational scale still ramping post-spin-off.
Church & Dwight Co., Inc.
- More streamlined supply chain with focus on specialty segments and stable operational footprint.
6. ESG & Climate Transition
Kenvue Inc.
- Increasing pressure to enhance sustainability in consumer health products; ESG initiatives evolving.
Church & Dwight Co., Inc.
- Moderate ESG risks with ongoing initiatives in product sustainability and emissions reduction.
7. Geopolitical Exposure
Kenvue Inc.
- High exposure to US and global markets; geopolitical tensions could disrupt raw material sourcing.
Church & Dwight Co., Inc.
- Similar geopolitical exposure but with diversified international operations mitigating risk concentration.
Which company shows a better risk-adjusted profile?
Church & Dwight faces its biggest risk in regulatory and capital structure stability, but its solid balance sheet and steady stock performance offer a safer risk-adjusted profile. Kenvue’s liquidity challenges and market volatility post-IPO pose greater uncertainty. Recent data highlight Kenvue’s sub-1 current ratio as a red flag, while Church & Dwight’s Altman Z-Score firmly places it in the safe zone.
Final Verdict: Which stock to choose?
Kenvue Inc. (KVUE) excels as a cash generator with improving profitability despite a slightly unfavorable liquidity position. Its growing ROIC signals emerging operational strength. This stock fits best in an aggressive growth portfolio willing to tolerate near-term volatility for potential long-term gains.
Church & Dwight Co., Inc. (CHD) boasts a robust strategic moat driven by consistent value creation and operational efficiency. It offers better financial stability than KVUE, supported by a safer debt profile. CHD suits a GARP investor seeking a blend of growth and moderate risk.
If you prioritize aggressive expansion and emerging profitability, KVUE is compelling due to its accelerating returns and cash flow improvement. However, if you seek steadier value creation with stronger balance sheet resilience, CHD offers better stability and a durable moat despite a slowing ROIC trend.
Disclaimer: Investment carries a risk of loss of initial capital. The past performance is not a reliable indicator of future results. Be sure to understand risks before making an investment decision.
Go Further
I encourage you to read the complete analyses of Kenvue Inc. and Church & Dwight Co., Inc. to enhance your investment decisions: