Home > Comparison > Consumer Defensive > CHD vs HELE
The strategic rivalry between Church & Dwight Co., Inc. and Helen of Troy Limited shapes the competitive landscape of the Consumer Defensive sector. Church & Dwight operates as a diversified manufacturer of household and specialty products with a broad brand portfolio. Helen of Troy focuses on innovative consumer goods across Home, Health, and Beauty segments. This analysis will assess which company’s operational model offers a superior risk-adjusted return for a diversified portfolio.
Table of contents
Companies Overview
Church & Dwight and Helen of Troy both command significant presence in the household and personal products market.
Church & Dwight Co., Inc.: Household Products Powerhouse
Church & Dwight dominates with a diversified portfolio of household and specialty products. Its core revenue stems from established brands like ARM & HAMMER, TROJAN, and OXICLEAN. In 2026, the company focused strategically on expanding its consumer domestic and international segments while innovating specialty products for industrial and livestock markets.
Helen of Troy Limited: Consumer Brands Innovator
Helen of Troy operates across home, health, and beauty sectors, generating revenue from a broad range of consumer products. Its strength lies in diverse brands such as OXO, Hydro Flask, and Braun. The 2026 strategy prioritized innovation in health and wellness appliances alongside expanding direct-to-consumer sales channels.
Strategic Collision: Similarities & Divergences
Both companies emphasize branded consumer goods but differ in approach: Church & Dwight leans on a closed ecosystem of trusted household staples, while Helen of Troy pursues a broader, lifestyle-oriented portfolio. Their primary battleground is consumer loyalty within household and wellness categories. This contrast defines distinct investment profiles—Church & Dwight offers steady defensive cash flow, Helen of Troy presents growth through innovation and niche expansion.
Income Statement Comparison
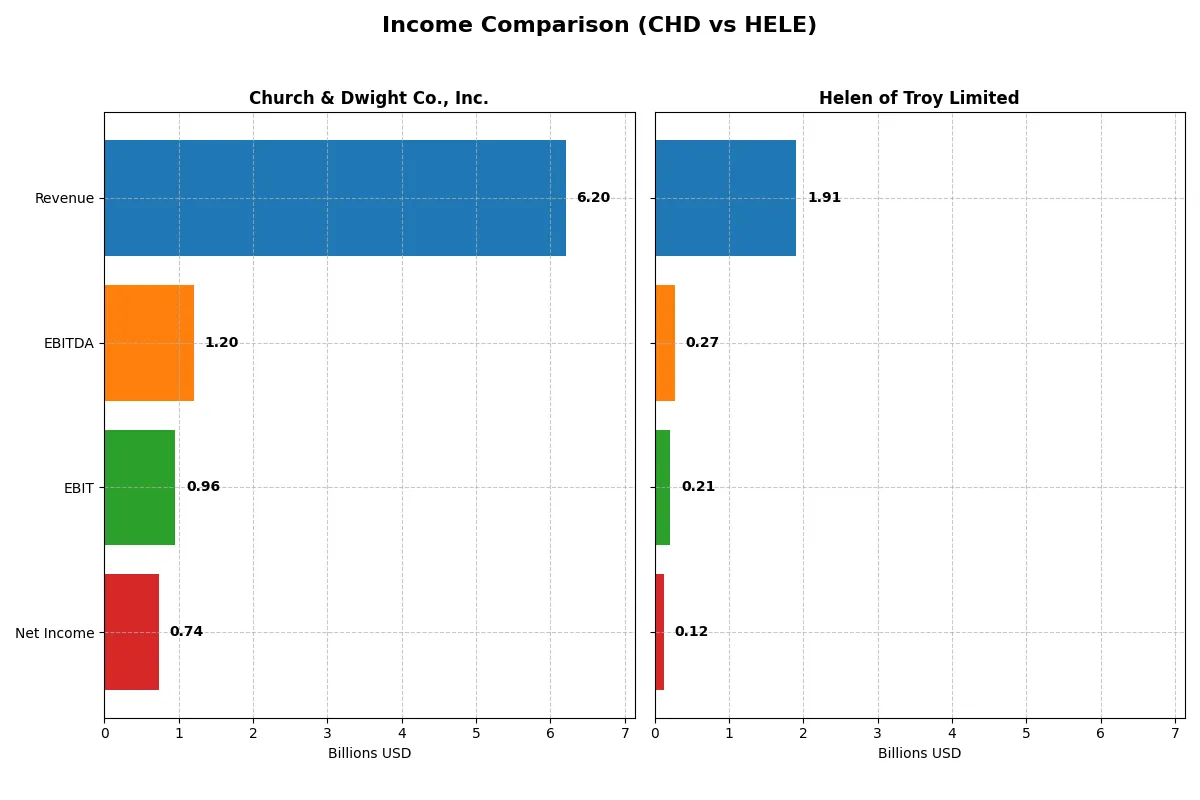
This data dissects the core profitability and scalability of both corporate engines to reveal who dominates the bottom line:
| Metric | Church & Dwight Co., Inc. (CHD) | Helen of Troy Limited (HELE) |
|---|---|---|
| Revenue | 6.2B | 1.91B |
| Cost of Revenue | 3.43B | 993M |
| Operating Expenses | 1.70B | 772M |
| Gross Profit | 2.77B | 914M |
| EBITDA | 1.20B | 269M |
| EBIT | 957M | 214M |
| Interest Expense | 0 | 52M |
| Net Income | 737M | 124M |
| EPS | 3.04 | 5.38 |
| Fiscal Year | 2025 | 2025 |
Income Statement Analysis: The Bottom-Line Duel
This income statement comparison reveals which corporate engine delivers superior operational efficiency and profit sustainability.
Church & Dwight Co., Inc. Analysis
Church & Dwight’s revenue grew steadily from $5.19B in 2021 to $6.20B in 2025. Net income showed volatility, peaking at $827M in 2021 before a dip and partial recovery to $737M in 2025. Gross margin remains robust near 44.7%, while net margin improved to 11.9% in 2025. The company demonstrates strong EBIT growth (+12.4% in 2025) and margin expansion, signaling improving operational leverage and profit momentum.
Helen of Troy Limited Analysis
Helen of Troy’s revenue declined from $2.10B in 2021 to $1.91B in 2025, reflecting contraction. Net income fell sharply from $254M to $124M over the same period. Despite a solid gross margin of 47.9%, net margin compressed to 6.5% in 2025. EBIT and EPS both declined in 2025, indicating margin pressure and deteriorating profitability. Operating expenses did not scale down proportionally, further eroding earnings momentum.
Margin Strength vs. Revenue Resilience
Church & Dwight outperforms Helen of Troy by combining revenue growth with expanding net margins and EBIT gains. Helen of Troy faces shrinking top line and profit erosion despite healthy gross margins. For investors prioritizing consistent earnings growth and margin stability, Church & Dwight’s profile presents a clearer fundamental advantage over Helen of Troy’s contracting earnings.
Financial Ratios Comparison
These vital ratios act as a diagnostic tool to expose the underlying fiscal health, valuation premiums, and capital efficiency of each company:
| Ratios | Church & Dwight Co., Inc. (CHD) | Helen of Troy Limited (HELE) |
|---|---|---|
| ROE | 18.4% | 7.35% |
| ROIC | 11.2% | 5.34% |
| P/E | 27.6 | 10.2 |
| P/B | 5.08 | 0.75 |
| Current Ratio | 1.07 | 2.00 |
| Quick Ratio | 0.71 | 1.03 |
| D/E | 0.55 | 0.57 |
| Debt-to-Assets | 24.7% | 30.5% |
| Interest Coverage | N/A | 2.75 |
| Asset Turnover | 0.70 | 0.61 |
| Fixed Asset Turnover | 7.54 | 5.23 |
| Payout ratio | 39.0% | 0% |
| Dividend yield | 1.41% | 0% |
| Fiscal Year | 2025 | 2025 |
Efficiency & Valuation Duel: The Vital Signs
Ratios act as a company’s DNA, exposing hidden risks and operational strengths that drive market performance and investor returns.
Church & Dwight Co., Inc.
Church & Dwight posts a strong ROE of 18.4% and a solid net margin of 11.9%, signaling efficient profitability. However, its P/E ratio of 27.6 marks the stock as expensive compared to market averages. The firm returns value through a modest 1.41% dividend yield, balancing shareholder rewards with measured reinvestment.
Helen of Troy Limited
Helen of Troy displays weaker profitability, with a 7.35% ROE and a 6.5% net margin, indicating operational challenges. Its valuation metrics are attractive, featuring a low P/E of 10.3 and a P/B of 0.75, suggesting an undervalued stock. The company does not pay dividends, likely channeling funds into growth and R&D initiatives.
Premium Valuation vs. Operational Safety
Church & Dwight offers superior profitability at a premium price, reflecting operational efficiency but higher risk. Helen of Troy provides a more conservative valuation with lower returns. Investors seeking growth and steady income may prefer Church & Dwight, while those favoring value and reinvestment might lean toward Helen of Troy.
Which one offers the Superior Shareholder Reward?
I observe Church & Dwight (CHD) pays a modest 1.41% dividend yield with a sustainable 39% payout ratio, backed by strong free cash flow coverage (2.97x). CHD also executes steady buybacks, enhancing total shareholder return. Helen of Troy (HELE) pays no dividends, focusing on reinvestment and growth, with a lower payout risk but less immediate income. HELE’s buybacks are less aggressive despite solid free cash flow, reflecting a growth-first strategy. In 2026, CHD’s balanced distribution combining dividends and buybacks offers a more attractive and reliable total return profile compared to HELE’s reinvestment-heavy approach.
Comparative Score Analysis: The Strategic Profile
The radar chart reveals the fundamental DNA and trade-offs of Church & Dwight Co., Inc. and Helen of Troy Limited:
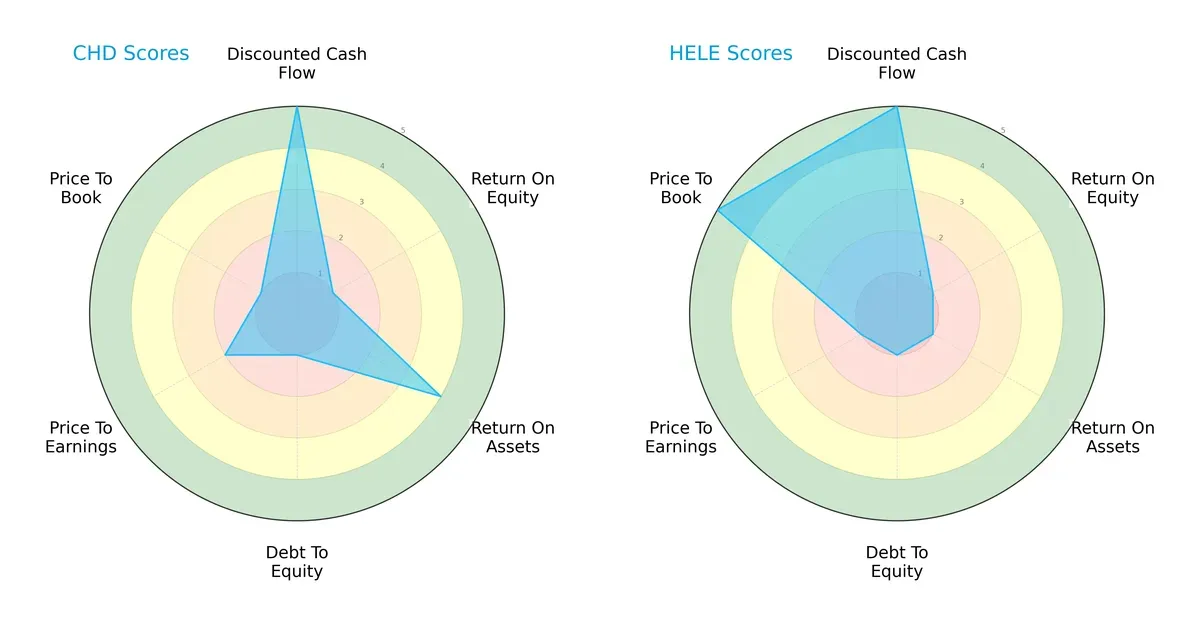
Church & Dwight exhibits a balanced profile with strong discounted cash flow (DCF) and return on assets (ROA) scores, but it struggles with return on equity (ROE) and debt-to-equity metrics. Helen of Troy leans heavily on its excellent price-to-book valuation, yet shows weaknesses in ROA, price-to-earnings (PE), and debt management. Overall, Church & Dwight offers more operational consistency, while Helen of Troy relies on valuation appeal.
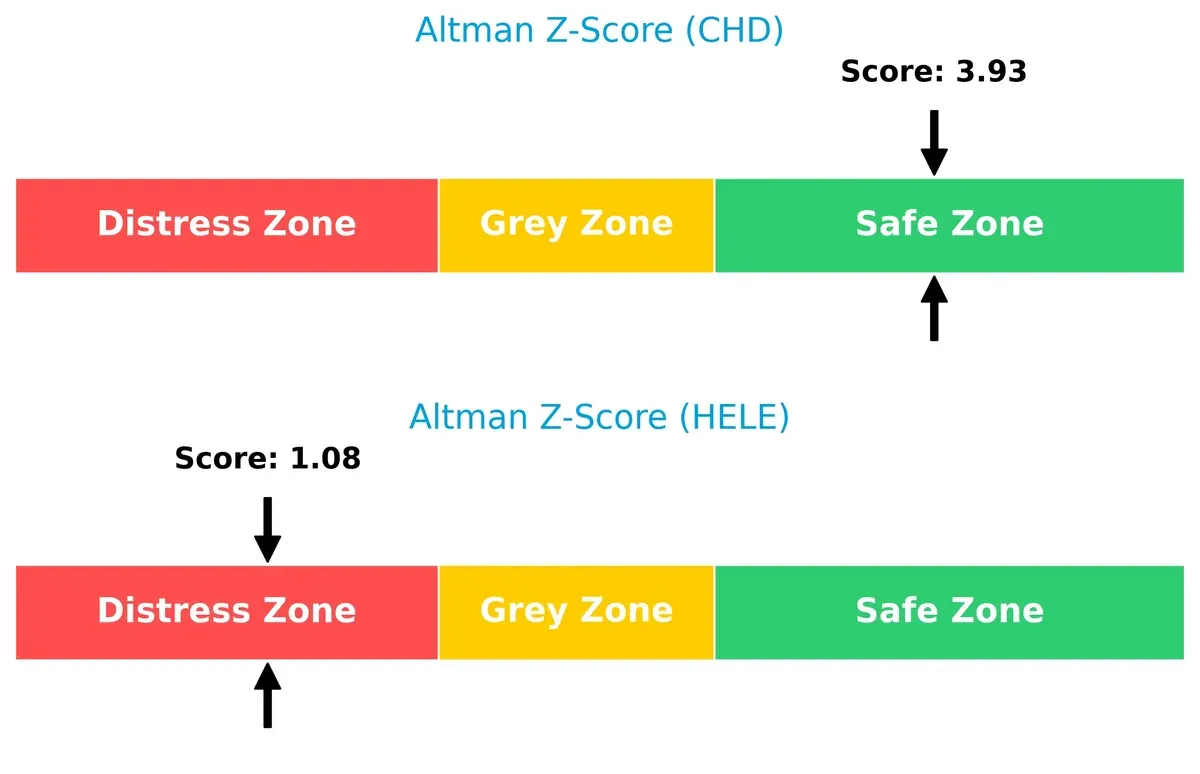
Bankruptcy Risk: Solvency Showdown
Church & Dwight’s Altman Z-Score of 3.93 places it comfortably in the safe zone, signaling strong financial resilience. Helen of Troy’s 1.08 score lands in the distress zone, indicating elevated bankruptcy risk in this cycle:
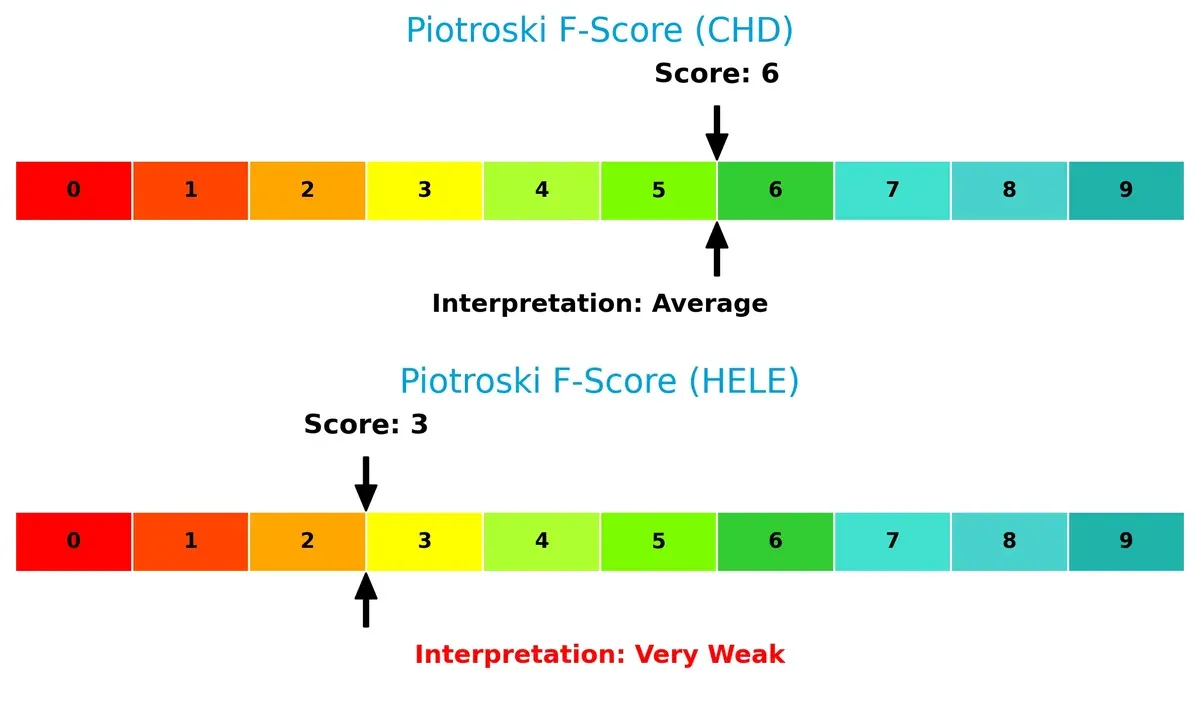
Financial Health: Quality of Operations
Church & Dwight’s Piotroski F-score of 6 reflects average financial health with no glaring red flags. In contrast, Helen of Troy’s score of 3 signals weak operational quality and potential internal financial stress:
How are the two companies positioned?
This section dissects the operational DNA of CHD and HELE by comparing their revenue distribution and internal strengths and weaknesses. The goal is to confront their economic moats and identify which business model offers the most resilient competitive advantage today.
Revenue Segmentation: The Strategic Mix
This visual comparison dissects how Church & Dwight and Helen of Troy diversify their income streams and where their primary sector bets lie:
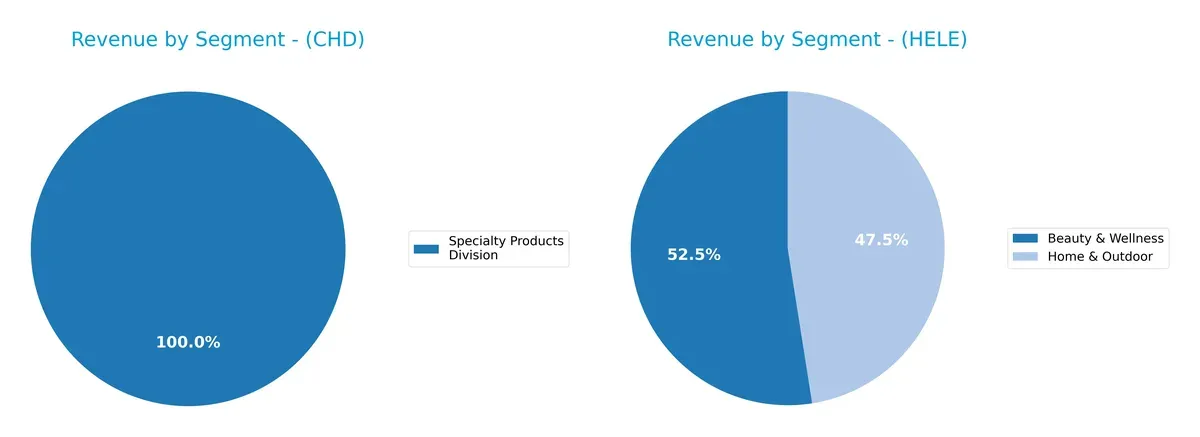
Church & Dwight anchors nearly all revenue in its Specialty Products Division, hovering around $300M annually, signaling high concentration risk. Helen of Troy, by contrast, dwarfs CHD’s scale and pivots on a diversified base: Beauty & Wellness at over $1B and Home & Outdoor near $900M in 2025. This mix reduces Helen of Troy’s risk and strengthens its ecosystem lock-in, while CHD’s reliance on a single segment limits strategic flexibility.
Strengths and Weaknesses Comparison
This table compares the Strengths and Weaknesses of Church & Dwight (CHD) and Helen of Troy (HELE):
CHD Strengths
- Higher net margin and ROE indicate stronger profitability
- Favorable ROIC vs. WACC shows efficient capital allocation
- Strong domestic and international revenue base exceeding 5.7B USD
- High fixed asset turnover reflects operational efficiency
HELE Strengths
- Lower valuation multiples (PE and PB) suggest potential undervaluation
- Favorable current and quick ratios indicate solid short-term liquidity
- Diversified product segments with Beauty & Wellness and Home & Outdoor over 1.9B USD
- Geographic presence includes US and multiple international regions
CHD Weaknesses
- Unfavorable PE and PB ratios imply premium valuation risk
- Quick ratio below 1 signals possible liquidity concerns
- Limited product diversification focused mainly on specialty products
- Neutral asset turnover could signal room for operational improvements
HELE Weaknesses
- Lower profitability ratios including ROE and net margin
- No dividend yield may deter income-focused investors
- Neutral debt to assets and interest coverage ratios suggest moderate leverage risk
- Smaller fixed asset turnover compared to CHD
Both companies show slightly favorable financial profiles but face distinct challenges. CHD’s premium valuation contrasts with HELE’s modest profitability. Each must balance growth with operational and financial efficiency within their strategic scope.
The Moat Duel: Analyzing Competitive Defensibility
A structural moat is the only true shield protecting long-term profits from relentless competitive erosion in dynamic markets:
Church & Dwight Co., Inc.: Intangible Assets & Brand Power
I see Church & Dwight’s moat rooted in strong brand recognition and diverse product portfolio. Its steady 11.9% net margin confirms pricing power and margin stability. Expansion in specialty segments could deepen this moat in 2026, despite a slight ROIC decline.
Helen of Troy Limited: Product Innovation & Niche Focus
Helen of Troy’s moat hinges on product innovation and niche market leadership, contrasting Church & Dwight’s broader brand moat. However, declining ROIC and net margin signal weakening competitive strength. New health and wellness products offer potential but face execution risks.
Brand Equity vs. Innovation Resilience
Church & Dwight holds the deeper moat with consistent value creation and margin stability. Helen of Troy’s weakening ROIC undermines its competitive edge. Thus, Church & Dwight appears better equipped to defend market share long term.
Which stock offers better returns?
The stock price chart illustrates contrasting trends for Church & Dwight Co., Inc. and Helen of Troy Limited over the past year, highlighting key shifts in momentum and trading volumes.
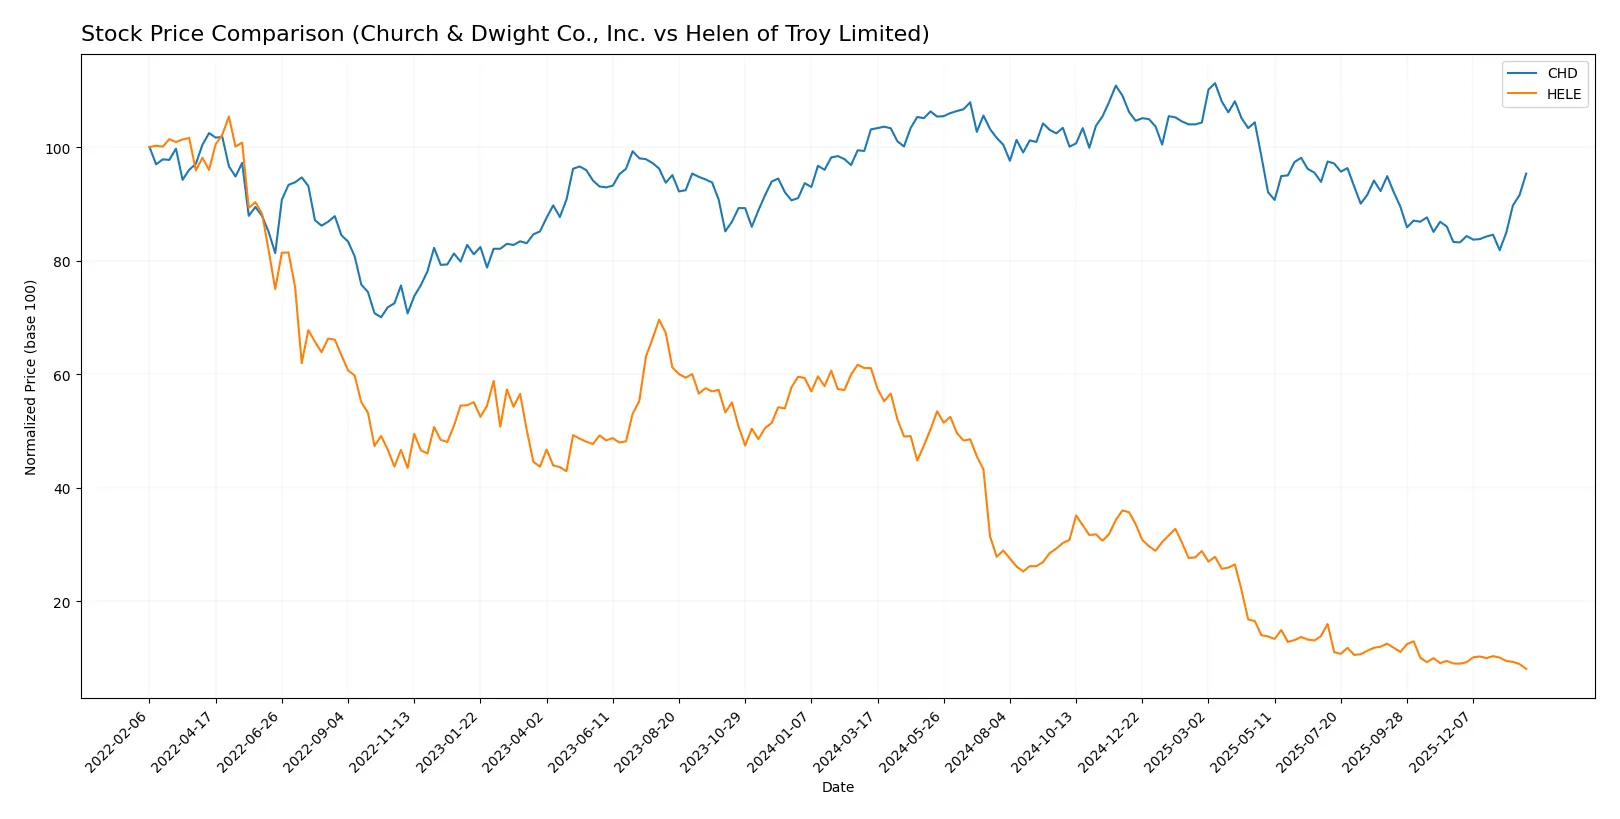
Trend Comparison
Church & Dwight Co., Inc. shows a bearish trend with a 7.56% price decline over the past 12 months, yet recent acceleration indicates a 14.45% gain since November 2025. Volatility remains moderate at 7.84.
Helen of Troy Limited’s stock exhibits a sharp bearish trend, plunging 86.68% over the past year. It continues to decline with a 10.49% drop since November 2025 amid high volatility at 29.84.
Church & Dwight outperformed Helen of Troy, delivering a less severe loss overall and recent positive momentum, while Helen’s stock suffered a steep decline with persistent weakness.
Target Prices
Analysts present a clear consensus on target prices for Church & Dwight Co., Inc. and Helen of Troy Limited.
| Company | Target Low | Target High | Consensus |
|---|---|---|---|
| Church & Dwight Co., Inc. | 82 | 102 | 96.25 |
| Helen of Troy Limited | 22 | 22 | 22 |
The consensus target for Church & Dwight aligns exactly with its current price of $96.25, indicating a fair valuation. Helen of Troy’s consensus target of $22 significantly exceeds its $16.56 share price, suggesting potential upside.

Don’t Let Luck Decide Your Entry Point
Optimize your entry points with our advanced ProRealTime indicators. You’ll get efficient buy signals with precise price targets for maximum performance. Start outperforming now!
How do institutions grade them?
The following tables summarize recent institutional grades and actions for both companies:
Church & Dwight Co., Inc. Grades
This table shows the latest grades and rating changes from reputable analysts for Church & Dwight Co., Inc.:
| Grading Company | Action | New Grade | Date |
|---|---|---|---|
| Jefferies | Maintain | Buy | 2026-01-28 |
| UBS | Maintain | Neutral | 2026-01-14 |
| TD Cowen | Maintain | Hold | 2026-01-08 |
| Wells Fargo | Maintain | Overweight | 2026-01-05 |
| Raymond James | Upgrade | Outperform | 2026-01-05 |
| Jefferies | Upgrade | Buy | 2025-12-17 |
| Citigroup | Upgrade | Neutral | 2025-12-17 |
| Deutsche Bank | Maintain | Buy | 2025-12-10 |
| Argus Research | Maintain | Buy | 2025-12-04 |
| Barclays | Maintain | Underweight | 2025-11-04 |
Helen of Troy Limited Grades
This table presents recent institutional grades and rating actions for Helen of Troy Limited:
| Grading Company | Action | New Grade | Date |
|---|---|---|---|
| Canaccord Genuity | Maintain | Hold | 2026-01-09 |
| UBS | Maintain | Neutral | 2026-01-09 |
| Canaccord Genuity | Maintain | Hold | 2026-01-06 |
| Canaccord Genuity | Maintain | Hold | 2025-10-10 |
| UBS | Maintain | Neutral | 2025-10-10 |
| UBS | Maintain | Neutral | 2025-10-02 |
| UBS | Maintain | Neutral | 2025-07-11 |
| Canaccord Genuity | Downgrade | Hold | 2025-07-11 |
| Canaccord Genuity | Maintain | Buy | 2025-07-07 |
| Canaccord Genuity | Maintain | Buy | 2025-04-25 |
Which company has the best grades?
Church & Dwight Co., Inc. holds relatively stronger grades, with multiple Buy and Outperform ratings and several upgrades. Helen of Troy Limited’s grades cluster around Hold and Neutral, with fewer upgrades and some downgrades. Investors may perceive Church & Dwight as having a more favorable analyst outlook, potentially impacting confidence and valuation.
Risks specific to each company
The following categories identify critical pressure points and systemic threats facing both firms in the 2026 market environment:
1. Market & Competition
Church & Dwight Co., Inc.
- Strong brand portfolio supports steady market share in household products. Faces pressure from large FMCG competitors and private labels.
Helen of Troy Limited
- Niche consumer segments with diverse brands, but struggles with scale and intense competition in health and beauty sectors.
2. Capital Structure & Debt
Church & Dwight Co., Inc.
- Moderate debt-to-equity (0.55) and low debt-to-assets (24.7%) indicate balanced leverage and financial prudence. Interest coverage infinite, showing strong capacity to service debt.
Helen of Troy Limited
- Similar debt-to-equity ratio (0.57) but higher debt-to-assets (30.6%) and weaker interest coverage (4.11), signaling tighter debt service capacity.
3. Stock Volatility
Church & Dwight Co., Inc.
- Low beta (0.46) reflects defensive stock behavior with lower systematic risk than market.
Helen of Troy Limited
- Higher beta (0.78) exposes stock to more volatility and market swings.
4. Regulatory & Legal
Church & Dwight Co., Inc.
- Operates in regulated consumer goods with potential risks from product safety and labeling standards.
Helen of Troy Limited
- Similar regulatory exposure, with additional scrutiny in health and wellness product claims.
5. Supply Chain & Operations
Church & Dwight Co., Inc.
- Diversified supply chain supports resilience but relies on global sourcing, vulnerable to disruptions.
Helen of Troy Limited
- Smaller scale supply chain less diversified, increasing operational risk during global supply constraints.
6. ESG & Climate Transition
Church & Dwight Co., Inc.
- Established sustainability programs but faces pressure to reduce carbon footprint in manufacturing.
Helen of Troy Limited
- Emerging ESG initiatives but lags behind industry leaders, risking reputational and compliance costs.
7. Geopolitical Exposure
Church & Dwight Co., Inc.
- Broad international footprint exposes firm to currency and trade policy risks but offers geographic diversification.
Helen of Troy Limited
- Also global but smaller footprint increases vulnerability to regional disruptions and trade tensions.
Which company shows a better risk-adjusted profile?
Church & Dwight’s strongest risk lies in competitive pressures from large FMCG firms, but its sound capital structure and low stock volatility mitigate those risks. Helen of Troy faces significant financial distress risk, shown by a low Altman Z-score and weaker profitability metrics. Its higher stock volatility and tighter debt servicing capacity add to concerns. Thus, Church & Dwight presents a superior risk-adjusted profile, bolstered by stable leverage, strong market positioning, and defensive stock behavior. Helen of Troy’s recent financial weakness and distress-zone Z-score deserve caution.
Final Verdict: Which stock to choose?
Church & Dwight Co., Inc. (CHD) excels as a cash-generating powerhouse with a durable competitive edge in consumer staples. Its ability to consistently generate returns above its cost of capital demonstrates disciplined capital allocation. A point of vigilance remains in its slightly declining profitability trend. CHD suits portfolios targeting stable, long-term growth.
Helen of Troy Limited (HELE) offers a strategic moat built on diversified consumer product lines and favorable valuation metrics. Its strong liquidity and lower valuation multiples suggest a margin of safety compared to CHD. However, the company struggles with shrinking returns and profitability erosion. HELE fits portfolios focused on value and turnaround potential.
If you prioritize consistent value creation and operational resilience, CHD emerges as the compelling choice due to its superior economic moat and income quality. However, if you seek undervalued opportunities with potential for recovery, HELE offers better stability in valuation but carries higher risk given its deteriorating profitability and financial distress signals.
Disclaimer: Investment carries a risk of loss of initial capital. The past performance is not a reliable indicator of future results. Be sure to understand risks before making an investment decision.
Go Further
I encourage you to read the complete analyses of Church & Dwight Co., Inc. and Helen of Troy Limited to enhance your investment decisions: