Home > Comparison > Consumer Defensive > CHD vs ELF
The strategic rivalry between Church & Dwight Co., Inc. and e.l.f. Beauty, Inc. shapes the consumer defensive sector’s evolution. Church & Dwight operates as a diversified household and personal products manufacturer with a broad, capital-intensive portfolio. In contrast, e.l.f. Beauty focuses on high-growth, direct-to-consumer cosmetics with a leaner operational model. This analysis will assess which company’s trajectory delivers superior risk-adjusted returns for a diversified portfolio amidst shifting consumer trends.
Table of contents
Companies Overview
Church & Dwight and e.l.f. Beauty stand as key players in the competitive household and personal products sector.
Church & Dwight Co., Inc.: Diverse Consumer Products Powerhouse
Church & Dwight dominates as a manufacturer of household and personal care products. Its revenue hinges on a broad portfolio including ARM & HAMMER baking soda, TROJAN condoms, and OXICLEAN cleaners. In 2026, the company focuses on expanding its specialty products division while strengthening its presence across domestic and international markets.
e.l.f. Beauty, Inc.: Innovative Cosmetics and Skincare Brand
e.l.f. Beauty excels as a provider of cosmetics and skincare products globally. Its revenue primarily derives from direct-to-consumer sales and retail partnerships, featuring brands like e.l.f. Cosmetics and Well People. The company’s 2026 strategy emphasizes digital channel growth and international distribution expansion to capture evolving consumer trends.
Strategic Collision: Similarities & Divergences
Church & Dwight relies on a diversified product suite with established brands, while e.l.f. Beauty pursues a focused, digitally driven beauty niche. Both compete in personal care but target different consumer segments and sales channels. Their distinct approaches create unique investment profiles: one rooted in legacy scale, the other in agile innovation.
Income Statement Comparison
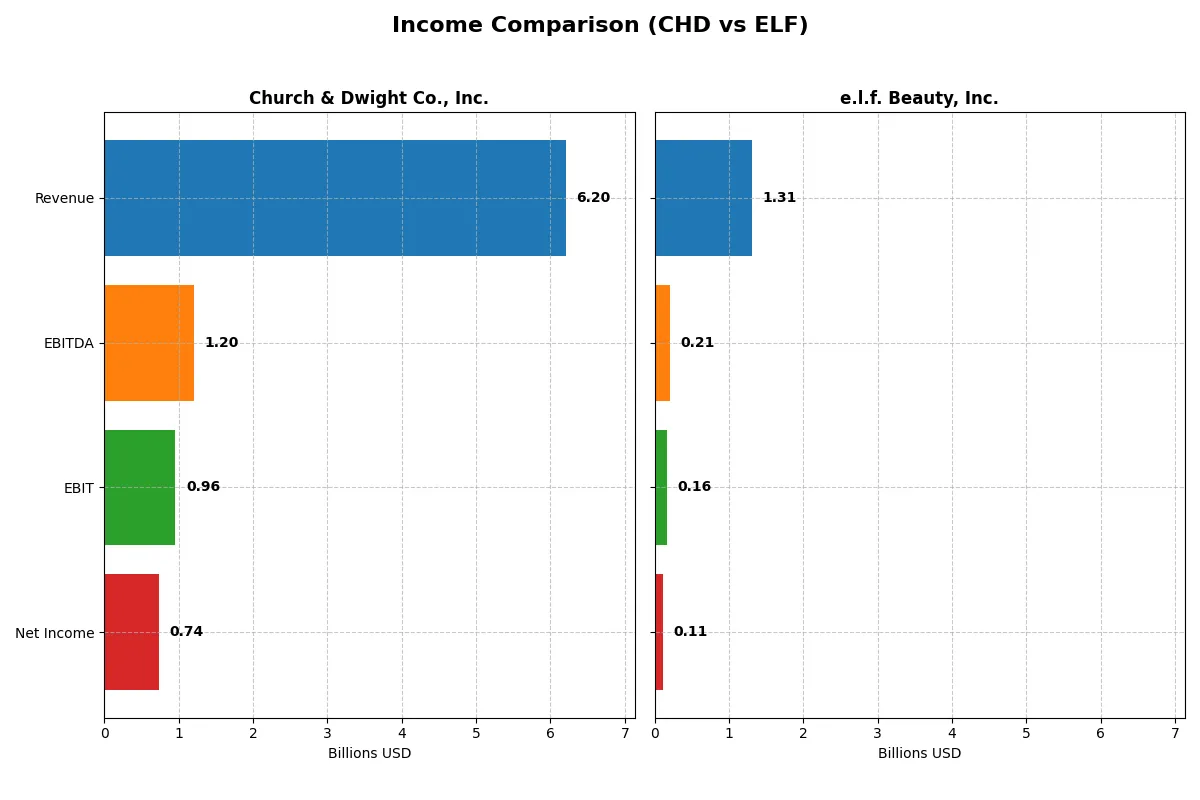
The following data dissects the core profitability and scalability of both corporate engines to reveal who dominates the bottom line:
| Metric | Church & Dwight Co., Inc. (CHD) | e.l.f. Beauty, Inc. (ELF) |
|---|---|---|
| Revenue | 6.20B | 1.31B |
| Cost of Revenue | 3.43B | 378M |
| Operating Expenses | 1.70B | 778M |
| Gross Profit | 2.77B | 936M |
| EBITDA | 1.20B | 206M |
| EBIT | 957M | 162M |
| Interest Expense | 0 | 17M |
| Net Income | 737M | 112M |
| EPS | 3.04 | 1.99 |
| Fiscal Year | 2025 | 2025 |
Income Statement Analysis: The Bottom-Line Duel
This income statement comparison reveals which company operates its business more efficiently and drives stronger profitability.
Church & Dwight Co., Inc. Analysis
Church & Dwight’s revenue grew steadily from $5.19B in 2021 to $6.20B in 2025, showing consistent top-line expansion. Net income fluctuated, peaking at $828M in 2021 and settling at $737M in 2025. Its gross margin remains healthy near 45%, while the net margin improved to 11.9%, reflecting solid cost control and improving profitability in the latest year.
e.l.f. Beauty, Inc. Analysis
e.l.f. Beauty’s revenue surged from $318M in 2021 to $1.31B in 2025, reflecting rapid growth momentum. Net income expanded dramatically from $6.2M to $112M over this period. The company enjoys a strong gross margin of 71%, although net margin lags at 8.5%, pressured by rising operating expenses amid aggressive expansion in 2025.
Margin Stability vs. High Growth Momentum
Church & Dwight delivers stable margin performance with moderate revenue growth, signaling operational efficiency and reliable profitability. e.l.f. Beauty impresses with explosive revenue and net income growth but at the expense of lower net margin expansion and higher cost absorption. Investors seeking steady margin strength may favor Church & Dwight, while those prioritizing growth might find e.l.f. more attractive despite margin pressure.
Financial Ratios Comparison
These vital ratios act as a diagnostic tool to expose the underlying fiscal health, valuation premiums, and capital efficiency of the companies compared:
| Ratios | Church & Dwight Co., Inc. (CHD) | e.l.f. Beauty, Inc. (ELF) |
|---|---|---|
| ROE | 18.4% | 14.7% |
| ROIC | 11.2% | 11.2% |
| P/E | 27.6 | 31.5 |
| P/B | 5.08 | 4.64 |
| Current Ratio | 1.07 | 3.05 |
| Quick Ratio | 0.71 | 2.00 |
| D/E | 0.55 | 0.41 |
| Debt-to-Assets | 24.7% | 25.1% |
| Interest Coverage | N/A | 9.2 |
| Asset Turnover | 0.70 | 1.05 |
| Fixed Asset Turnover | 7.54 | 45.6 |
| Payout ratio | 39.0% | 0% |
| Dividend yield | 1.41% | 0% |
| Fiscal Year | 2025 | 2025 |
Efficiency & Valuation Duel: The Vital Signs
Financial ratios serve as a company’s DNA, unveiling hidden risks and operational strengths critical to investment decisions.
Church & Dwight Co., Inc.
Church & Dwight demonstrates robust profitability with an 18.4% ROE and a healthy 11.9% net margin, signaling operational efficiency. However, its valuation appears stretched, with a P/E of 27.6 and a P/B of 5.08, both unfavorable. The firm returns value via a 1.41% dividend yield, balancing growth and shareholder income.
e.l.f. Beauty, Inc.
e.l.f. Beauty shows moderate profitability, with a 14.7% ROE and an 8.5% net margin, reflecting steady but less pronounced efficiency. Its valuation is also stretched, with a higher P/E of 31.5 and P/B of 4.64. The company pays no dividend, focusing on reinvestment to drive growth and operational leverage.
Valuation Pressure vs. Operational Strength
Church & Dwight offers stronger profitability and a modest dividend, balancing risk and reward more favorably. e.l.f. Beauty trades at higher multiples with no dividend, fitting investors prioritizing growth over income. The trade-off hinges on preference for operational safety versus growth appetite.
Which one offers the Superior Shareholder Reward?
Church & Dwight (CHD) delivers a 1.41% dividend yield with a conservative 39% payout ratio, supported by a 2.97x dividend-and-capex coverage ratio. It also runs moderate buybacks, enhancing total returns. e.l.f. Beauty (ELF) pays no dividend but aggressively reinvests in growth and R&D, with no buybacks. Historically, CHD’s balanced distribution model offers more sustainable shareholder returns in 2026, blending income and capital appreciation. I conclude CHD provides the superior total return profile for long-term investors seeking both yield and capital discipline.
Comparative Score Analysis: The Strategic Profile
The radar chart reveals the fundamental DNA and trade-offs of Church & Dwight Co., Inc. and e.l.f. Beauty, Inc., highlighting their core financial traits:
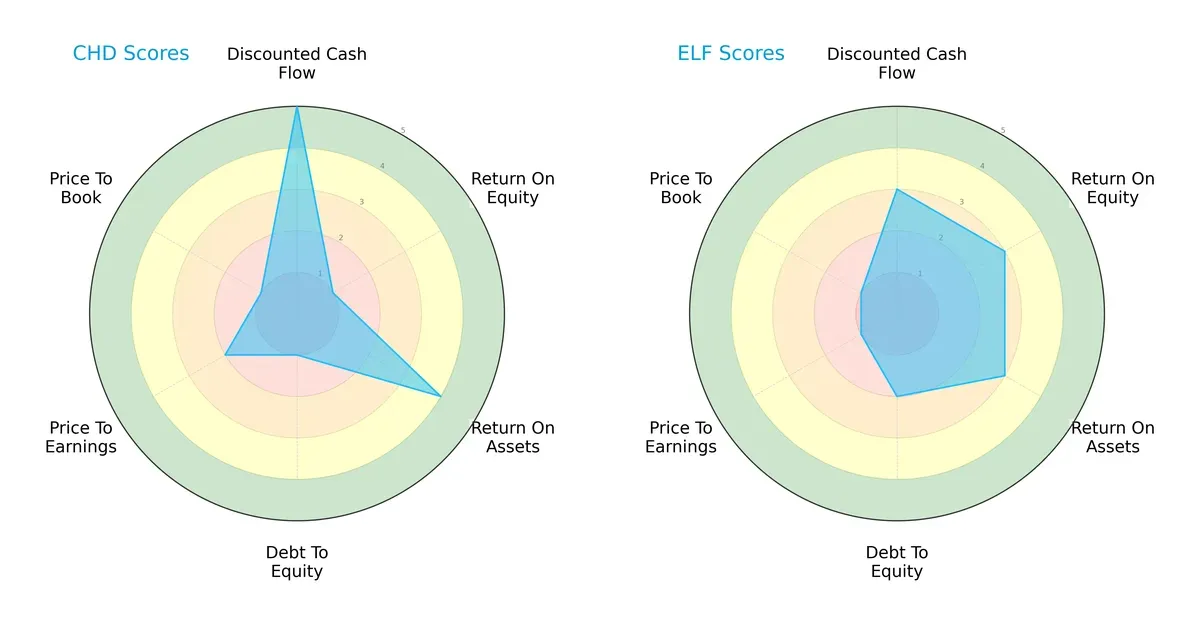
Church & Dwight leads in discounted cash flow (DCF) and return on assets (ROA), showcasing strong cash generation and asset efficiency. e.l.f. Beauty holds an advantage in return on equity (ROE) and debt-to-equity scores, reflecting moderate profitability and better leverage control. Valuation metrics (PE/PB) are weak for both, but Church & Dwight’s profile is less balanced, relying heavily on cash flow strength, while e.l.f. Beauty presents a more evenly distributed financial stance.
Bankruptcy Risk: Solvency Showdown
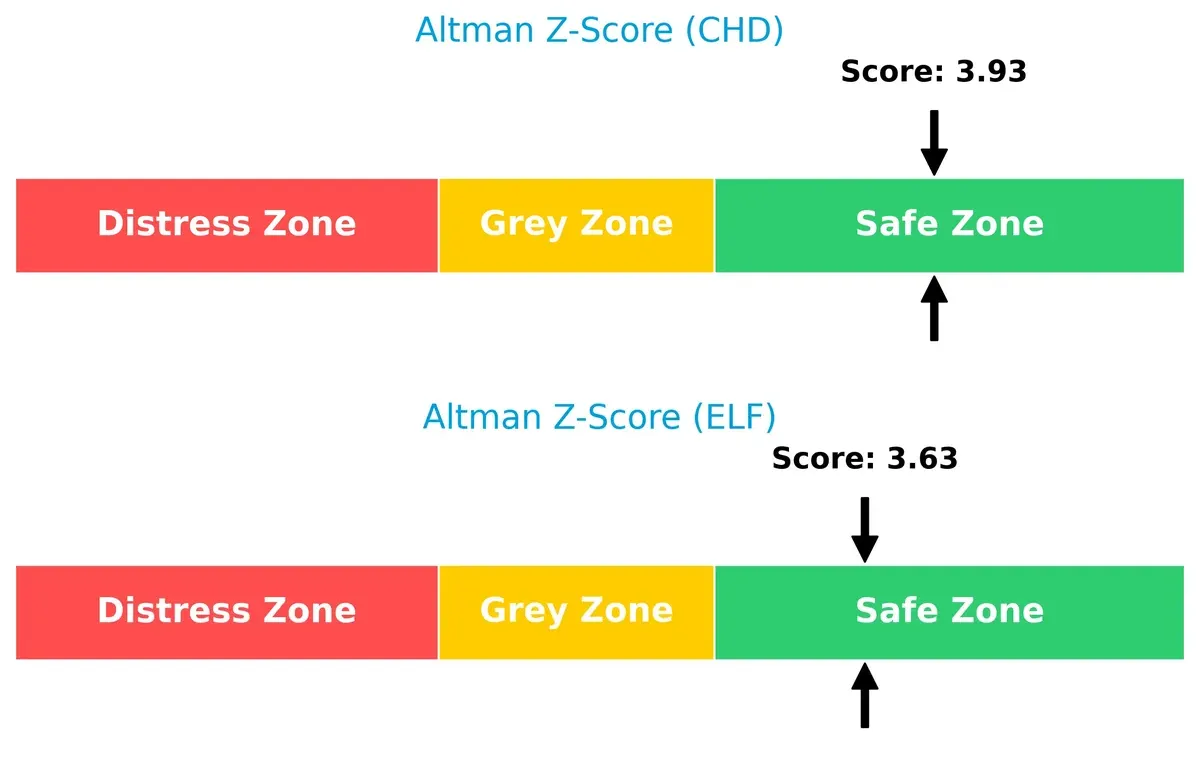
Church & Dwight’s Altman Z-Score of 3.93 edges out e.l.f. Beauty’s 3.63, both comfortably in the safe zone, signaling robust solvency and low bankruptcy risk during this market cycle:
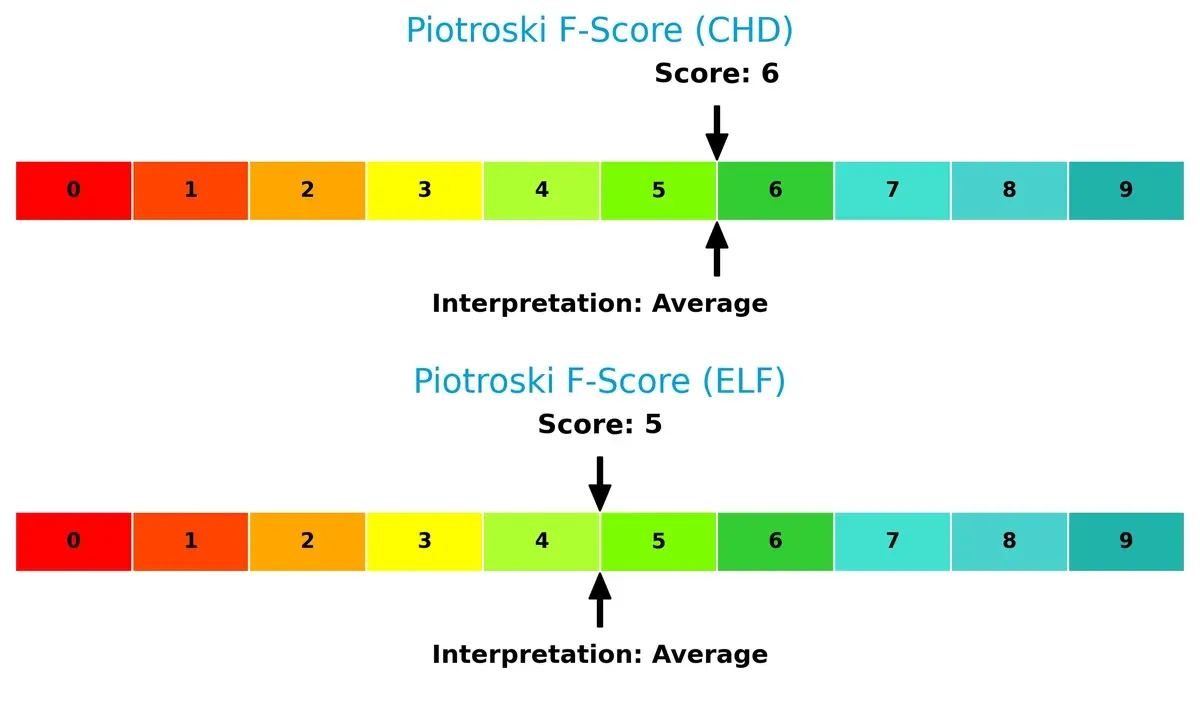
Financial Health: Quality of Operations
Church & Dwight posts a Piotroski F-Score of 6, slightly above e.l.f. Beauty’s 5, indicating stronger financial health and fewer internal red flags in operational efficiency and profitability:
How are the two companies positioned?
This section dissects the operational DNA of CHD and ELF by comparing their revenue distribution by segment and internal strengths and weaknesses. The goal is to confront their economic moats and identify which business model delivers the most resilient, sustainable competitive advantage today.
Revenue Segmentation: The Strategic Mix
This visual comparison dissects how both firms diversify their income streams and where their primary sector bets lie:
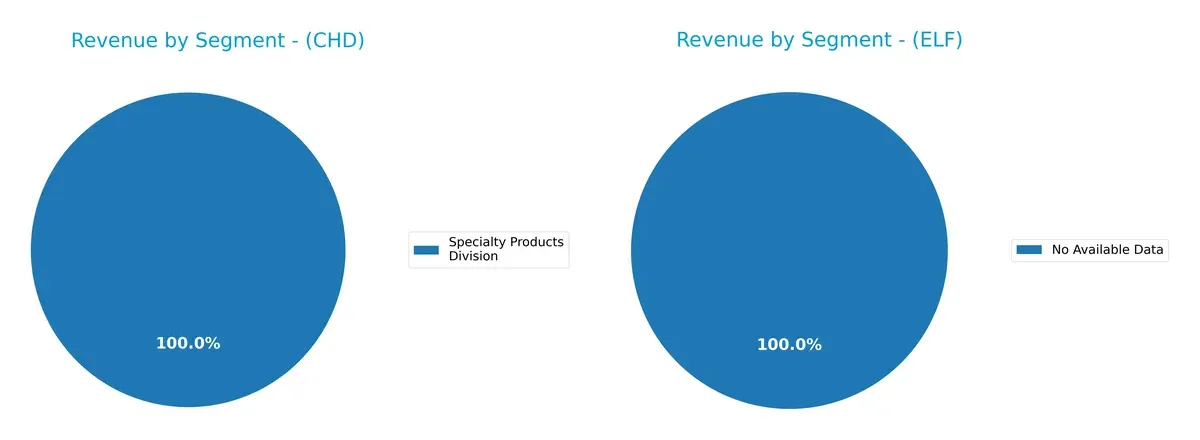
Church & Dwight Co., Inc. relies exclusively on its Specialty Products Division, generating $303M in 2024, showing a highly concentrated revenue base. e.l.f. Beauty, Inc. lacks available segment data, preventing a direct diversification comparison. Church & Dwight’s single-segment focus anchors its strategy in a stable niche but raises concentration risk. Without segment diversity, the company depends heavily on this division’s performance to sustain growth and weather market shifts.
Strengths and Weaknesses Comparison
This table compares the Strengths and Weaknesses of Church & Dwight and e.l.f. Beauty based on diversification, profitability, financials, innovation, global reach, and market share:
Church & Dwight Strengths
- Diverse product segments including specialty products
- Strong profitability with favorable net margin and ROE
- Solid international and domestic revenue streams
- Favorable debt to asset ratio and interest coverage
- Efficient fixed asset turnover
e.l.f. Beauty Strengths
- Favorable quick ratio and low debt to equity ratio
- Strong fixed asset turnover and asset turnover
- Growing U.S. and non-U.S. revenues
- Favorable interest coverage ratio
Church & Dwight Weaknesses
- Unfavorable PE and PB ratios indicate overvaluation risk
- Quick ratio below 1 signals liquidity concerns
- Neutral current ratio might limit short-term flexibility
e.l.f. Beauty Weaknesses
- Unfavorable ROIC vs. WACC implies weak capital efficiency
- High WACC increases cost of capital
- Elevated PE and PB ratios suggest valuation risk
- Unfavorable current ratio despite strong quick ratio
- Zero dividend yield limits income appeal
Church & Dwight’s strengths lie in balanced profitability, diversification, and solid financial health, though valuation and some liquidity metrics warrant caution. e.l.f. Beauty shows operational efficiency and liquidity strengths but faces challenges in capital cost and valuation, indicating a need to improve financial robustness.
The Moat Duel: Analyzing Competitive Defensibility
A structural moat is the only true shield preserving long-term profits from relentless competition erosion. Let’s dissect the defenses of two rivals:
Church & Dwight Co., Inc.: Diversified Brand Portfolio with Cost Advantage
Church & Dwight leverages a broad brand portfolio and cost efficiency, reflected in a 5.5% ROIC premium over WACC and stable margins. Yet, its declining ROIC trend signals margin pressure in 2026.
e.l.f. Beauty, Inc.: Rapid Growth Fueled by Innovation and Market Penetration
e.l.f. rides product innovation and strong DTC channels, with soaring revenue growth above 300% over five years. However, ROIC lags WACC, indicating current value destruction despite improving profitability.
Defensive Depth: Cost Efficiency vs. Growth Momentum
Church & Dwight possesses a wider moat through consistent value creation and margin resilience. e.l.f. shows potential but must convert growth into sustainable returns to defend market share effectively.
Which stock offers better returns?
The past year saw both stocks decline sharply, with recent months showing a marked recovery in price and trading activity.
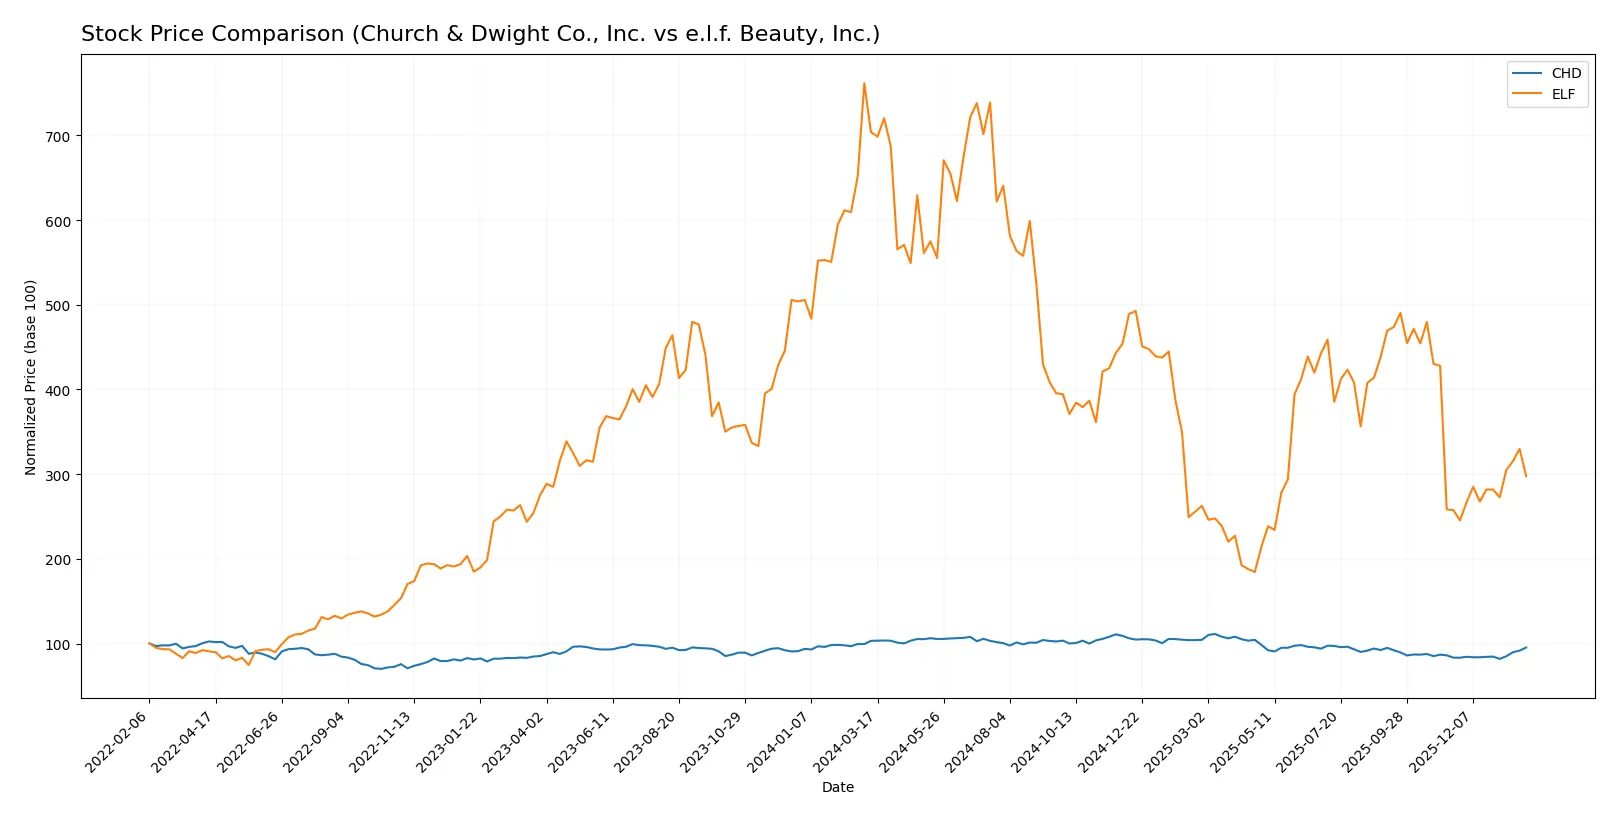
Trend Comparison
Church & Dwight Co., Inc. (CHD) stock declined 7.56% over the past 12 months, showing a bearish trend with accelerating downward momentum. The price fluctuated between 82.64 and 112.33, with recent gains of 14.45% signaling a potential rebound.
e.l.f. Beauty, Inc. (ELF) experienced a steep 57.7% drop, also bearish and accelerating, marked by high volatility and a price range from 52.65 to 210.9. Recent gains of 15.62% indicate a strong short-term recovery.
Comparing trends, both stocks faced bearish pressure over 12 months. e.l.f. Beauty showed more severe losses but slightly stronger recent recovery. CHD delivered higher overall market performance.
Target Prices
Analysts present a moderately bullish consensus for both Church & Dwight Co., Inc. and e.l.f. Beauty, Inc.
| Company | Target Low | Target High | Consensus |
|---|---|---|---|
| Church & Dwight Co., Inc. | 82 | 102 | 96.25 |
| e.l.f. Beauty, Inc. | 85 | 165 | 111.83 |
The target consensus for Church & Dwight matches its current price, indicating fair valuation. e.l.f. Beauty’s higher consensus above the current price suggests potential upside but with wider analyst disagreement.

Don’t Let Luck Decide Your Entry Point
Optimize your entry points with our advanced ProRealTime indicators. You’ll get efficient buy signals with precise price targets for maximum performance. Start outperforming now!
How do institutions grade them?
Church & Dwight Co., Inc. Grades
Below are the latest grades from major financial institutions for Church & Dwight Co., Inc.:
| Grading Company | Action | New Grade | Date |
|---|---|---|---|
| Jefferies | Maintain | Buy | 2026-01-28 |
| UBS | Maintain | Neutral | 2026-01-14 |
| TD Cowen | Maintain | Hold | 2026-01-08 |
| Wells Fargo | Maintain | Overweight | 2026-01-05 |
| Raymond James | Upgrade | Outperform | 2026-01-05 |
| Jefferies | Upgrade | Buy | 2025-12-17 |
| Citigroup | Upgrade | Neutral | 2025-12-17 |
| Deutsche Bank | Maintain | Buy | 2025-12-10 |
| Argus Research | Maintain | Buy | 2025-12-04 |
| Barclays | Maintain | Underweight | 2025-11-04 |
e.l.f. Beauty, Inc. Grades
This table summarizes recent institutional grades for e.l.f. Beauty, Inc.:
| Grading Company | Action | New Grade | Date |
|---|---|---|---|
| TD Cowen | Maintain | Buy | 2026-01-21 |
| UBS | Maintain | Neutral | 2026-01-14 |
| Piper Sandler | Maintain | Neutral | 2025-12-22 |
| JP Morgan | Maintain | Overweight | 2025-12-18 |
| Goldman Sachs | Maintain | Buy | 2025-11-07 |
| Piper Sandler | Downgrade | Neutral | 2025-11-06 |
| UBS | Maintain | Neutral | 2025-11-06 |
| Canaccord Genuity | Maintain | Buy | 2025-11-06 |
| JP Morgan | Maintain | Overweight | 2025-11-06 |
| Baird | Maintain | Outperform | 2025-11-06 |
Which company has the best grades?
Church & Dwight exhibits a stronger consensus with multiple Buy and Outperform ratings, including recent upgrades. e.l.f. Beauty shows mixed sentiment, with several Neutral grades and one downgrade. Investors may interpret Church & Dwight’s grades as a more bullish institutional outlook.
Risks specific to each company
The following categories identify the critical pressure points and systemic threats facing both firms in the 2026 market environment:
1. Market & Competition
Church & Dwight Co., Inc.
- Established brand portfolio with steady demand in household and personal products markets. Faces mature market saturation risks.
e.l.f. Beauty, Inc.
- Fast-growing cosmetics brand with higher growth potential but fierce competition and volatility in beauty trends.
2. Capital Structure & Debt
Church & Dwight Co., Inc.
- Moderate debt-to-equity ratio at 0.55, manageable leverage with strong interest coverage (infinite).
e.l.f. Beauty, Inc.
- Lower debt-to-equity at 0.41 with solid interest coverage (9.44), reflecting conservative leverage profile.
3. Stock Volatility
Church & Dwight Co., Inc.
- Low beta at 0.46 indicates defensive stock with lower volatility versus market.
e.l.f. Beauty, Inc.
- High beta of 1.72 signals significant price swings and higher market risk exposure.
4. Regulatory & Legal
Church & Dwight Co., Inc.
- Operates in consumer defensive sector with stable regulatory environment but must comply with product safety laws.
e.l.f. Beauty, Inc.
- Faces evolving cosmetics regulations and potential scrutiny on ingredient safety and marketing claims.
5. Supply Chain & Operations
Church & Dwight Co., Inc.
- Complex supply chain across diversified product lines; risk from raw material costs and logistics disruptions.
e.l.f. Beauty, Inc.
- More focused supply chain but vulnerable to e-commerce distribution challenges and international logistics.
6. ESG & Climate Transition
Church & Dwight Co., Inc.
- Increasing pressure to enhance sustainability in packaging and sourcing amid consumer demand for ESG transparency.
e.l.f. Beauty, Inc.
- Emerging brand with opportunity to integrate ESG from the start but must avoid greenwashing accusations.
7. Geopolitical Exposure
Church & Dwight Co., Inc.
- Moderate international presence exposes it to trade tensions and currency fluctuations.
e.l.f. Beauty, Inc.
- Limited global footprint reduces geopolitical risks but constrains diversification benefits.
Which company shows a better risk-adjusted profile?
Church & Dwight faces moderate operational and market risks but benefits from a strong balance sheet and low stock volatility. e.l.f. Beauty exhibits higher growth prospects but endures greater stock volatility and regulatory uncertainty. The safety indicated by Church & Dwight’s Altman Z-score of 3.93 and low beta favor a better risk-adjusted profile. Meanwhile, e.l.f.’s higher beta (1.72) and neutral Piotroski score highlight elevated risk. Recent data show Church & Dwight’s stable interest coverage and diversified brand portfolio underpin its defensive positioning. Conversely, e.l.f.’s valuation metrics and volatility flag caution despite growth potential. I conclude Church & Dwight offers the more resilient risk-reward balance in 2026.
Final Verdict: Which stock to choose?
Church & Dwight’s superpower lies in its robust value creation, generating returns comfortably above its cost of capital. Its steady cash flow and brand moat support resilience. However, a cautious eye is needed on its declining profitability trend. It suits portfolios seeking stable income with moderate growth.
e.l.f. Beauty commands a strategic moat through rapid revenue expansion and brand momentum in the beauty segment. Its improving profitability signals potential, yet it carries higher valuation and financial leverage risks. This fits growth-oriented investors who tolerate volatility for outsized upside.
If you prioritize capital preservation and consistent value generation, Church & Dwight is the compelling choice due to its proven moat and cash flow strength. However, if you seek aggressive growth and can handle elevated risk, e.l.f. Beauty offers better growth momentum and improving returns despite current valuation premiums.
Disclaimer: Investment carries a risk of loss of initial capital. The past performance is not a reliable indicator of future results. Be sure to understand risks before making an investment decision.
Go Further
I encourage you to read the complete analyses of Church & Dwight Co., Inc. and e.l.f. Beauty, Inc. to enhance your investment decisions: