Home > Comparison > Consumer Defensive > CHD vs COTY
The strategic rivalry between Church & Dwight Co., Inc. and Coty Inc. shapes the competitive landscape of the household and personal products sector. Church & Dwight operates as a diversified manufacturer with strong specialty product lines, while Coty focuses on global beauty product distribution across prestige and mass-market segments. This analysis explores their contrasting operational models and aims to identify which company offers a superior risk-adjusted return for a diversified portfolio in 2026.
Table of contents
Companies Overview
This rivalry pits two key players in the Household & Personal Products sector against each other, shaping consumer trends.
Church & Dwight Co., Inc.: Diverse Household Products Leader
Church & Dwight commands a solid market position by developing and marketing household and specialty products. Its revenue derives from diverse segments including Consumer Domestic, International, and Specialty Products. In 2026, the company strategically focuses on expanding its ARM & HAMMER brand portfolio and strengthening e-commerce channels to capture broader consumer bases.
Coty Inc.: Global Beauty and Fragrance Powerhouse
Coty Inc. thrives as a global manufacturer and marketer of prestige and mass beauty products, from fragrances to skin care. Its revenue engine depends on a broad brand portfolio sold through prestige retailers and mass-market outlets worldwide. The company’s 2026 strategy centers on leveraging its luxury brands and enhancing direct-to-consumer digital platforms to boost market penetration.
Strategic Collision: Similarities & Divergences
Both firms prioritize brand diversification but differ in approach, with Church & Dwight emphasizing product breadth across household essentials, while Coty invests heavily in prestige beauty and fragrance. Their primary battleground lies in expanding consumer reach via e-commerce and retail partnerships. Church & Dwight offers stability through staple goods, whereas Coty’s growth hinges on luxury market dynamics, shaping distinct risk and return profiles.
Income Statement Comparison
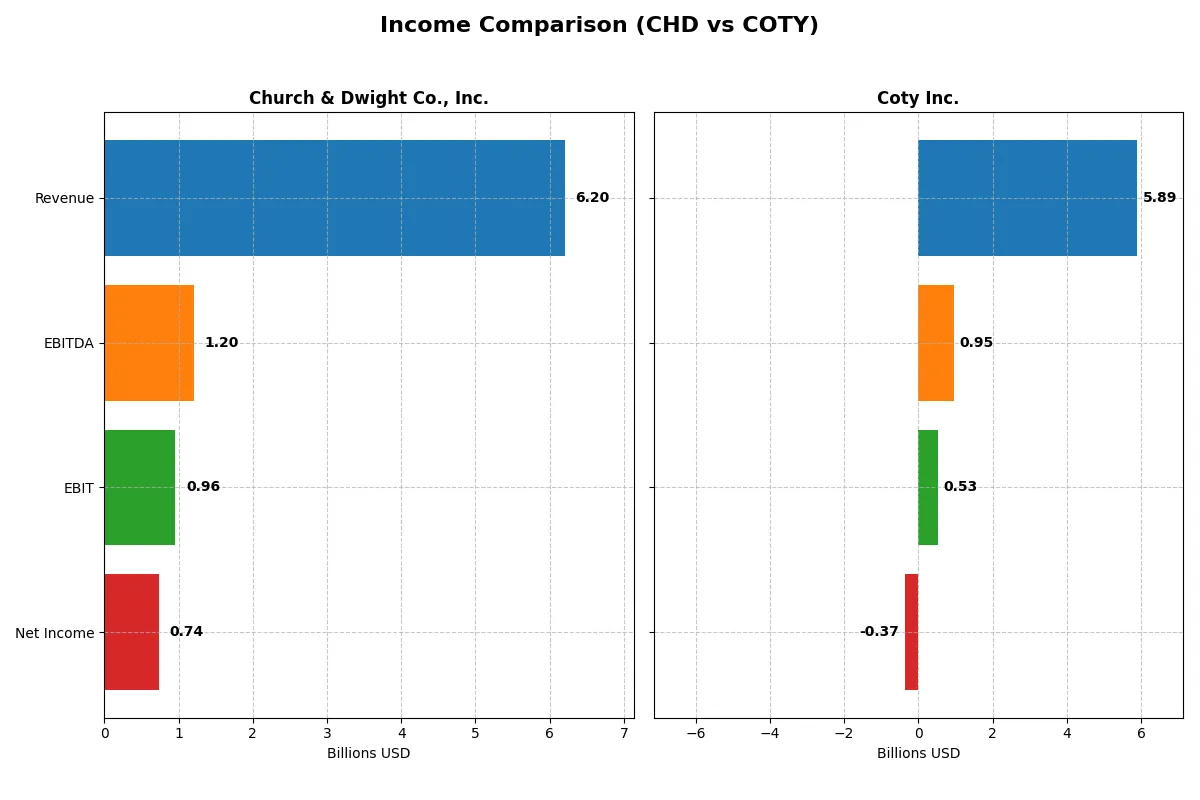
The following data dissects the core profitability and scalability of both corporate engines to reveal who dominates the bottom line:
| Metric | Church & Dwight Co., Inc. (CHD) | Coty Inc. (COTY) |
|---|---|---|
| Revenue | 6.20B | 5.89B |
| Cost of Revenue | 3.43B | 2.07B |
| Operating Expenses | 1.70B | 3.58B |
| Gross Profit | 2.77B | 3.82B |
| EBITDA | 1.20B | 950M |
| EBIT | 957M | 530M |
| Interest Expense | 0 | 227M |
| Net Income | 737M | -381M |
| EPS | 3.04 | -0.44 |
| Fiscal Year | 2025 | 2025 |
Income Statement Analysis: The Bottom-Line Duel
This income statement comparison reveals which company operates with superior efficiency and profit-generation in volatile market conditions.
Church & Dwight Co., Inc. Analysis
Church & Dwight’s revenue grew steadily to 6.2B in 2025, with net income at 737M, showing solid profitability. The gross margin remained favorable at 44.7%, while net margin improved to nearly 12%. Their EBIT margin of 15.4% highlights operational strength and efficient cost management, despite a slight dip in gross profit growth last year.
Coty Inc. Analysis
Coty’s revenue declined 3.7% to 5.9B in fiscal 2025, with a net loss of 368M signaling operational challenges. Gross margins are robust at 64.8%, but net margins turned negative at -6.2%, reflecting heavy burdens from interest and other expenses. EBIT margin dropped to 9%, and the company struggled with deteriorating profitability and negative earnings momentum.
Verdict: Margin Stability vs. Profitability Challenges
Church & Dwight outperforms Coty fundamentally, boasting stable revenue growth, healthier EBIT and net margins, and positive net income. Coty’s impressive gross margin is overshadowed by consistent losses and weakening bottom-line metrics. For investors, Church & Dwight’s profile demonstrates resilience and efficient capital allocation, making it a more appealing choice in terms of profitability and operational discipline.
Financial Ratios Comparison
These vital ratios act as a diagnostic tool to expose the underlying fiscal health, valuation premiums, and capital efficiency of the companies analyzed:
| Ratios | Church & Dwight Co., Inc. (CHD) | Coty Inc. (COTY) |
|---|---|---|
| ROE | 18.41% | -9.98% |
| ROIC | 11.19% | 2.55% |
| P/E | 27.62 | -11.02 |
| P/B | 5.08 | 1.10 |
| Current Ratio | 1.07 | 0.77 |
| Quick Ratio | 0.71 | 0.46 |
| D/E | 0.55 | 1.15 |
| Debt-to-Assets | 24.7% | 35.7% |
| Interest Coverage | N/A | 1.06 |
| Asset Turnover | 0.70 | 0.49 |
| Fixed Asset Turnover | 7.54 | 6.04 |
| Payout Ratio | 39.0% | -3.6% |
| Dividend Yield | 1.41% | 0.33% |
| Fiscal Year | 2025 | 2025 |
Efficiency & Valuation Duel: The Vital Signs
Ratios serve as a company’s DNA, unveiling hidden risks and operational strengths that numbers alone cannot express.
Church & Dwight Co., Inc.
Church & Dwight displays solid profitability with an 18.41% ROE and an 11.88% net margin, signaling operational efficiency. However, its P/E of 27.62 suggests a stretched valuation compared to market averages. The 1.41% dividend yield indicates moderate shareholder returns, balancing income with reinvestment in growth and capital projects.
Coty Inc.
Coty struggles with negative profitability metrics, including a -9.98% ROE and a -6.24% net margin, reflecting operational challenges. Its P/E is negative but the low P/B ratio of 1.1 points to an inexpensive valuation. Coty offers minimal dividends at 0.33%, focusing on restructuring and cash flow improvement to restore profitability.
Valuation Stretch vs. Profitability Struggles
Church & Dwight combines strong profitability with a premium valuation, while Coty trades cheaply but suffers weak fundamentals. Investors seeking operational safety might prefer Church & Dwight. Those favoring value turnaround potential could consider Coty’s riskier profile.
Which one offers the Superior Shareholder Reward?
Church & Dwight (CHD) offers a more attractive shareholder reward than Coty (COTY) in 2026. CHD maintains a 1.41% dividend yield with a sustainable 39% payout ratio, backed by strong free cash flow coverage (FCF/OpCF ~90%). Its disciplined buyback program complements dividends, enhancing total return. Conversely, COTY’s yield is minimal at 0.33%, with a negative net margin and weaker cash flow, signaling less reliable distributions. COTY relies heavily on reinvestment amid elevated leverage and low operating cash flow, increasing risk. I see CHD’s balanced dividend and buyback strategy as superior for long-term value creation.
Comparative Score Analysis: The Strategic Profile
The radar chart reveals the fundamental DNA and trade-offs of Church & Dwight and Coty Inc., outlining their financial strengths and valuation profiles:
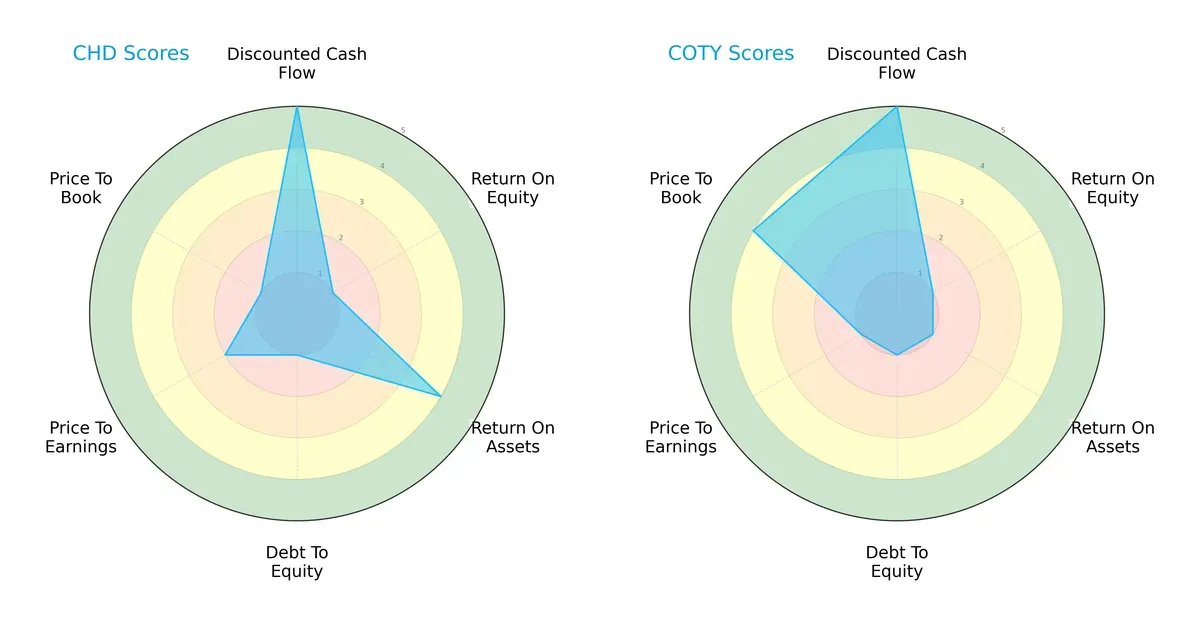
Church & Dwight shows a more balanced profile with a very favorable DCF score (5) and a favorable ROA (4), despite weak ROE (1) and high debt risk (debt/equity score 1). Coty matches the DCF score (5) but suffers from very unfavorable ROA (1), debt (1), and P/E scores (1), relying heavily on a favorable P/B score (4). Church & Dwight’s diversified strengths contrast Coty’s dependence on valuation metrics, signaling greater operational stability for CHD.
Bankruptcy Risk: Solvency Showdown
Church & Dwight’s Altman Z-Score of 3.93 places it firmly in the safe zone, while Coty’s near-zero score signals distress risk, highlighting stark solvency differences:
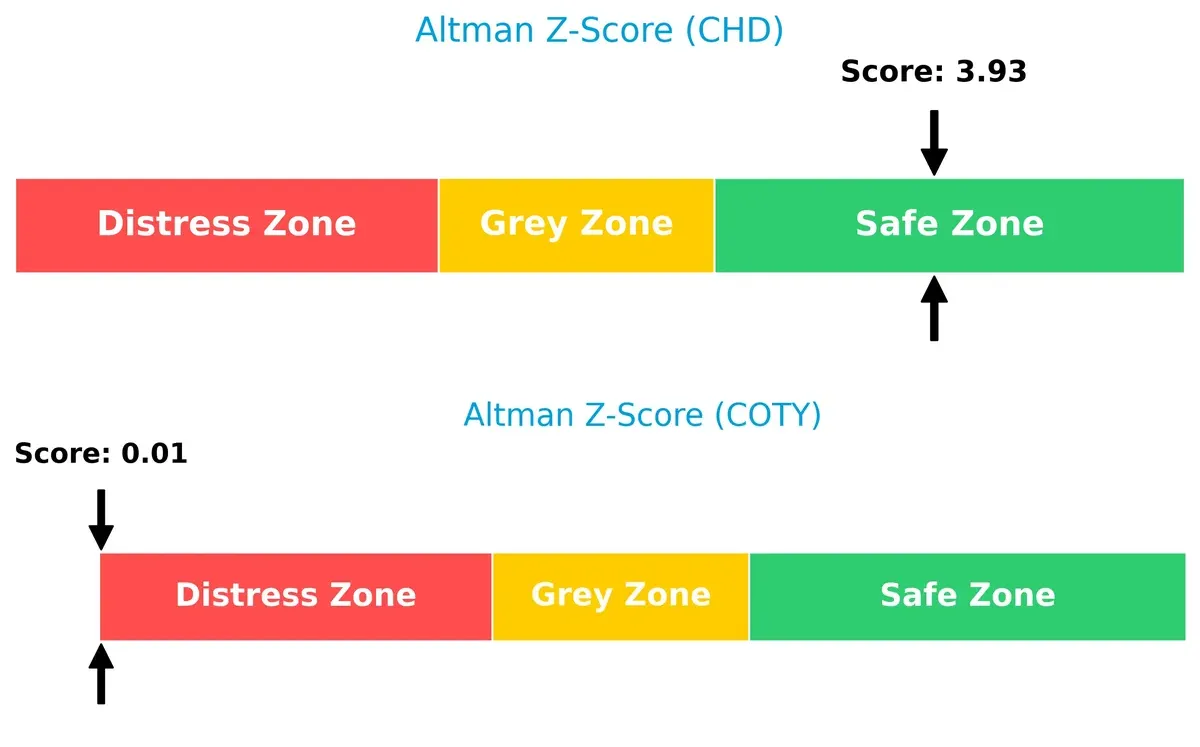
Church & Dwight stands as a low bankruptcy risk in the current cycle, supported by financial resilience. Coty faces significant solvency challenges, increasing its risk of financial distress if market conditions worsen.
Financial Health: Quality of Operations
Both companies register average Piotroski scores, but Church & Dwight’s 6 surpasses Coty’s 4, indicating stronger internal financial health and fewer red flags:
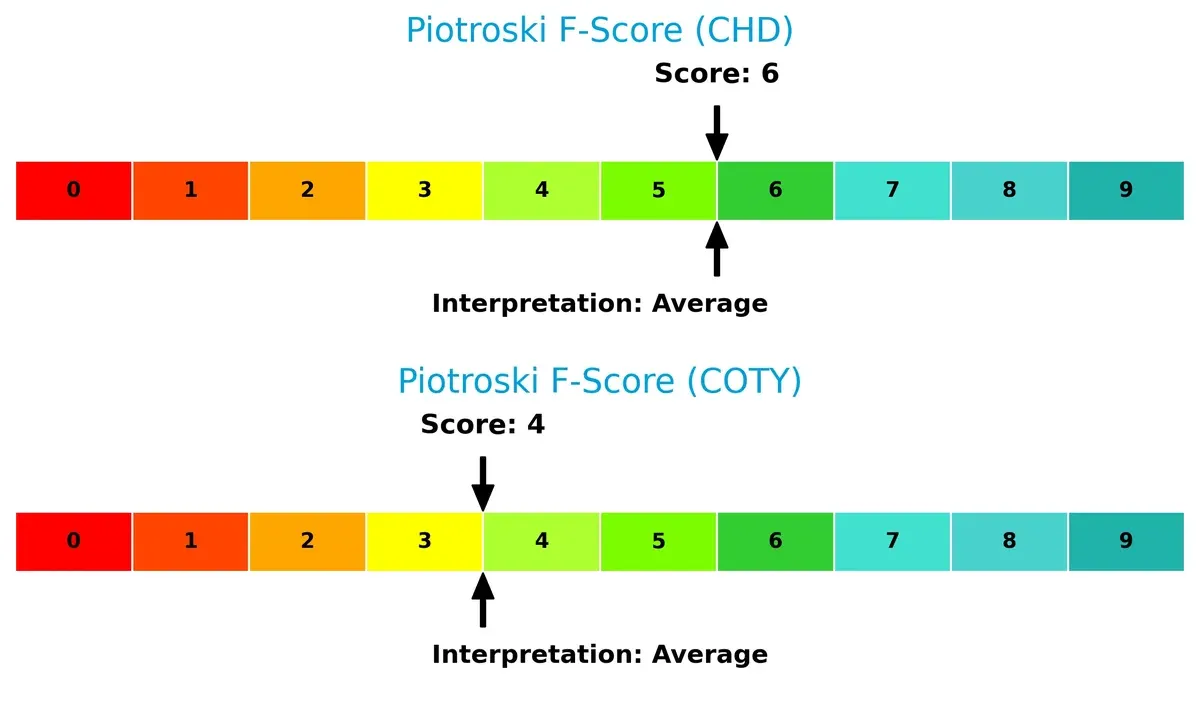
Church & Dwight’s higher Piotroski score reflects better profitability, liquidity, and efficiency metrics. Coty’s lower score warns of operational weaknesses, suggesting caution for investors prioritizing financial quality.
How are the two companies positioned?
This section dissects the operational DNA of CHD and COTY by comparing revenue distribution and internal dynamics. The goal is to confront their economic moats to reveal which model delivers the most durable competitive edge today.
Revenue Segmentation: The Strategic Mix
The following visual comparison dissects how Church & Dwight and Coty diversify their income streams and where their primary sector bets lie:
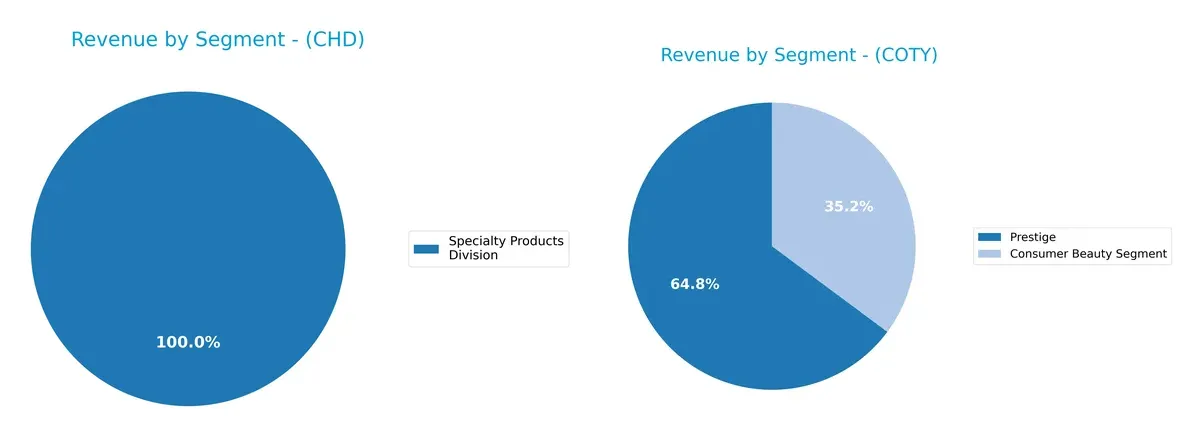
Church & Dwight relies exclusively on its Specialty Products Division, generating around $300M annually, reflecting a concentrated but stable niche focus. Coty, by contrast, dwarfs CHD’s scale with a diversified portfolio including Consumer Beauty ($2.07B) and Prestige ($3.82B) segments. Coty’s broad mix anchors its market position, reducing concentration risk, while CHD’s single-segment dependence heightens vulnerability but may simplify execution and brand focus.
Strengths and Weaknesses Comparison
This table compares the Strengths and Weaknesses of Church & Dwight Co., Inc. (CHD) and Coty Inc. (COTY):
CHD Strengths
- Favorable profitability ratios with 11.88% net margin and 18.41% ROE
- Favorable ROIC at 11.19% well above WACC
- Strong interest coverage ratio
- Diverse revenue from domestic and international markets
- Consistent Specialty Products Division sales near 300M USD
COTY Strengths
- Favorable WACC at 5.61% with low valuation multiples
- Large global presence including Americas, EMEA, Asia Pacific
- Multiple high-revenue segments: Consumer Beauty, Prestige
- Favorable fixed asset turnover ratio
CHD Weaknesses
- Unfavorable P/E and P/B ratios suggest overvaluation
- Quick ratio below 1 indicates liquidity concerns
- Neutral debt-to-equity ratio at 0.55 but watch leverage
- Asset turnover neutral at 0.7 limits operational efficiency
- Dividend yield modest at 1.41%
COTY Weaknesses
- Negative profitability with -6.24% net margin and -9.98% ROE
- Poor liquidity ratios, current and quick below 1
- High debt-to-equity ratio at 1.15 signals leverage risk
- Low interest coverage ratio at 2.33 raises solvency concerns
- Declining dividend yield and unfavorable asset turnover
Overall, CHD demonstrates solid profitability and financial stability but faces valuation and liquidity challenges. COTY’s broader global footprint and segment diversity do not offset its weak profitability and solvency metrics, indicating significant operational and financial risks.
The Moat Duel: Analyzing Competitive Defensibility
A structural moat alone shields long-term profits from relentless competition erosion. Let’s dissect the core moats of Church & Dwight and Coty Inc.:
Church & Dwight Co., Inc.: Durable Brand and Product Diversification
Church & Dwight’s moat stems from strong intangible assets and trusted brands like ARM & HAMMER. This delivers stable 15.4% EBIT margins and 11.9% net margins. However, its ROIC is declining, signaling margin pressure. New product lines and international expansion could reinforce this moat in 2026.
Coty Inc.: Brand Portfolio with Growth Potential but Profitability Challenges
Coty relies on a broad prestige and mass-market brand portfolio, driving a high gross margin near 65%. Its moat contrasts with Church & Dwight’s by depending more on brand licensing and fashion-linked appeal. Despite improving ROIC trends, negative net margins and shrinking EBIT indicate profitability risks. Expansion in emerging markets could unlock future value.
Brand Equity vs. Profitability Resilience
Church & Dwight holds a slightly favorable moat with positive value creation despite a declining ROIC trend. Coty’s moat is slightly unfavorable, shedding value but showing improving profitability. I believe Church & Dwight’s deeper moat better defends market share amid competitive pressures.
Which stock offers better returns?
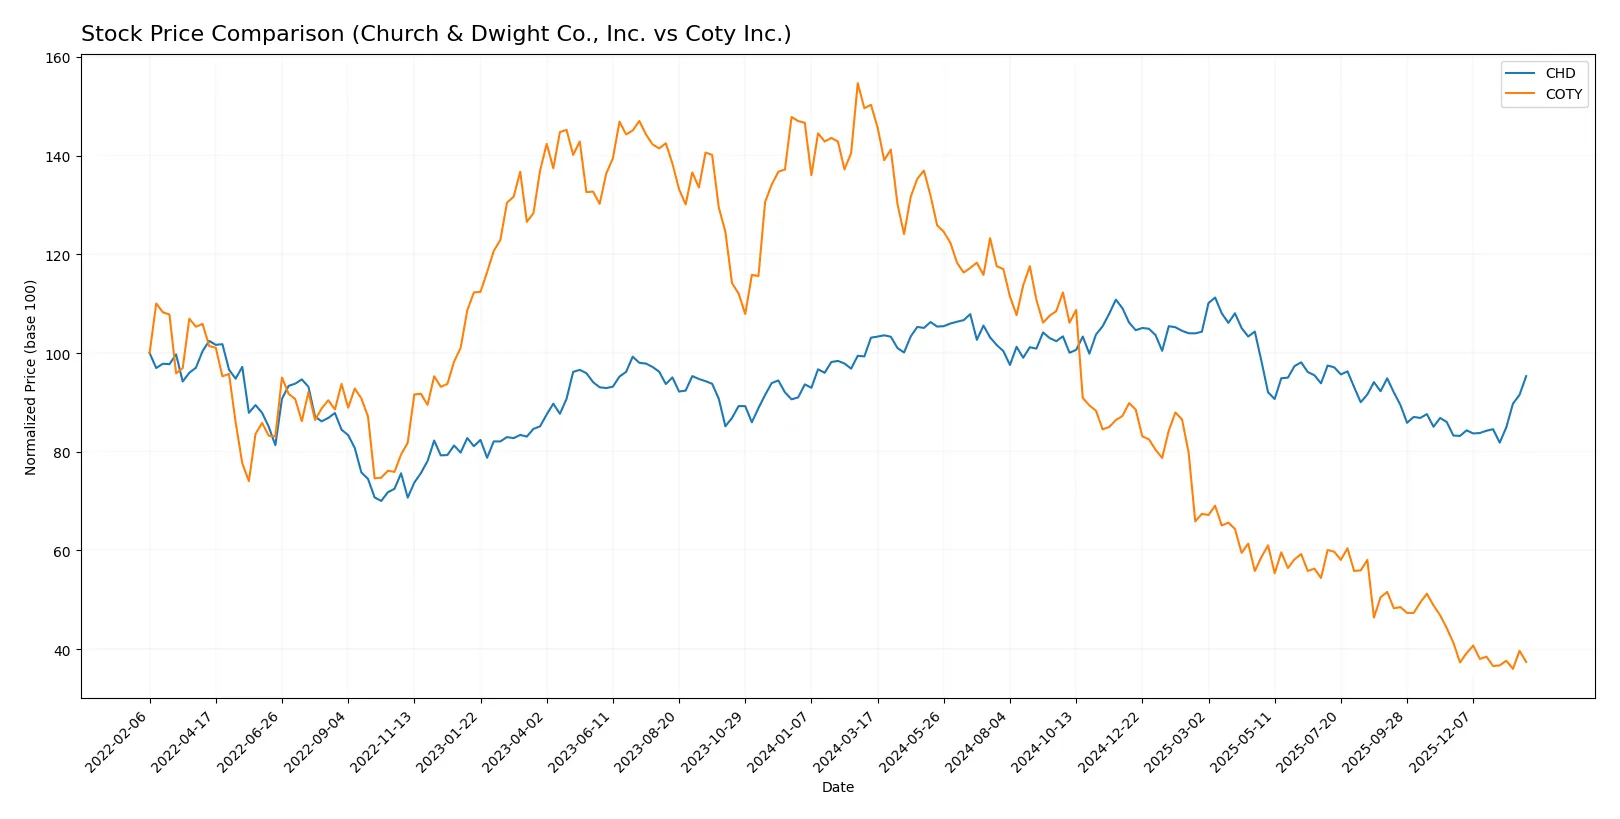
Over the past year, both stocks experienced bearish trends, with Church & Dwight showing recent bullish momentum and Coty continuing to decline amid accelerating downward pressure.
Trend Comparison
Church & Dwight’s stock fell 7.56% over the past 12 months, marking a bearish trend with accelerating decline. Recently, it reversed course, gaining 14.45% over 2.5 months with strong buyer dominance.
Coty’s stock dropped sharply by 75.1% over the last year, confirming a severe bearish trend with accelerating losses. Its recent 9.43% decline shows continued weakness and neutral buyer behavior.
Comparing trends, Church & Dwight delivered stronger market performance with a smaller overall loss and recent price recovery, outperforming Coty’s steep and persistent decline.
Target Prices
Analysts present a mixed outlook for Church & Dwight Co., Inc. and Coty Inc. based on current consensus targets.
| Company | Target Low | Target High | Consensus |
|---|---|---|---|
| Church & Dwight Co., Inc. | 82 | 102 | 96.25 |
| Coty Inc. | 3 | 10 | 4.83 |
Church & Dwight’s target consensus aligns exactly with its current price of 96.25, suggesting a balanced risk-reward profile. Coty’s consensus target of 4.83 significantly exceeds its current price of 3.17, indicating potential upside but accompanied by higher volatility and risk.

Don’t Let Luck Decide Your Entry Point
Optimize your entry points with our advanced ProRealTime indicators. You’ll get efficient buy signals with precise price targets for maximum performance. Start outperforming now!
How do institutions grade them?
Here is a summary of the latest institutional grades for Church & Dwight Co., Inc. and Coty Inc.:
Church & Dwight Co., Inc. Grades
The table below shows recent grades from major institutions for Church & Dwight Co., Inc.:
| Grading Company | Action | New Grade | Date |
|---|---|---|---|
| Jefferies | Maintain | Buy | 2026-01-28 |
| UBS | Maintain | Neutral | 2026-01-14 |
| TD Cowen | Maintain | Hold | 2026-01-08 |
| Wells Fargo | Maintain | Overweight | 2026-01-05 |
| Raymond James | Upgrade | Outperform | 2026-01-05 |
| Jefferies | Upgrade | Buy | 2025-12-17 |
| Citigroup | Upgrade | Neutral | 2025-12-17 |
| Deutsche Bank | Maintain | Buy | 2025-12-10 |
| Argus Research | Maintain | Buy | 2025-12-04 |
| Barclays | Maintain | Underweight | 2025-11-04 |
Coty Inc. Grades
The table below shows recent grades from major institutions for Coty Inc.:
| Grading Company | Action | New Grade | Date |
|---|---|---|---|
| TD Cowen | Maintain | Hold | 2026-01-21 |
| Evercore ISI Group | Downgrade | In Line | 2025-12-23 |
| Citigroup | Maintain | Neutral | 2025-12-17 |
| TD Cowen | Maintain | Hold | 2025-12-12 |
| Berenberg | Downgrade | Hold | 2025-09-10 |
| Morgan Stanley | Maintain | Equal Weight | 2025-08-25 |
| RBC Capital | Maintain | Outperform | 2025-08-22 |
| Wells Fargo | Maintain | Equal Weight | 2025-08-22 |
| Barclays | Maintain | Underweight | 2025-08-22 |
| B of A Securities | Maintain | Underperform | 2025-08-22 |
Which company has the best grades?
Church & Dwight Co., Inc. consistently receives stronger grades, including multiple Buy and Outperform ratings. Coty Inc. has more Hold and Neutral grades, with some downgrades. Investors might view Church & Dwight as more favorably positioned by analysts.
Risks specific to each company
The following categories identify the critical pressure points and systemic threats facing both firms in the 2026 market environment:
1. Market & Competition
Church & Dwight Co., Inc.
- Well-diversified product portfolio shields against market shifts. Strong brands maintain competitive edge in household products.
Coty Inc.
- Faces intense competition in beauty and cosmetics. Struggles with profitability and market share erosion.
2. Capital Structure & Debt
Church & Dwight Co., Inc.
- Moderate leverage with debt-to-assets at 24.7%. Interest coverage is infinite, indicating strong debt servicing ability.
Coty Inc.
- High leverage with debt-to-equity at 1.15 and modest interest coverage at 2.33, posing financial risk.
3. Stock Volatility
Church & Dwight Co., Inc.
- Low beta of 0.46 indicates less sensitivity to market swings, appealing to risk-averse investors.
Coty Inc.
- Beta near 0.96 implies market-level volatility, increasing investment risk in uncertain cycles.
4. Regulatory & Legal
Church & Dwight Co., Inc.
- Operates primarily in US with stable regulatory environment. No significant legal issues reported.
Coty Inc.
- Global footprint exposes Coty to complex regulatory frameworks, increasing compliance costs and risks.
5. Supply Chain & Operations
Church & Dwight Co., Inc.
- Efficient asset turnover at 0.7 and fixed asset turnover at 7.54 supports operational resilience.
Coty Inc.
- Lower asset turnover of 0.49 signals less efficient use of assets, potentially vulnerable to supply chain disruptions.
6. ESG & Climate Transition
Church & Dwight Co., Inc.
- Established sustainability programs aligned with consumer defensive sector trends.
Coty Inc.
- Faces pressure to enhance ESG credentials amid evolving beauty industry standards.
7. Geopolitical Exposure
Church & Dwight Co., Inc.
- Domestic focus limits exposure to geopolitical volatility.
Coty Inc.
- Extensive international sales increase risk from trade tensions and currency fluctuations.
Which company shows a better risk-adjusted profile?
Church & Dwight’s strongest risk lies in valuation metrics, with a high P/E and P/B ratio suggesting potential overvaluation. Coty’s greatest risk is its capital structure and ongoing negative profitability, deepening financial distress. Overall, Church & Dwight offers a superior risk-adjusted profile, supported by a safe Altman Z-score of 3.93 versus Coty’s distress zone score near zero. Recent financials confirm Coty’s continuing operational challenges, justifying caution despite its favorable discounted cash flow score.
Final Verdict: Which stock to choose?
Church & Dwight’s superpower lies in its consistent value creation through efficient capital use and solid profitability. Its declining ROIC trend is a point of vigilance, suggesting potential pressure on future margins. This stock suits investors targeting steady income with moderate growth in a balanced or dividend-focused portfolio.
Coty’s strategic moat is its potential for operational turnaround supported by improving ROIC. Its valuation metrics imply deep discounting relative to Church & Dwight, but heightened financial risk remains a concern. Coty fits investors with higher risk tolerance who seek turnaround opportunities or contrarian plays in consumer staples.
If you prioritize stable value creation and income, Church & Dwight outshines with its reliable cash flow and profitability despite some margin pressure. However, if you seek growth from an undervalued asset with turnaround potential, Coty offers better upside but commands a premium in risk. Each scenario depends heavily on your risk appetite and portfolio goals.
Disclaimer: Investment carries a risk of loss of initial capital. The past performance is not a reliable indicator of future results. Be sure to understand risks before making an investment decision.
Go Further
I encourage you to read the complete analyses of Church & Dwight Co., Inc. and Coty Inc. to enhance your investment decisions: