Home > Comparison > Financial Services > CB vs WRB
The strategic rivalry between Chubb Limited and W. R. Berkley Corporation shapes the competitive landscape of the global Property & Casualty insurance industry. Chubb operates as a diversified, global insurance powerhouse with broad product lines, while Berkley focuses on niche commercial lines with a leaner operational model. This head-to-head pits scale against specialization, growth against focused underwriting discipline. This analysis aims to identify which business model delivers superior risk-adjusted returns for a balanced portfolio.

Table of contents
Companies Overview
Chubb Limited and W. R. Berkley Corporation stand as major contenders in the global Property & Casualty insurance market.
Chubb Limited: Global Insurance Powerhouse
Chubb Limited dominates the global P&C insurance sector, generating revenue through diverse commercial and personal insurance products. Its core strength lies in underwriting specialty risks like cyber, marine, and construction insurance. In 2026, Chubb focuses strategically on expanding its reinsurance portfolio and enhancing risk management capabilities to sustain its competitive edge.
W. R. Berkley Corporation: Focused Commercial Insurer
W. R. Berkley Corporation is a leading U.S.-based commercial lines insurer specializing in underwriting property, casualty, and specialty risks. Its revenue engine hinges on tailored insurance solutions for small to medium-sized businesses. The company’s 2026 strategy emphasizes portfolio diversification and growth in alternative risk and cyber insurance markets.
Strategic Collision: Similarities & Divergences
Both firms pursue commercial and specialty insurance, but Chubb operates a broader global footprint while Berkley targets niche U.S. markets. They compete intensely in specialty risk underwriting and cyber coverage. Chubb’s scale and reinsurance focus contrast with Berkley’s agile, targeted approach, creating distinct risk-return profiles attractive to different investor appetites.
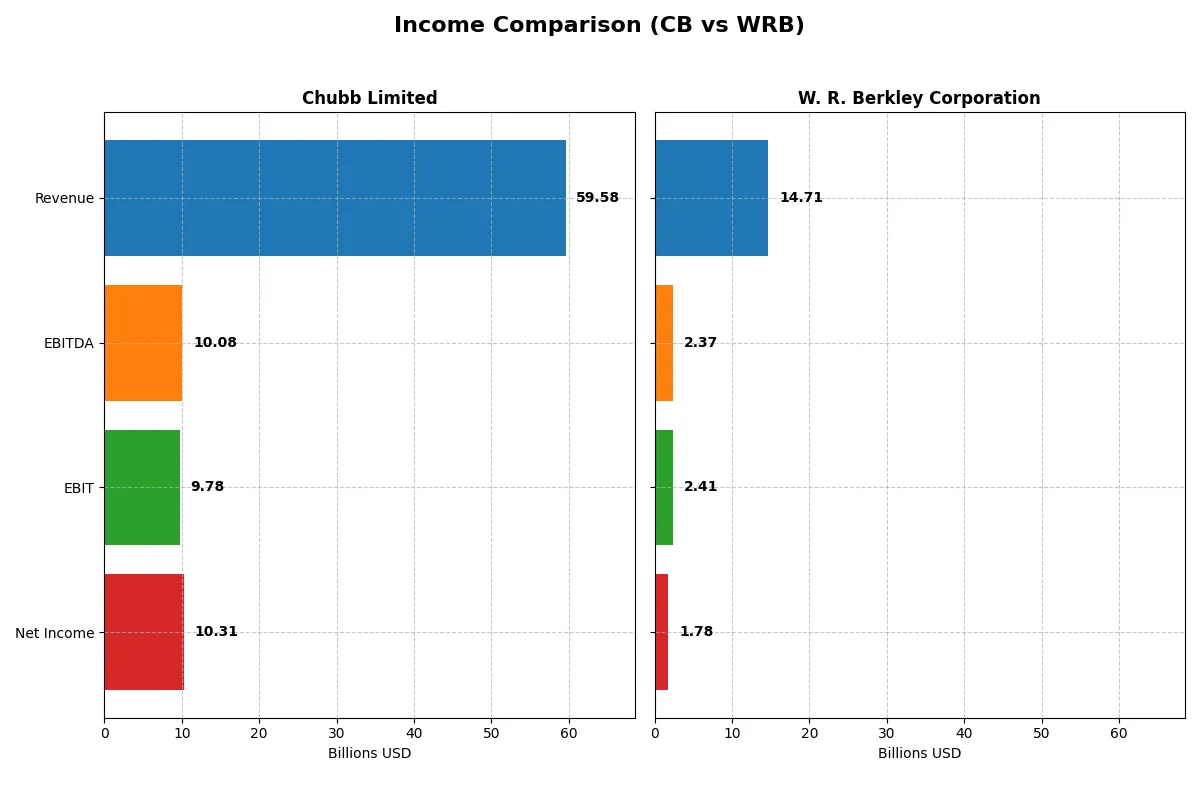
Income Statement Comparison
This data dissects the core profitability and scalability of both corporate engines to reveal who dominates the bottom line:
| Metric | Chubb Limited (CB) | W. R. Berkley Corporation (WRB) |
|---|---|---|
| Revenue | 59.6B | 14.7B |
| Cost of Revenue | 32.0B | 11.8B |
| Operating Expenses | 4.4B | 579M |
| Gross Profit | 27.5B | 2.9B |
| EBITDA | 10.1B | 2.4B |
| EBIT | 9.8B | 2.4B |
| Interest Expense | 764M | 127M |
| Net Income | 10.3B | 1.3B |
| EPS | 25.91 | 4.48 |
| Fiscal Year | 2025 | 2025 |
Income Statement Analysis: The Bottom-Line Duel
This income statement comparison reveals the true operational efficiency and profitability of two major insurance players over recent years.
Chubb Limited Analysis
Chubb recorded steady revenue growth from $40.8B in 2021 to $59.6B in 2025, with net income rising from $8.5B to $10.3B. Its gross margin improved markedly to 46.2% in 2025, signaling strong cost control. Despite a 19.8% dip in EBIT last year, net margin held steady at 17.3%, reflecting resilient bottom-line efficiency.
W. R. Berkley Corporation Analysis
W. R. Berkley expanded revenue from $9.5B in 2021 to $14.7B in 2025, alongside net income growth from $1.0B to $1.33B. Gross margin remained modest at 19.8%, but EBIT margin stayed competitive at 16.4%. The firm showed solid earnings per share growth of 82.4% over five years despite a slight recent decline in gross profit.
Margin Power vs. Revenue Scale
Chubb’s superior gross margin and larger scale translate into a higher absolute net income and EPS, despite some volatility in EBIT growth. W. R. Berkley delivers impressive long-term EPS growth but on a smaller revenue base and thinner margins. For investors, Chubb’s robust margin profile offers more reliable earnings power, while W. R. Berkley’s profile suits those seeking growth from a leaner operation.
Financial Ratios Comparison
These vital ratios act as a diagnostic tool to expose the underlying fiscal health, valuation premiums, and capital efficiency of the companies compared below:
| Ratios | Chubb Limited (CB) | W. R. Berkley Corporation (WRB) |
|---|---|---|
| ROE | 14.0% | 20.9% |
| ROIC | 71.4% | — |
| P/E | 12.0x | 15.6x |
| P/B | 1.68x | 2.79x |
| Current Ratio | — | — |
| Quick Ratio | — | — |
| D/E | — | — |
| Debt-to-Assets | 6.2% | 7.0% |
| Interest Coverage | 30.3x | 18.4x |
| Asset Turnover | 0.22 | 0.34 |
| Fixed Asset Turnover | — | 28.5 |
| Payout ratio | 14.7% | 41.2% |
| Dividend yield | 1.22% | 2.64% |
| Fiscal Year | 2025 | 2025 |
Efficiency & Valuation Duel: The Vital Signs
Financial ratios serve as a company’s DNA, exposing hidden risks and operational strengths critical for informed investment decisions.
Chubb Limited
Chubb Limited posts a solid 13.98% ROE with a favorable net margin of 17.3%, signaling efficient profitability. Its P/E of 12.0 suggests the stock trades at a reasonable valuation, supported by a neutral P/B of 1.68. The company returns value via a 1.22% dividend yield, balancing shareholder payouts with reinvestment in growth and operations.
W. R. Berkley Corporation
W. R. Berkley’s net margin at 12.1% is favorable, yet its ROE and ROIC are notably absent, indicating potential profitability concerns. The P/E ratio at 15.63 reflects a neutral valuation, while a strong 2.64% dividend yield signals a shareholder-friendly cash return. However, missing key returns metrics warrant caution on operational efficiency.
Balanced Profitability vs. Dividend Yield Focus
Chubb Limited offers a more balanced profile with strong profitability metrics and a reasonable valuation, while W. R. Berkley emphasizes dividend yield despite unclear efficiency ratios. Investors seeking operational strength may prefer Chubb, whereas those favoring income might lean toward Berkley’s dividend focus.
Which one offers the Superior Shareholder Reward?
I observe that Chubb Limited (CB) delivers a lower dividend yield around 1.2% with a conservative payout ratio near 15%, supported by robust free cash flow coverage. CB complements dividends with steady buybacks, reinforcing shareholder value sustainably. In contrast, W. R. Berkley Corporation (WRB) offers a higher yield near 2.6% but carries a more aggressive payout ratio exceeding 30%, which may pressure cash flow. WRB’s buyback intensity is less clear but likely modest given its payout. I favor CB’s balanced distribution approach, blending dividends and buybacks with strong cash flow, making it the superior total return choice for 2026 investors.
Comparative Score Analysis: The Strategic Profile
The radar chart reveals the fundamental DNA and trade-offs of Chubb Limited and W. R. Berkley Corporation side by side:
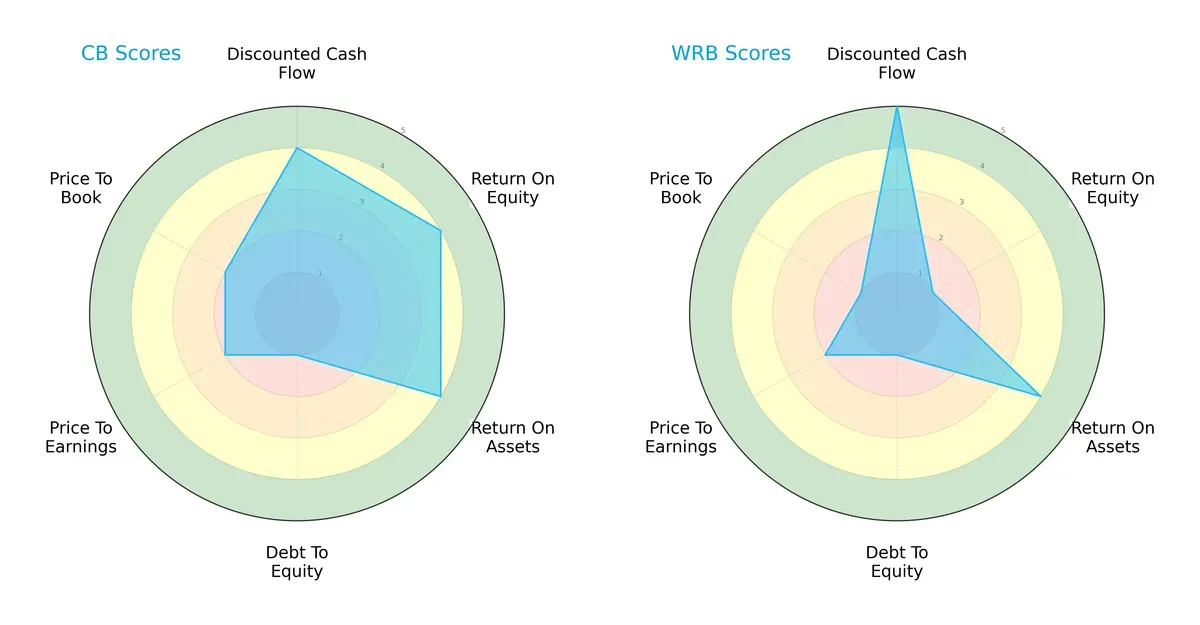
Chubb shows a balanced strength in ROE (4), ROA (4), and DCF (4), but a weak debt-to-equity score (1) drags its profile. W. R. Berkley excels in DCF (5), signaling strong cash flow projections, but suffers from very low ROE (1) and poor valuation metrics. Chubb’s profile is more balanced, while W. R. Berkley relies heavily on its cash flow advantage.
—
Bankruptcy Risk: Solvency Showdown
Chubb’s Altman Z-Score sits deep in the distress zone at 0.75, indicating a high bankruptcy risk in this cycle. W. R. Berkley’s Altman Z-Score is unavailable, leaving its solvency unclear:

—
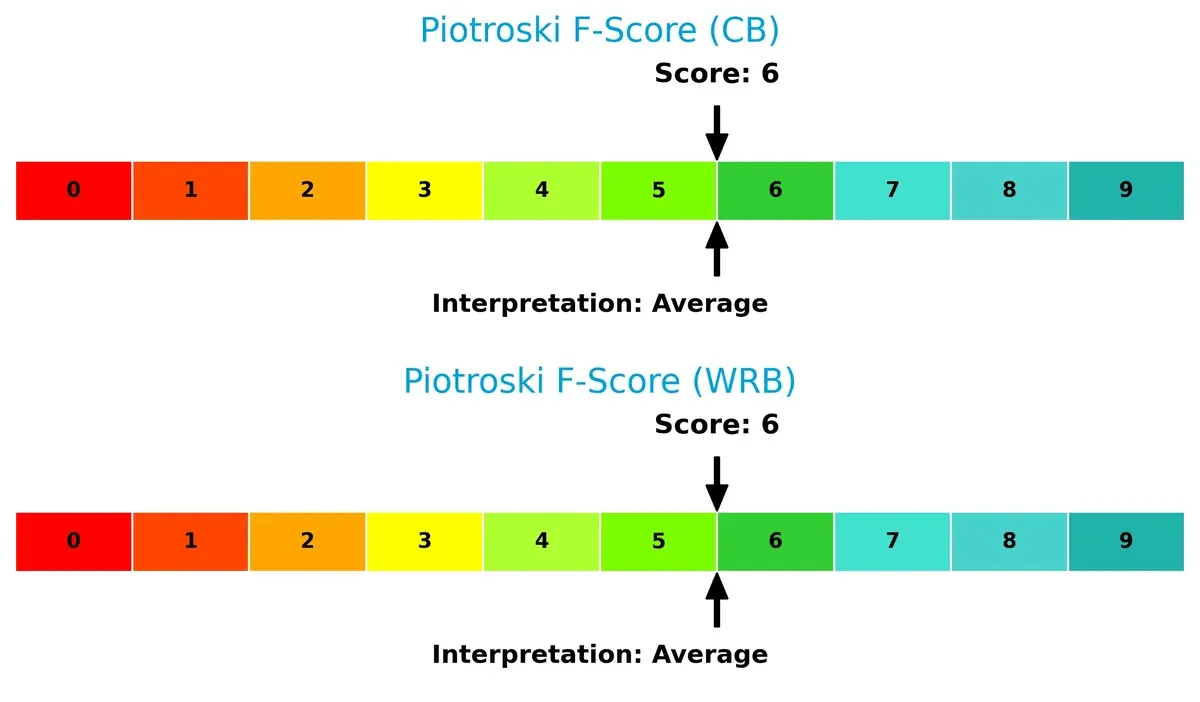
Financial Health: Quality of Operations
Both Chubb and W. R. Berkley score a 6 on the Piotroski F-Score, reflecting average financial health with no glaring red flags in operational quality:
How are the two companies positioned?
This section dissects the operational DNA of CB and WRB by comparing their revenue distribution by segment and analyzing their internal strengths and weaknesses. The final objective confronts their economic moats to identify which business model offers the most resilient and sustainable competitive advantage in today’s market.
Revenue Segmentation: The Strategic Mix
This visual comparison dissects how both firms diversify their income streams and where their primary sector bets lie:
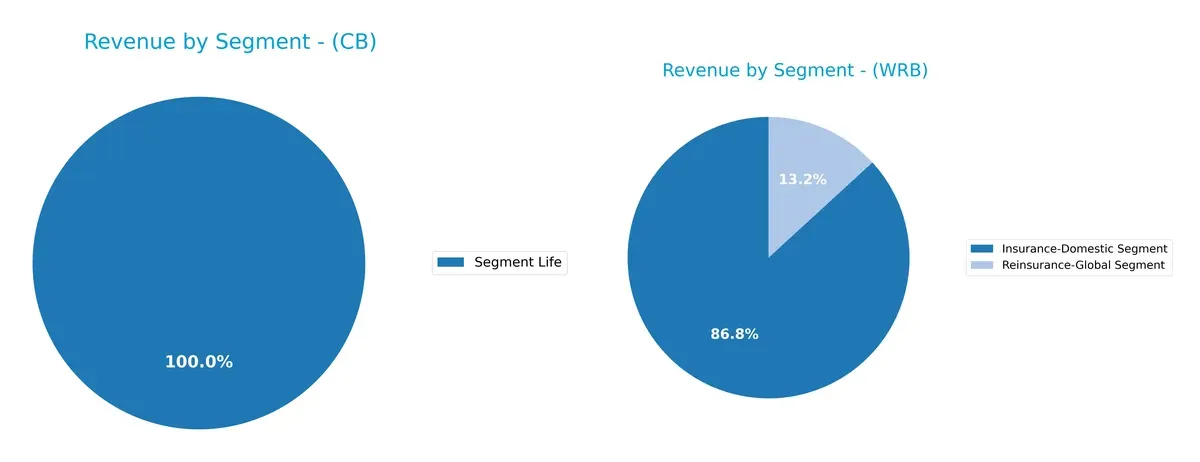
Chubb Limited anchors its revenue heavily in Segment Life with $6.75B (2024). W. R. Berkley Corporation displays a more diversified mix, with $11.18B from Insurance-Domestic and $1.70B from Reinsurance-Global segments in 2024. Chubb’s concentration signals dependence on life insurance stability, while Berkley’s spread reduces risk and leverages both domestic and global insurance markets. Berkley pivots on multi-segment resilience; Chubb faces concentration risk.
Strengths and Weaknesses Comparison
This table compares the strengths and weaknesses of Chubb Limited and W. R. Berkley Corporation:
Chubb Limited Strengths
- Strong profitability with 17.3% net margin
- Favorable ROIC at 71.36% exceeding WACC
- Diversified product lines including Property & Casualty and Life segments
- Solid interest coverage ratio of 12.8
W. R. Berkley Corporation Strengths
- Favorable net margin at 12.1%
- Strong interest coverage ratio of 18.95
- Favorable debt metrics with zero debt-to-assets
- Dividend yield of 2.64% signals shareholder returns
Chubb Limited Weaknesses
- Unfavorable liquidity ratios with zero current and quick ratios
- Low asset turnover at 0.22 signals inefficiency
- Neutral ROE at 13.98% may indicate moderate capital returns
W. R. Berkley Corporation Weaknesses
- Unfavorable ROE and ROIC at zero, raising profitability concerns
- Unavailable WACC metric limits cost of capital assessment
- Zero current and quick ratios indicate liquidity risk
- Low asset turnover signals operational inefficiency
Chubb Limited demonstrates robust profitability and capital efficiency but faces liquidity and asset usage challenges. W. R. Berkley shows solid debt management and shareholder returns but struggles with profitability ratios and liquidity metrics. Both companies must address operational weaknesses to strengthen their financial resilience.
The Moat Duel: Analyzing Competitive Defensibility
A structural moat is the only reliable shield protecting long-term profits from competitive erosion in fiercely contested industries:
Chubb Limited: Intangible Assets and Diversification Moat
Chubb leverages its strong brand and global diversification to maintain high ROIC near 65%, reflecting efficient capital use despite a declining trend. New specialty insurance products could deepen its moat in 2026.
W. R. Berkley Corporation: Niche Market Focus and Operational Efficiency
Berkley’s moat rests on specialized underwriting and disciplined expense management, delivering stable EBIT margins around 16%. Its narrower scale contrasts with Chubb but offers focused growth potential in specialty lines.
Diversification Dominance vs. Focused Specialization
Chubb’s wider moat arises from its global footprint and intangible assets, enabling broader risk distribution and premium pricing power. Berkley’s moat is narrower but stable. Chubb is better positioned to defend and expand market share amid evolving risks.
Which stock offers better returns?
The past year shows strong bullish momentum for both stocks, with Chubb Limited accelerating its gains, while W. R. Berkley Corporation’s growth decelerates amid recent selling pressure.
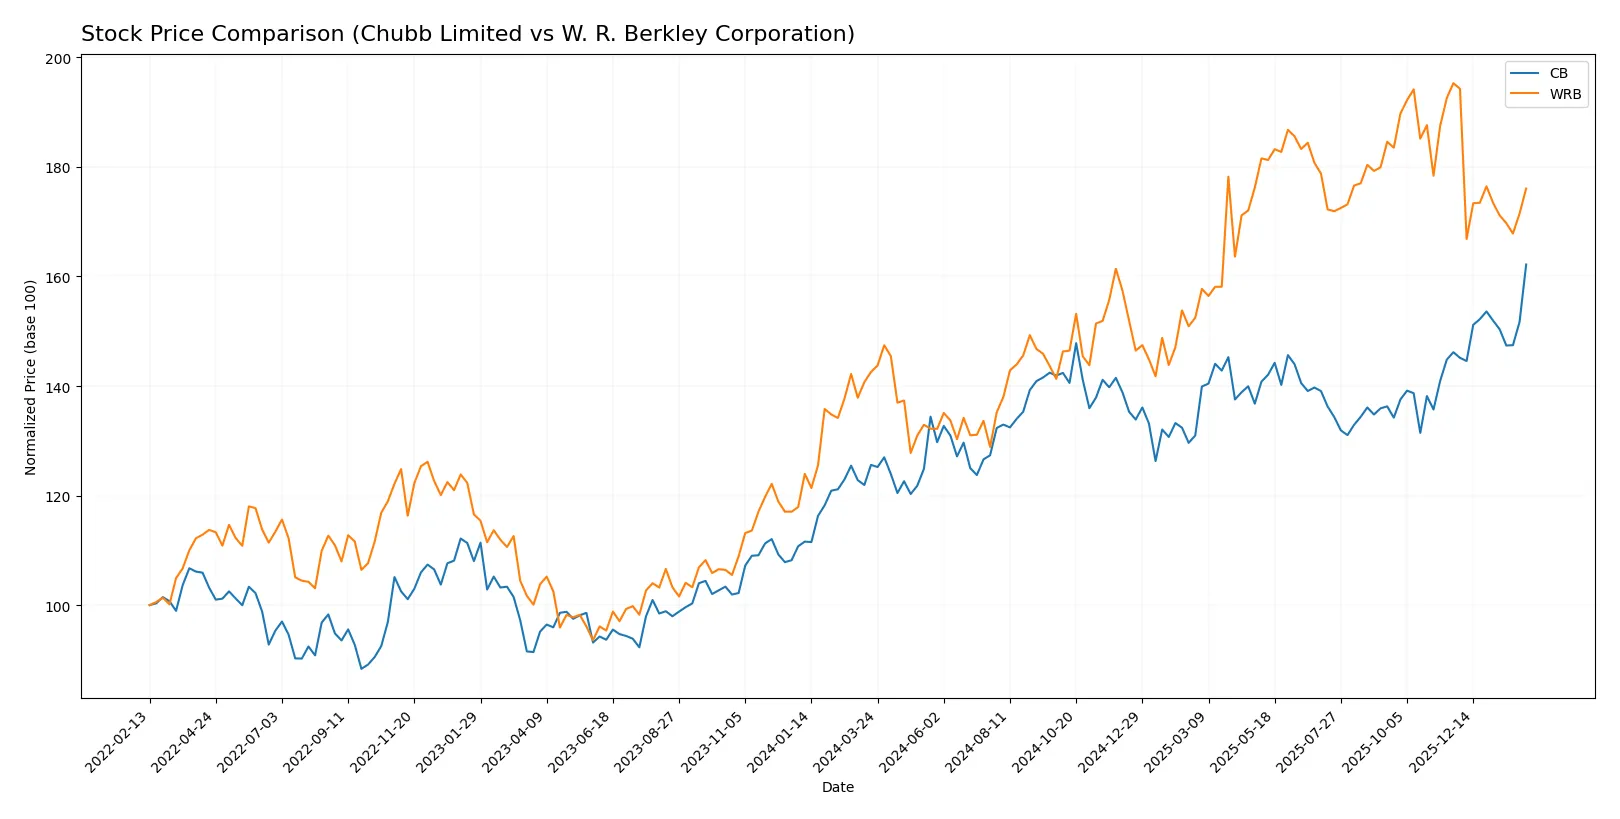
Trend Comparison
Chubb Limited’s stock rose 29.14% over the past 12 months, showing acceleration and a high volatility level with a standard deviation of 16.12. The price moved between 245.45 and 330.97.
W. R. Berkley Corporation gained 23.5% over the same period but exhibits deceleration in its overall trend. Its volatility is lower, with a standard deviation of 7.83, and prices ranged from 51.1 to 78.1.
Chubb Limited outperformed W. R. Berkley Corporation with a higher total return and accelerating price gains, whereas Berkley faced a recent downward trend with negative short-term returns.
Target Prices
Analysts present a clear target price consensus for Chubb Limited and W. R. Berkley Corporation.
| Company | Target Low | Target High | Consensus |
|---|---|---|---|
| Chubb Limited | 283 | 366 | 330.5 |
| W. R. Berkley Corporation | 64 | 80 | 71 |
The target consensus for Chubb Limited closely aligns with its current price of $330.97, suggesting limited near-term upside. W. R. Berkley’s consensus at $71 slightly exceeds its current price of $70.41, indicating moderate analyst optimism.

Don’t Let Luck Decide Your Entry Point
Optimize your entry points with our advanced ProRealTime indicators. You’ll get efficient buy signals with precise price targets for maximum performance. Start outperforming now!
How do institutions grade them?
Here is a summary of the latest institutional grades for Chubb Limited and W. R. Berkley Corporation:
Chubb Limited Grades
The table below shows recent grades assigned by reputable institutions for Chubb Limited.
| Grading Company | Action | New Grade | Date |
|---|---|---|---|
| Wells Fargo | Maintain | Equal Weight | 2026-02-05 |
| Evercore ISI Group | Maintain | Outperform | 2026-02-04 |
| JP Morgan | Maintain | Neutral | 2026-02-04 |
| Roth Capital | Maintain | Buy | 2026-02-04 |
| Citizens | Maintain | Market Outperform | 2026-02-04 |
| Citizens | Maintain | Market Outperform | 2026-01-16 |
| Cantor Fitzgerald | Maintain | Neutral | 2026-01-14 |
| Wells Fargo | Maintain | Equal Weight | 2026-01-13 |
| Barclays | Maintain | Equal Weight | 2026-01-08 |
| Goldman Sachs | Upgrade | Buy | 2026-01-08 |
W. R. Berkley Corporation Grades
Below is the latest grading data from recognized institutions for W. R. Berkley Corporation.
| Grading Company | Action | New Grade | Date |
|---|---|---|---|
| Argus Research | Maintain | Buy | 2026-02-02 |
| Cantor Fitzgerald | Maintain | Overweight | 2026-02-02 |
| Truist Securities | Maintain | Buy | 2026-01-28 |
| Wells Fargo | Maintain | Equal Weight | 2026-01-27 |
| Jefferies | Maintain | Hold | 2026-01-27 |
| Mizuho | Maintain | Neutral | 2026-01-27 |
| B of A Securities | Maintain | Neutral | 2026-01-27 |
| TD Cowen | Downgrade | Sell | 2026-01-20 |
| Cantor Fitzgerald | Maintain | Overweight | 2026-01-14 |
| Wells Fargo | Maintain | Equal Weight | 2026-01-13 |
Which company has the best grades?
Chubb Limited generally holds stronger grades with multiple “Buy,” “Outperform,” and “Market Outperform” ratings. W. R. Berkley Corporation has a mixed profile, including a recent downgrade to “Sell” from TD Cowen. Investors might view Chubb’s consensus as more favorable, suggesting greater confidence from analysts.
Risks specific to each company
The following categories identify the critical pressure points and systemic threats facing both firms in the 2026 market environment:
1. Market & Competition
Chubb Limited
- Operates globally with diverse P&C and life insurance lines, facing intense global competition and evolving customer needs.
W. R. Berkley Corporation
- Focuses on U.S. commercial lines with niche specialty coverages, competing in a fragmented market with specialized risks.
2. Capital Structure & Debt
Chubb Limited
- Exhibits favorable debt metrics and strong interest coverage; however, zero current and quick ratios raise liquidity concerns.
W. R. Berkley Corporation
- Maintains favorable debt levels and highest interest coverage among peers but also shows weak liquidity ratios, signaling operational risks.
3. Stock Volatility
Chubb Limited
- Beta of 0.49 indicates lower market volatility sensitivity, offering relative defensive qualities in turbulent markets.
W. R. Berkley Corporation
- Lower beta of 0.36 implies even less volatility, appealing to risk-averse investors despite lower market capitalization.
4. Regulatory & Legal
Chubb Limited
- Global operations expose it to complex regulations across multiple jurisdictions, increasing compliance costs and legal risks.
W. R. Berkley Corporation
- U.S.-centric focus simplifies regulatory exposure but still faces evolving insurance laws and potential litigation risks domestically.
5. Supply Chain & Operations
Chubb Limited
- Complex international operations require robust risk management; potential disruptions could impact underwriting efficiency.
W. R. Berkley Corporation
- Operational scale smaller but specialized underwriting demands precise risk assessment; operational disruptions could affect niche markets.
6. ESG & Climate Transition
Chubb Limited
- Faces higher ESG risks due to global footprint; must adapt underwriting and investment strategies to climate change pressures.
W. R. Berkley Corporation
- ESG risks moderate but climate-related claims in specialized lines could rise, necessitating strategic adaptation.
7. Geopolitical Exposure
Chubb Limited
- Broad international presence subjects it to geopolitical tensions, currency fluctuations, and trade risks.
W. R. Berkley Corporation
- Primarily U.S.-based, limiting geopolitical risks but vulnerable to domestic policy shifts and economic cycles.
Which company shows a better risk-adjusted profile?
Chubb’s largest risk is its liquidity profile, highlighted by unfavorable current and quick ratios amid a complex global footprint. W. R. Berkley’s critical risk lies in its weak return on equity and asset metrics, undermining profitability despite strong interest coverage. I find Chubb’s diversified global scale offers better risk-adjusted stability compared to Berkley’s concentrated but operationally constrained position. The notable low beta of both companies signals defensive stock behavior, yet Chubb’s broader market presence better cushions systemic shocks.
Final Verdict: Which stock to choose?
Chubb Limited excels as a cash-generating powerhouse with a strong economic moat, delivering solid returns on invested capital well above its cost. Its declining profitability trend is a point of vigilance. Chubb suits aggressive growth portfolios seeking durable value creation amid market cycles.
W. R. Berkley Corporation’s strategic moat lies in its resilient underwriting discipline and recurring revenue safety, offering better dividend yield and financial stability. Relative to Chubb, it presents a more conservative risk profile, fitting well in GARP portfolios balancing growth with reasonable valuation.
If you prioritize robust economic moats and capital efficiency, Chubb outshines as the compelling choice due to its superior ROIC and cash flow generation. However, if you seek income stability and a steadier risk-return profile, W. R. Berkley offers better defensive qualities despite recent deceleration in price momentum.
Disclaimer: Investment carries a risk of loss of initial capital. The past performance is not a reliable indicator of future results. Be sure to understand risks before making an investment decision.
Go Further
I encourage you to read the complete analyses of Chubb Limited and W. R. Berkley Corporation to enhance your investment decisions: