Home > Comparison > Financial Services > CB vs TRV
The strategic rivalry between Chubb Limited and The Travelers Companies, Inc. shapes the trajectory of the global property and casualty insurance sector. Chubb operates a diversified, global insurance and reinsurance platform, while Travelers focuses on a U.S.-centric, segmented model emphasizing commercial and personal lines. This head-to-head contrasts global scale with domestic specialization. This analysis aims to identify which corporate strategy offers superior risk-adjusted returns for a diversified investor portfolio.

Table of contents
Companies Overview
Chubb Limited and The Travelers Companies, Inc. both claim leadership in the global property and casualty insurance market.
Chubb Limited: Global Insurance Powerhouse
Chubb Limited dominates as a global insurer offering property, casualty, and specialty insurance worldwide. Its revenue stems from diverse segments including commercial and personal P&C insurance, agriculture, reinsurance, and life insurance. In 2026, Chubb sharpens its strategic focus on expanding specialty lines and enhancing risk management solutions to maintain its premium market position.
The Travelers Companies, Inc.: Diversified P&C Specialist
The Travelers Companies, Inc. excels as a U.S.-based insurer specializing in commercial and personal P&C insurance. Its revenue engine is built on three segments: business insurance, bond & specialty insurance, and personal insurance. In 2026, Travelers prioritizes strengthening its underwriting discipline and expanding specialty insurance offerings to capture niche markets and improve profitability.
Strategic Collision: Similarities & Divergences
Both firms emphasize diversified P&C insurance, yet Chubb pursues a broader global footprint, while Travelers focuses on U.S. markets with specialized segments. The key battleground lies in commercial specialty insurance where underwriting expertise drives market share. Their distinct investment profiles reflect Chubb’s global scale and diversification versus Travelers’ focus on disciplined underwriting and U.S. niche dominance.
Income Statement Comparison
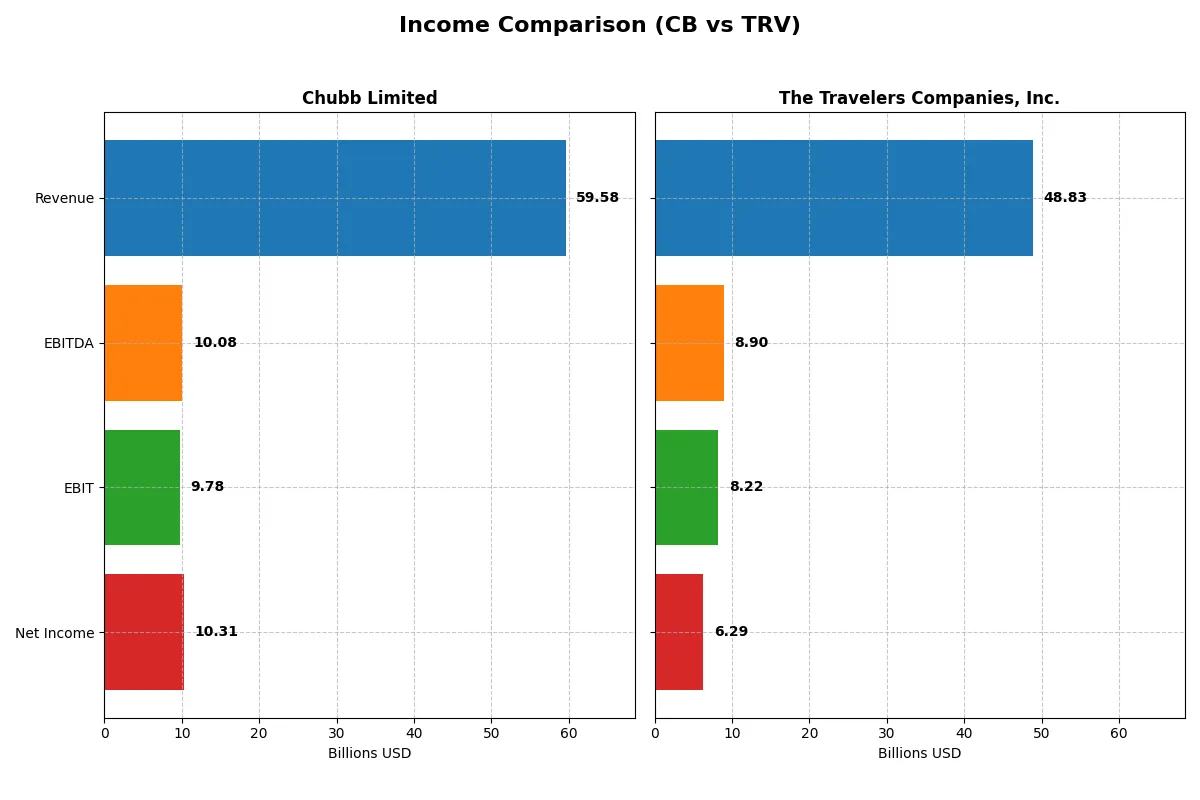
This data dissects the core profitability and scalability of both corporate engines to reveal who dominates the bottom line:
| Metric | Chubb Limited (CB) | The Travelers Companies, Inc. (TRV) |
|---|---|---|
| Revenue | 59.6B | 48.8B |
| Cost of Revenue | 32.0B | 27.2B |
| Operating Expenses | 4.4B | 13.8B |
| Gross Profit | 27.5B | 21.6B |
| EBITDA | 10.1B | 8.9B |
| EBIT | 9.8B | 8.2B |
| Interest Expense | 764M | 425M |
| Net Income | 10.3B | 6.3B |
| EPS | 25.91 | 27.84 |
| Fiscal Year | 2025 | 2025 |
Income Statement Analysis: The Bottom-Line Duel
This income statement comparison reveals which company operates its business engine with greater efficiency and profit generation in 2025.
Chubb Limited Analysis
Chubb Limited’s revenue grew steadily from 40.8B in 2021 to 59.6B in 2025, with net income rising from 8.5B to 10.3B. Its gross margin remains strong at 46.2%, reflecting cost control, while the net margin of 17.3% confirms robust profitability. Despite a slight EBIT decline last year, the company maintains solid momentum and operational efficiency.
The Travelers Companies, Inc. Analysis
Travelers grew revenue from 34.8B in 2021 to 48.8B in 2025, with net income more than doubling from 3.6B to 6.2B. The gross margin of 44.3% and net margin of 12.9% show healthy earnings quality. EBIT surged 25% last year, signaling accelerating operating performance and improving capital efficiency, though operating expenses grew faster than revenue.
Margin Leadership vs. Growth Momentum
Chubb delivers superior margins and consistent net income growth, demonstrating operational discipline and scale advantages. Travelers posts stronger net income growth and EBIT momentum but trails on margin expansion. For investors, Chubb’s profile suits those prioritizing steady profit quality, while Travelers appeals to those seeking higher growth dynamics.
Financial Ratios Comparison
These vital ratios act as a diagnostic tool to expose the underlying fiscal health, valuation premiums, and capital efficiency of the companies analyzed:
| Ratios | Chubb Limited (CB) | The Travelers Companies, Inc. (TRV) |
|---|---|---|
| ROE | 14.0% | 19.1% |
| ROIC | 71.4% | 12.1% |
| P/E | 12.0 | 10.3 |
| P/B | 1.68 | 1.98 |
| Current Ratio | N/A | 0.23 |
| Quick Ratio | N/A | 0.23 |
| D/E | N/A | 0.28 |
| Debt-to-Assets | N/A | 6.45% |
| Interest Coverage | 30.3 | 18.3 |
| Asset Turnover | 0.22 | 0.34 |
| Fixed Asset Turnover | N/A | N/A |
| Payout ratio | 14.7% | 15.6% |
| Dividend yield | 1.22% | 1.51% |
| Fiscal Year | 2025 | 2025 |
Efficiency & Valuation Duel: The Vital Signs
Financial ratios serve as a company’s DNA, exposing hidden risks and operational strengths that shape investor decisions.
Chubb Limited
Chubb shows a solid net margin of 17.3% and a neutral ROE at 14%, reflecting steady profitability. Its P/E ratio of 12.0 remains favorable, indicating reasonable valuation. The robust ROIC of 71.36% far exceeds WACC, signaling efficient capital use. Dividend yield at 1.22% supports moderate shareholder returns alongside conservative financial leverage.
The Travelers Companies, Inc.
Travelers posts a favorable ROE of 19.12% and a respectable net margin of 12.88%, proving strong profitability. The P/E ratio of 10.34 suggests a slightly cheaper valuation than Chubb. ROIC at 12.1% surpasses WACC, but less dramatically. Dividend yield of 1.51% offers attractive income, supported by prudent debt levels and solid interest coverage.
Premium Valuation vs. Balanced Profitability
Travelers delivers a better blend of profitability and valuation with higher ROE and a lower P/E. Chubb impresses with superior ROIC and margin but trades at a slightly higher multiple. Investors seeking growth with disciplined capital efficiency may prefer Chubb, while those favoring income and valuation might lean toward Travelers.
Which one offers the Superior Shareholder Reward?
I see Chubb (CB) and Travelers (TRV) both pay consistent dividends with yields near 1.2–1.5%. CB’s payout ratio stands at around 15%, signaling conservative dividend coverage with strong free cash flow support. TRV matches a slightly higher yield near 1.5% but has a payout ratio closer to 19%, indicating less cushion. Buybacks differ: CB’s buyback data isn’t explicit, suggesting a modest approach, while TRV invests heavily in capex, limiting free cash flow for buybacks. I note CB’s lower financial leverage and stronger solvency metrics, enhancing dividend sustainability. Travelers’ aggressive reinvestment might fuel growth but risks dividend pressure if earnings dip. For 2026, I favor Chubb for a more reliable total return, balancing dividends with prudent capital allocation.
Comparative Score Analysis: The Strategic Profile
The radar chart reveals the fundamental DNA and trade-offs of Chubb Limited and The Travelers Companies, Inc., highlighting their financial strengths and weaknesses:
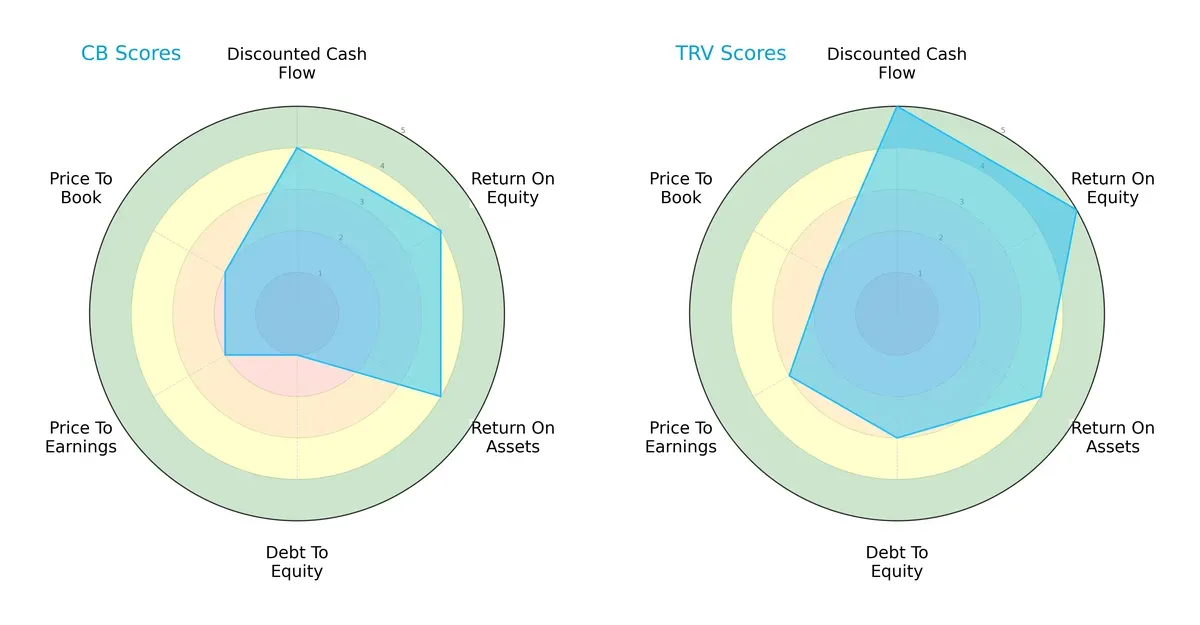
Chubb shows strength in ROE, ROA, and DCF but suffers from a very unfavorable debt-to-equity score and weak valuation metrics. Travelers, meanwhile, delivers a more balanced profile with superior DCF, ROE, and moderate debt-to-equity, though it shares a similar valuation challenge on price-to-book. Travelers relies on operational efficiency and financial stability, while Chubb leans heavily on profitability metrics but carries higher leverage risk.
Bankruptcy Risk: Solvency Showdown
Both companies are in the distress zone per their Altman Z-Scores, signaling elevated bankruptcy risk in this cycle:
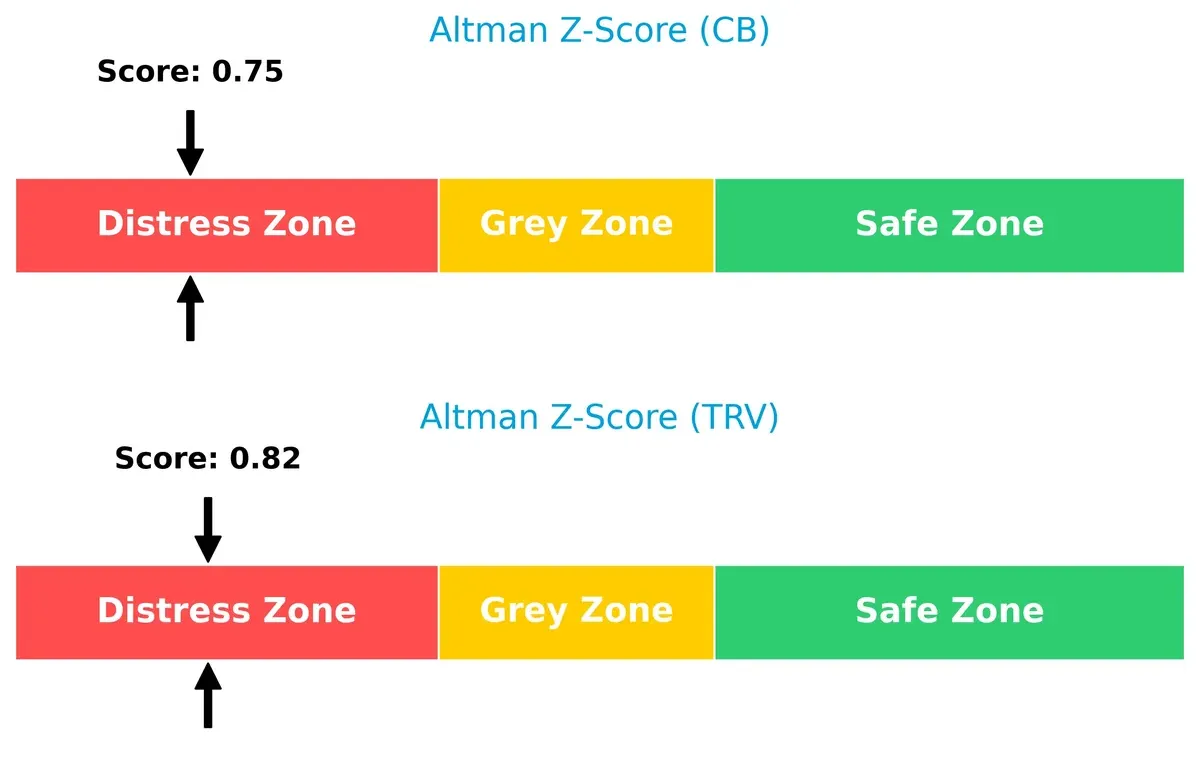
Chubb’s Z-score of 0.75 slightly lags Travelers’ 0.82, but both remain well below the safe threshold of 3. This highlights significant solvency concerns and the critical need for careful risk management in portfolio allocations.
Financial Health: Quality of Operations
Travelers leads with a strong Piotroski F-Score of 7, while Chubb’s 6 indicates average financial health, suggesting modest operational risks:
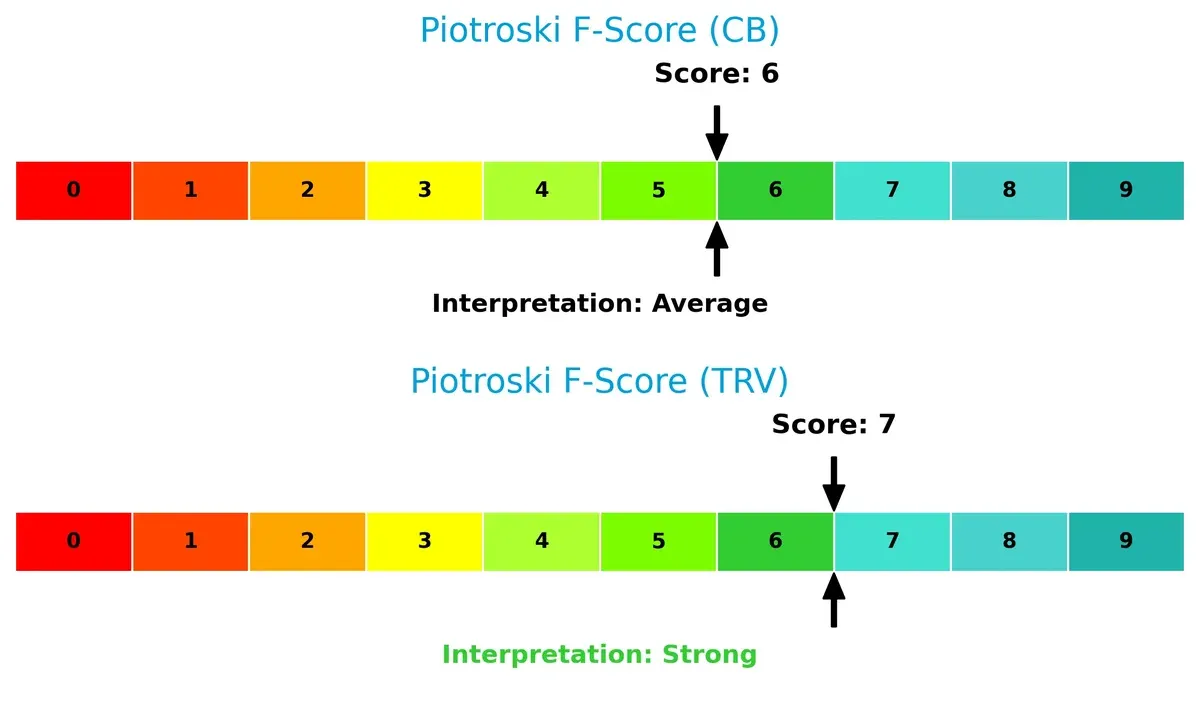
Travelers’ stronger score reflects better profitability, liquidity, and efficiency metrics, while Chubb’s lower score flags potential red flags internally. Investors should weigh Travelers’ superior quality of operations against Chubb’s leverage concerns.
How are the two companies positioned?
This section dissects CB and TRV’s operational DNA by comparing their revenue distribution and internal dynamics—strengths and weaknesses. The goal is to confront their economic moats to reveal which model offers a more resilient, sustainable competitive advantage today.
Revenue Segmentation: The Strategic Mix
This visual comparison dissects how Chubb Limited and The Travelers Companies, Inc. diversify their income streams and reveals their primary sector bets:
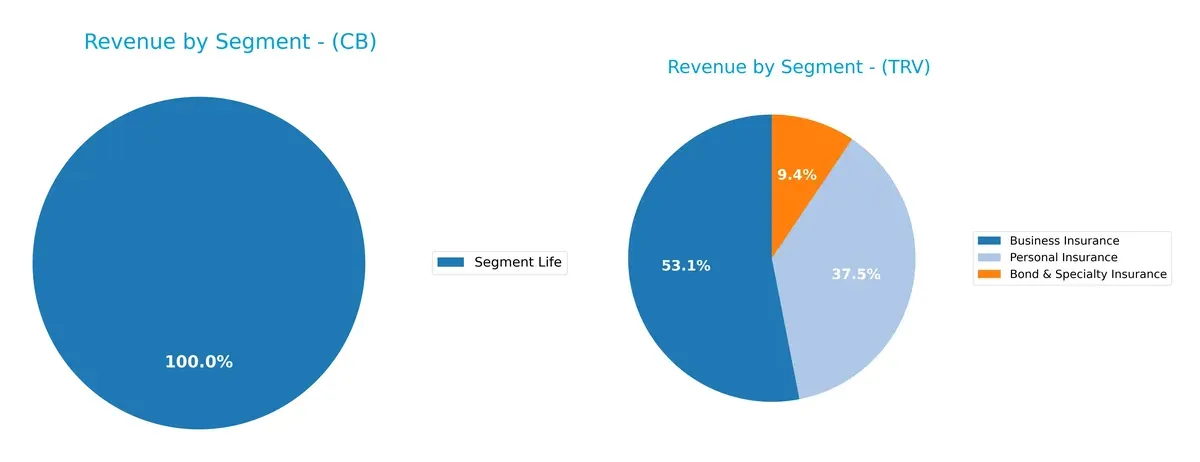
Chubb Limited anchors its revenue in a single dominant segment: Segment Life, around $6.7B in 2024. In contrast, Travelers displays a more diversified mix with Business Insurance ($24.7B), Personal Insurance ($17.4B), and Bond & Specialty Insurance ($4.4B). Travelers’ breadth reduces concentration risk and signals a multi-front market approach. Meanwhile, Chubb’s focus on life insurance suggests deep specialization but exposes it to sector-specific volatility.
Strengths and Weaknesses Comparison
This table compares the strengths and weaknesses of Chubb Limited and The Travelers Companies, Inc.:
Chubb Limited Strengths
- High net margin at 17.3%
- Strong ROIC at 71.36%, well above WACC
- Favorable debt metrics with zero debt reported
- Consistent profitability with favorable PE ratio
The Travelers Companies Strengths
- Favorable net margin at 12.88%
- Higher ROE at 19.12%, indicating efficient equity use
- Low WACC at 5.92% supports cost-effective capital
- Diversified revenue streams across three insurance segments
Chubb Limited Weaknesses
- Unfavorable liquidity ratios with zero current and quick ratios
- Low asset turnover at 0.22 suggests less efficient asset use
- Neutral ROE at 13.98% may limit equity returns
The Travelers Companies Weaknesses
- Unfavorable current and quick ratios at 0.23 indicate liquidity risks
- Asset turnover of 0.34 remains below ideal efficiency levels
- Moderate debt to equity ratio at 0.28 could constrain flexibility
Both companies show strong profitability and conservative capital structures. Chubb excels in return on invested capital and debt management, while Travelers benefits from higher equity returns and diversified revenue. However, liquidity concerns and asset utilization inefficiencies pose risks for both, signaling areas needing strategic attention.
The Moat Duel: Analyzing Competitive Defensibility
A structural moat is the only reliable shield protecting long-term profits from relentless competitive erosion in the insurance sector:
Chubb Limited: Intangible Assets Moat
Chubb leverages strong brand reputation and underwriting expertise, reflected in a solid 17.3% net margin and 65% ROIC premium over WACC. However, its declining ROIC signals emerging pressures in 2026.
The Travelers Companies, Inc.: Operational Efficiency Moat
Travelers contrasts with Chubb by showing a rising ROIC trend and excellent margin expansion, driven by operational scale and cost discipline. Its diverse U.S. and international footprint supports growth and moat deepening.
Brand Reputation vs. Operational Excellence
Travelers boasts a wider moat with growing ROIC and margin expansion, whereas Chubb’s moat, though deep, faces sustainability challenges. Travelers appears better positioned to defend and expand market share in 2026.
Which stock offers better returns?
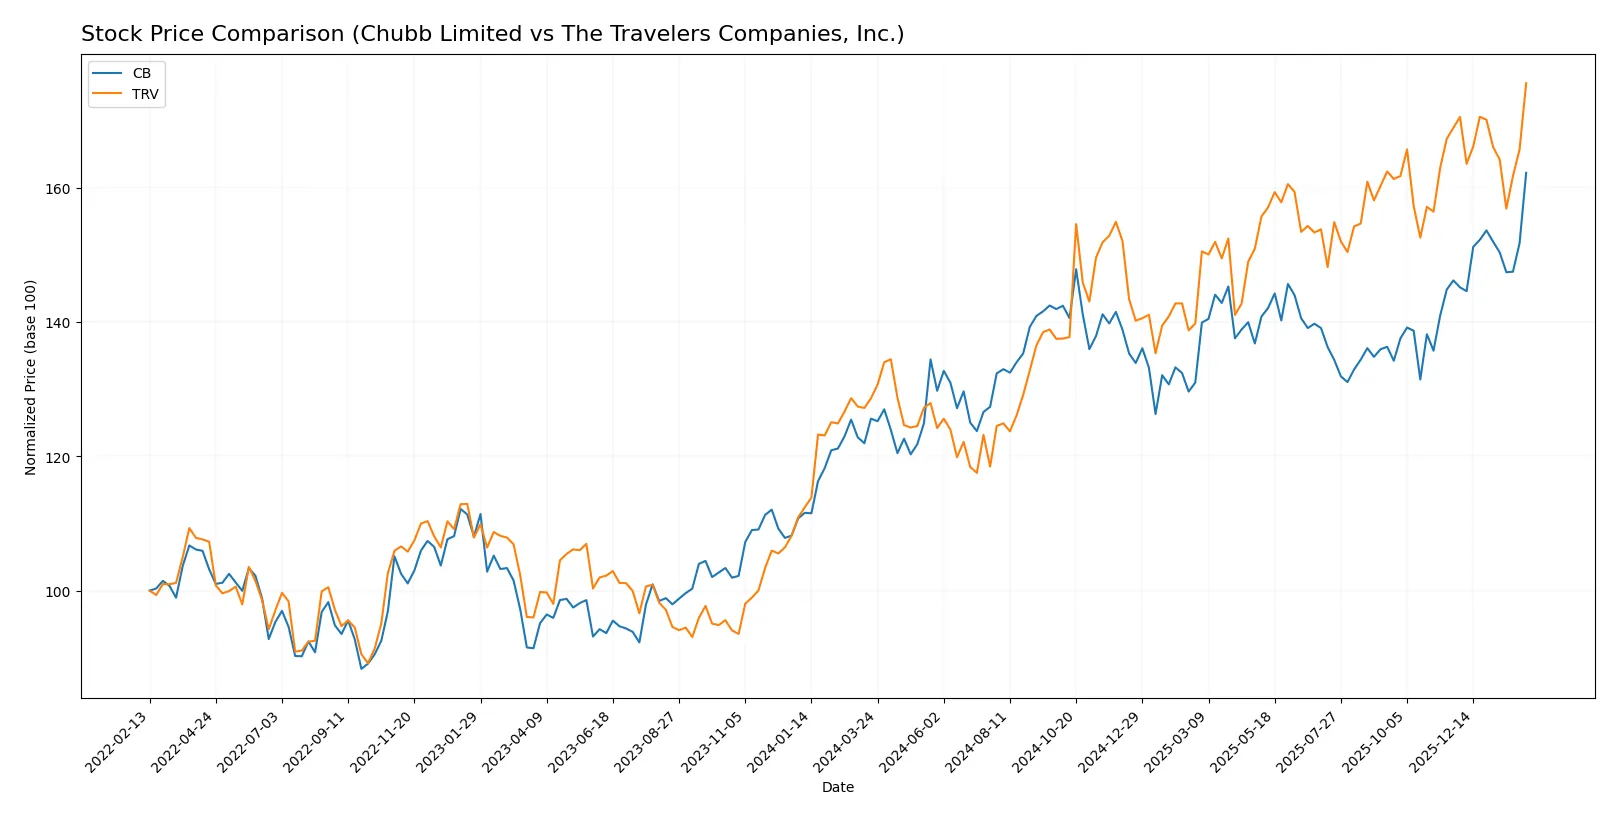
Over the past 12 months, both Chubb Limited and The Travelers Companies, Inc. showed strong price appreciation, with distinct acceleration and deceleration phases shaping their trading dynamics.
Trend Comparison
Chubb Limited’s stock rose 29.14% over the last year, marking a clear bullish trend with accelerating momentum and a high of 330.97. Volatility measured by a 16.12 standard deviation remains moderate.
The Travelers Companies, Inc. gained 36.46% in the same period, also bullish but with decelerating momentum. It showed higher volatility with a 25.4 standard deviation and a peak price of 301.49.
Travelers outperformed Chubb in total returns despite slowing recent momentum, while Chubb showed stronger acceleration and steadier volatility over the year.
Target Prices
Analysts present a confident outlook for both Chubb Limited and The Travelers Companies, Inc., with target prices close to current market levels.
| Company | Target Low | Target High | Consensus |
|---|---|---|---|
| Chubb Limited | 283 | 366 | 330.5 |
| The Travelers Companies, Inc. | 304 | 317 | 312.75 |
Chubb’s consensus target aligns almost exactly with its current price of 331, signaling limited upside. Travelers shows a more bullish stance, with a consensus target about 3.7% above its current 301.49 price.

Don’t Let Luck Decide Your Entry Point
Optimize your entry points with our advanced ProRealTime indicators. You’ll get efficient buy signals with precise price targets for maximum performance. Start outperforming now!
How do institutions grade them?
The following tables summarize recent institutional grades for Chubb Limited and The Travelers Companies, Inc.:
Chubb Limited Grades
This table lists recent grades and actions from major grading companies for Chubb Limited.
| Grading Company | Action | New Grade | Date |
|---|---|---|---|
| Wells Fargo | Maintain | Equal Weight | 2026-02-05 |
| Evercore ISI Group | Maintain | Outperform | 2026-02-04 |
| JP Morgan | Maintain | Neutral | 2026-02-04 |
| Roth Capital | Maintain | Buy | 2026-02-04 |
| Citizens | Maintain | Market Outperform | 2026-02-04 |
| Citizens | Maintain | Market Outperform | 2026-01-16 |
| Cantor Fitzgerald | Maintain | Neutral | 2026-01-14 |
| Wells Fargo | Maintain | Equal Weight | 2026-01-13 |
| Barclays | Maintain | Equal Weight | 2026-01-08 |
| Goldman Sachs | Upgrade | Buy | 2026-01-08 |
The Travelers Companies, Inc. Grades
This table presents recent ratings and actions from reliable grading companies for The Travelers Companies, Inc.
| Grading Company | Action | New Grade | Date |
|---|---|---|---|
| Cantor Fitzgerald | Maintain | Overweight | 2026-02-02 |
| Citigroup | Maintain | Sell | 2026-01-27 |
| Roth Capital | Maintain | Buy | 2026-01-23 |
| Keefe, Bruyette & Woods | Maintain | Outperform | 2026-01-23 |
| Wells Fargo | Maintain | Equal Weight | 2026-01-22 |
| Mizuho | Maintain | Neutral | 2026-01-22 |
| Cantor Fitzgerald | Maintain | Overweight | 2026-01-14 |
| Wells Fargo | Maintain | Equal Weight | 2026-01-13 |
| Barclays | Maintain | Equal Weight | 2026-01-08 |
| JP Morgan | Maintain | Underweight | 2026-01-07 |
Which company has the best grades?
Chubb Limited receives generally positive grades, including multiple “Buy” and “Outperform” ratings. The Travelers shows a wider range, from “Buy” and “Overweight” to a “Sell” and “Underweight.” Investors may view Chubb as more consistently favored by analysts.
Risks specific to each company
The following categories identify the critical pressure points and systemic threats facing both firms in the 2026 market environment:
1. Market & Competition
Chubb Limited
- Operates globally with a broad insurance portfolio, facing intense competition in specialty and commercial lines.
The Travelers Companies, Inc.
- Focused mainly on U.S. market with diversified insurance segments, competing in a mature, crowded property & casualty sector.
2. Capital Structure & Debt
Chubb Limited
- Exhibits zero debt-related ratios, signaling a conservative balance sheet and low financial risk.
The Travelers Companies, Inc.
- Maintains moderate leverage (D/E 0.28), balancing growth and risk with manageable debt levels.
3. Stock Volatility
Chubb Limited
- Beta of 0.49 indicates lower volatility, providing defensive characteristics amid market swings.
The Travelers Companies, Inc.
- Beta of 0.52 suggests slightly higher volatility, reflecting moderate sensitivity to market shifts.
4. Regulatory & Legal
Chubb Limited
- Global operations expose it to complex, diverse regulatory frameworks and compliance costs.
The Travelers Companies, Inc.
- Primarily U.S.-focused, faces concentrated regulatory scrutiny but benefits from regulatory familiarity.
5. Supply Chain & Operations
Chubb Limited
- Global underwriting and claims operations can face operational complexity and geopolitical disruptions.
The Travelers Companies, Inc.
- Domestic operations streamline supply chain risks but may lack geographic risk diversification.
6. ESG & Climate Transition
Chubb Limited
- Exposure to climate risks globally, especially in natural catastrophe insurance lines, requires proactive ESG strategies.
The Travelers Companies, Inc.
- Also highly exposed to climate-related claims in property insurance; must adapt underwriting to evolving risks.
7. Geopolitical Exposure
Chubb Limited
- Greater geopolitical risk from multinational footprint, including currency and political instability.
The Travelers Companies, Inc.
- Limited international presence reduces geopolitical uncertainties but concentrates risk in U.S. economy.
Which company shows a better risk-adjusted profile?
Chubb faces its biggest risk from complex geopolitical and regulatory challenges due to its global scale. Travelers’ main risk lies in concentrated market exposure and moderate leverage. Travelers presents a slightly better risk-adjusted profile, supported by stronger financial scores and manageable debt. Travelers’ higher ROE and Altman Z-Score, despite similar distress-zone warnings, signal superior operational efficiency and financial stability.
Final Verdict: Which stock to choose?
Chubb Limited’s superpower lies in its exceptional capital efficiency, generating returns far above its cost of capital. This strong value creation signals a cash machine with solid profitability. The point of vigilance is its declining ROIC trend, which might challenge future growth. It suits portfolios targeting steady, value-oriented growth.
The Travelers Companies boasts a strategic moat with a sustainably growing ROIC, reflecting increasing profitability and effective capital use. Its safety profile appears stronger, supported by higher returns on equity and a more robust rating. Travelers fits well within GARP portfolios seeking growth with reasonable valuation and stability.
If you prioritize capital efficiency and consistent value creation, Chubb Limited is compelling due to its high ROIC advantage. However, if you seek growing profitability paired with stronger safety metrics, Travelers offers better stability and a more favorable growth trajectory. Both present analytical scenarios worth considering based on your investment style.
Disclaimer: Investment carries a risk of loss of initial capital. The past performance is not a reliable indicator of future results. Be sure to understand risks before making an investment decision.
Go Further
I encourage you to read the complete analyses of Chubb Limited and The Travelers Companies, Inc. to enhance your investment decisions: