Home > Comparison > Financial Services > PGR vs CB
The strategic rivalry between The Progressive Corporation and Chubb Limited shapes the global property and casualty insurance sector. Progressive operates as a U.S.-focused personal and commercial auto insurer with a direct-to-consumer model. Chubb, a Swiss-based insurer, offers diverse commercial and specialty lines worldwide through brokers. This analysis contrasts their distinct operational strategies to identify which presents superior risk-adjusted potential for a diversified portfolio in an evolving financial services landscape.

Table of contents
Companies Overview
The Progressive Corporation and Chubb Limited stand as titans in the Property & Casualty insurance landscape.
The Progressive Corporation: Specialist in Personal & Commercial Auto Insurance
The Progressive Corporation excels as a leading U.S. insurer specializing in personal and commercial auto coverage. Its core revenue stems from personal lines such as auto and recreational vehicles, alongside commercial lines for small business fleets. In 2026, Progressive prioritizes digital distribution channels, leveraging direct internet and mobile sales to optimize customer acquisition and claims processing efficiency.
Chubb Limited: Global Provider of Diverse Insurance Solutions
Chubb Limited operates as a global specialty insurer with a broad portfolio across commercial, personal, agriculture, and reinsurance segments. It generates revenue primarily through complex risk management products and high-net-worth personal lines. In 2026, Chubb concentrates on expanding its specialty insurance offerings and enhancing broker relationships across North America and international markets.
Strategic Collision: Similarities & Divergences
Progressive’s focus on a direct-to-consumer model contrasts with Chubb’s broker-centric, diversified approach. Both compete fiercely in the lucrative U.S. P&C market, yet Progressive targets volume-driven personal auto policies while Chubb emphasizes niche specialty risks and affluent clients. Their investment profiles diverge sharply: Progressive bets on scale and tech efficiency, whereas Chubb leverages global reach and product breadth.
Income Statement Comparison
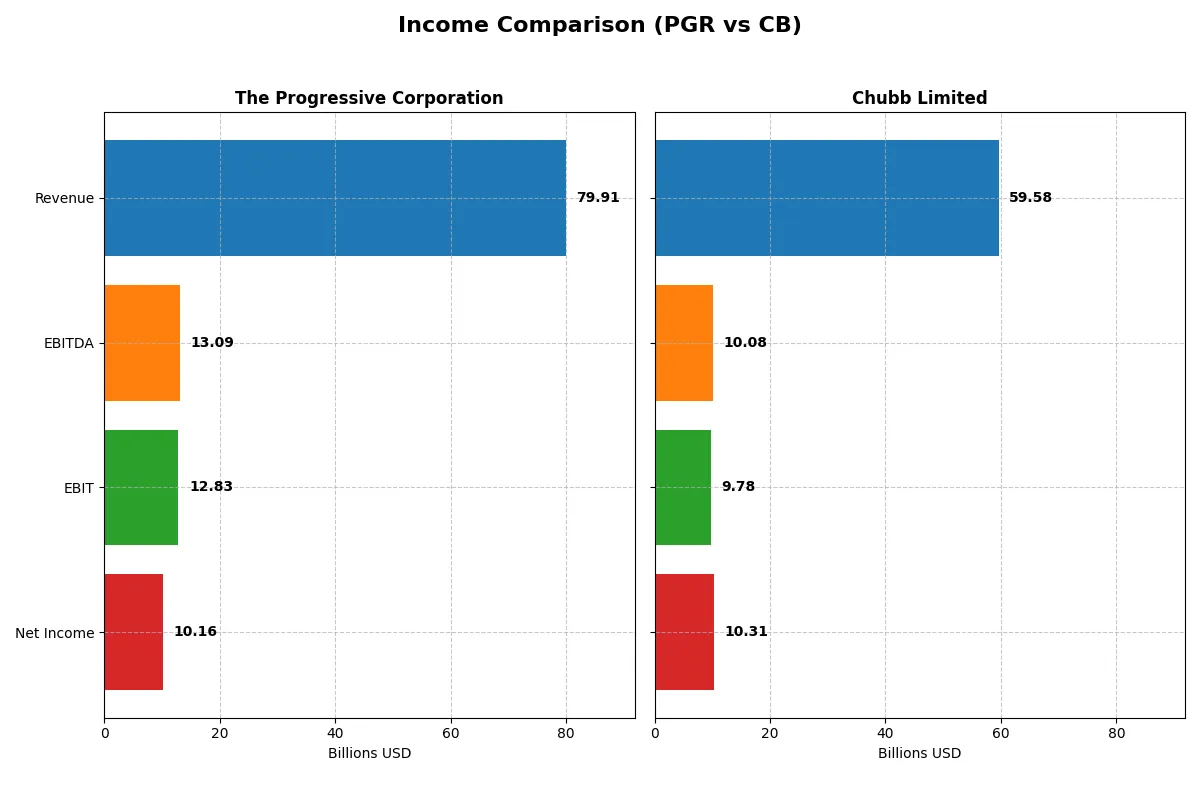
This data dissects the core profitability and scalability of both corporate engines to reveal who dominates the bottom line:
| Metric | The Progressive Corporation (PGR) | Chubb Limited (CB) |
|---|---|---|
| Revenue | 79.9B | 59.6B |
| Cost of Revenue | 55.3B | 32.0B |
| Operating Expenses | 11.8B | 4.4B |
| Gross Profit | 24.6B | 27.5B |
| EBITDA | 13.1B | 10.1B |
| EBIT | 12.8B | 9.8B |
| Interest Expense | 255M | 764M |
| Net Income | 10.2B | 10.3B |
| EPS | 17.27 | 25.91 |
| Fiscal Year | 2025 | 2025 |
Income Statement Analysis: The Bottom-Line Duel
This income statement comparison reveals the true efficiency and profitability trends shaping each company’s financial engine.
The Progressive Corporation Analysis
Progressive’s revenue surged from 47.7B in 2021 to 79.9B in 2025, reflecting a 68% growth. Net income exploded over 200%, reaching 10.2B in 2025. Gross and net margins hold strong at 30.8% and 12.7% respectively, signaling robust cost control. The latest year shows accelerating momentum with a 17.7% gross profit jump and nearly 20% EPS growth.
Chubb Limited Analysis
Chubb’s revenue rose steadily from 40.8B in 2021 to 59.6B in 2025, a 46% increase. Net income grew more modestly by 21%, hitting 10.3B in 2025. Gross margin dominates at 46.2%, with a healthy net margin of 17.3%. However, EBIT declined nearly 20% in the latest year despite strong revenue gains, indicating pressure on operating efficiency.
Margin Strength vs. Growth Momentum
Progressive outpaces Chubb in revenue and net income growth, driven by expanding margins and operating leverage. Chubb boasts superior gross and net margins but faces recent EBIT contraction. For investors, Progressive’s rapid profit acceleration suits growth-focused portfolios, while Chubb’s margin profile appeals to those prioritizing steady profitability.
Financial Ratios Comparison
These vital ratios act as a diagnostic tool to expose the underlying fiscal health, valuation premiums, and capital efficiency of the companies compared below:
| Ratios | The Progressive Corporation (PGR) | Chubb Limited (CB) |
|---|---|---|
| ROE | 2.23% (2025) | 13.98% (2025) |
| ROIC | 9.30% (2025) | 71.36% (2025) |
| P/E | 13.19 (2025) | 12.00 (2025) |
| P/B | 29.35 (2025) | 1.68 (2025) |
| Current Ratio | 0 (2025) | 0 (2025) |
| Quick Ratio | 0 (2025) | 0 (2025) |
| D/E (Debt-to-Equity) | 0 (2025) | 0 (2025) |
| Debt-to-Assets | 0 (2025) | 0 (2025) |
| Interest Coverage | 50.33 (2025) | 30.34 (2025) |
| Asset Turnover | 0.88 (2025) | 0.22 (2025) |
| Fixed Asset Turnover | 0 (2025) | 0 (2025) |
| Payout Ratio | 28.37% (2025) | 14.69% (2025) |
| Dividend Yield | 2.15% (2025) | 1.22% (2025) |
| Fiscal Year | 2025 | 2025 |
Efficiency & Valuation Duel: The Vital Signs
Financial ratios serve as a company’s DNA, uncovering hidden risks and operational strengths that raw numbers alone cannot reveal.
The Progressive Corporation
The Progressive Corporation displays a stellar ROE of 222.54%, signaling exceptional profitability, while its net margin at 12.72% confirms solid operational efficiency. Its P/E ratio of 13.19 suggests the stock is attractively valued, though a high PB ratio at 29.35 indicates potential overvaluation in book terms. Progressive rewards shareholders with a 2.15% dividend yield, highlighting steady income distribution.
Chubb Limited
Chubb Limited posts a strong net margin of 17.3% and a moderate ROE of 13.98%, reflecting consistent profitability. Its P/E ratio of 12.0 signals a reasonably priced stock, supported by a healthy ROIC of 71.36%, which far exceeds its WACC at 6.06%, demonstrating excellent capital efficiency. Chubb offers a 1.22% dividend yield, balancing income with reinvestment potential.
Premium Valuation vs. Operational Safety
Progressive leads with extraordinary ROE and a favorable P/E, but its inflated PB ratio raises caution. Chubb excels in capital return and operational margins with a slightly lower valuation. Investors seeking growth with high profitability may prefer Progressive, while those prioritizing capital efficiency and margin stability might lean toward Chubb.
Which one offers the Superior Shareholder Reward?
I compare The Progressive Corporation (PGR) and Chubb Limited (CB) by their 2025 dividend yields, payout ratios, and buyback intensity. PGR yields 2.15% with a 28% payout ratio, signaling a balanced dividend supported by stable free cash flow. CB pays a 1.22% yield with a 15% payout, favoring moderate dividends. Both deploy capital prudently, but PGR’s higher yield and payout ratio suggest a stronger shareholder income focus. CB’s lower payout ratio implies more reinvestment or buybacks, yet its dividend is less generous. Considering sustainability, PGR’s dividend coverage and steady buybacks offer a more reliable total return profile in 2026. I conclude PGR offers the superior shareholder reward for income-oriented investors this year.
Comparative Score Analysis: The Strategic Profile
The radar chart reveals the fundamental DNA and trade-offs of The Progressive Corporation and Chubb Limited, highlighting their financial strengths and vulnerabilities:
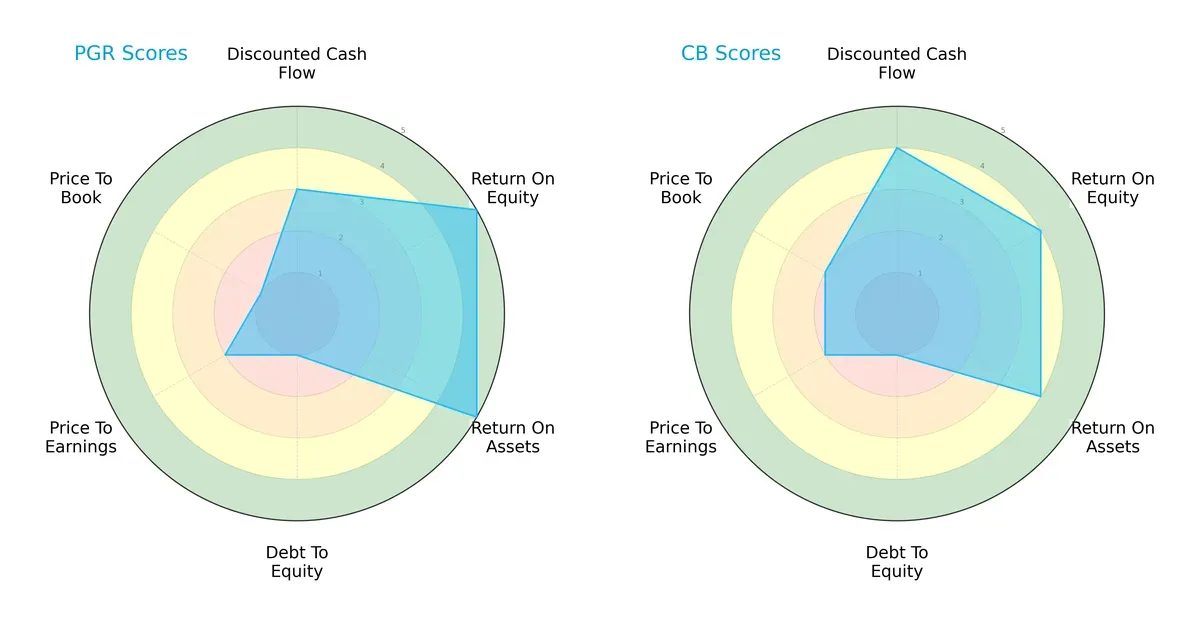
The Progressive Corporation excels in profitability metrics with top ROE and ROA scores (5 each), signaling superior asset and equity efficiency. Chubb Limited posts slightly better DCF (4 vs. 3) and valuation scores, indicating a more favorable market pricing. Both share a critical weakness: a very unfavorable debt-to-equity score (1), flagging high leverage risk. Progressive’s profile is more polarized, relying on operational excellence, while Chubb offers a more balanced but less outstanding financial footprint.
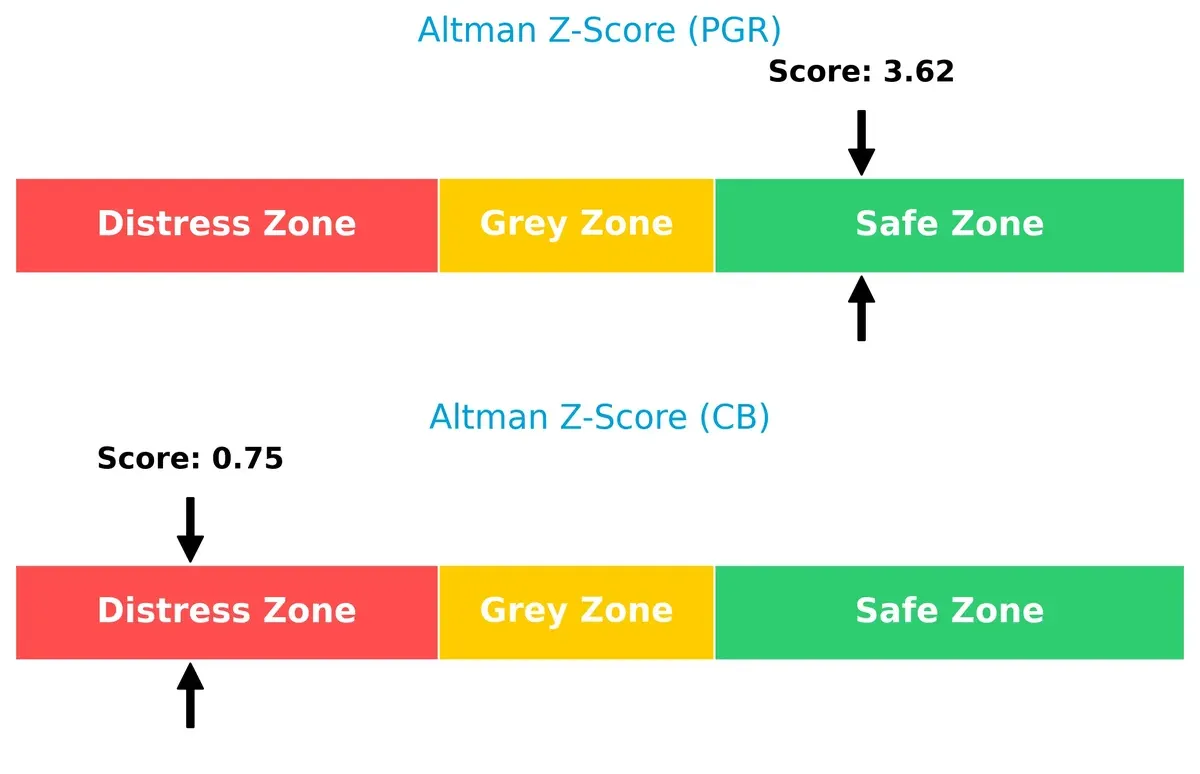
Bankruptcy Risk: Solvency Showdown
The Progressive Corporation’s Altman Z-Score of 3.62 firmly places it in the safe zone, suggesting strong long-term survival capacity. Chubb Limited’s score of 0.75 signals distress and elevated bankruptcy risk in this cycle:
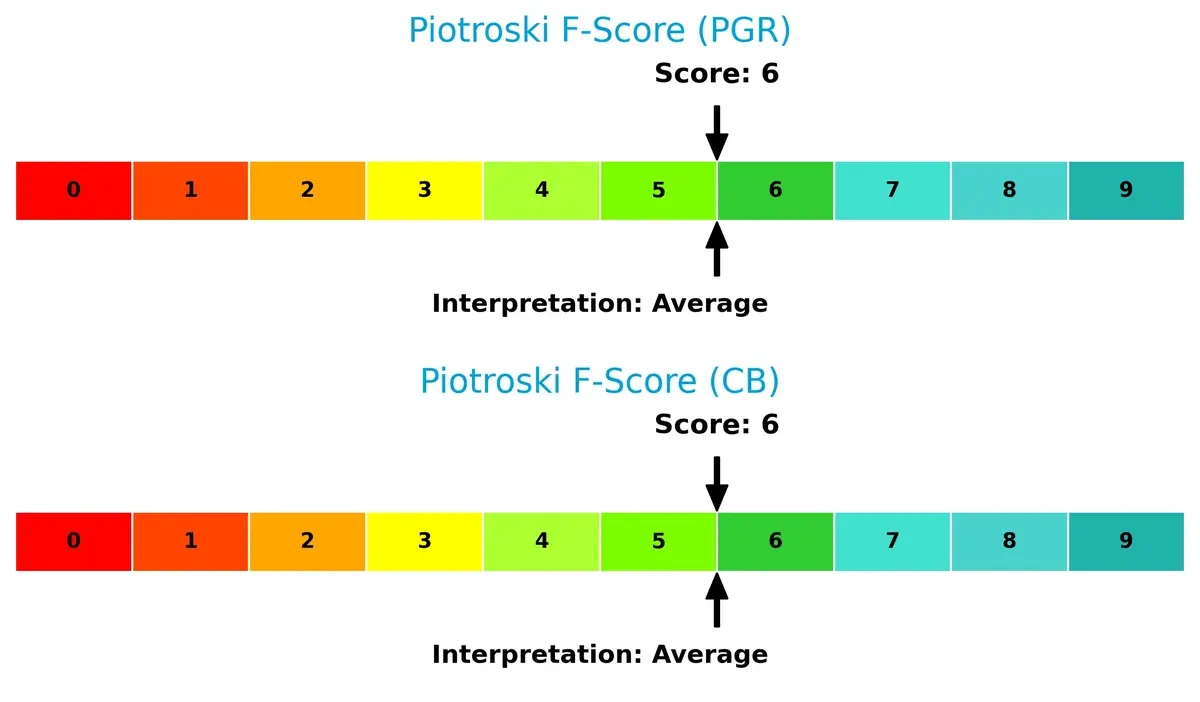
Financial Health: Quality of Operations
Both companies share an average Piotroski F-Score of 6, reflecting moderate financial health with no glaring red flags. Neither firm demonstrates peak operational strength nor severe internal weaknesses:
How are the two companies positioned?
This section dissects PGR and CB’s operational DNA by comparing revenue distribution and internal dynamics. The goal is to confront their economic moats, revealing which model offers the most resilient competitive advantage today.
Revenue Segmentation: The Strategic Mix
This visual comparison dissects how The Progressive Corporation and Chubb Limited diversify their income streams and reveals their primary sector bets:
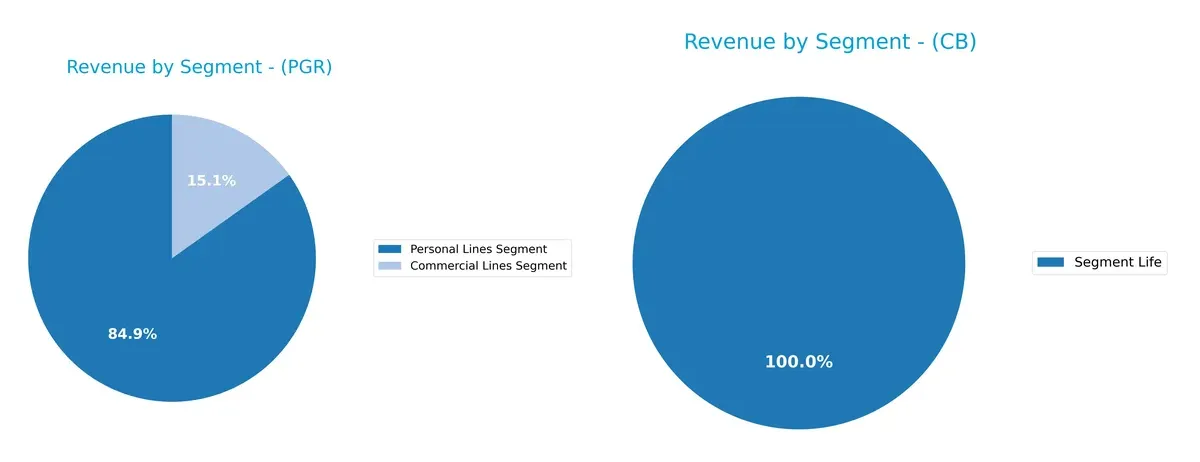
The Progressive Corporation anchors its revenue in the Personal Lines Segment with $61B in 2024, supplemented by $10.9B in Commercial Lines. This mix shows moderate diversification but heavy dependence on personal insurance. Conversely, Chubb Limited’s latest data reveals a dominant Life segment at $6.75B, lacking recent property and casualty breakdowns. Progressive’s focus on personal insurance signals consumer market strength, while Chubb’s narrower data suggests potential concentration risk or data gaps.
Strengths and Weaknesses Comparison
This table compares the strengths and weaknesses of The Progressive Corporation and Chubb Limited:
PGR Strengths
- Strong net margin at 12.72%
- Exceptionally high ROE at 222.54%
- Favorable WACC at 5.26%
- Low debt-to-assets ratio
- Solid interest coverage ratio of 50.33
- Dominant Personal Lines revenue of $61B
CB Strengths
- Higher net margin at 17.3%
- Very high ROIC at 71.36%
- Favorable WACC at 6.06%
- Low debt-to-assets ratio
- Healthy interest coverage of 12.8
- Significant Property & Casualty revenue around $13.7B
PGR Weaknesses
- Unfavorable PB ratio at 29.35 indicates possible overvaluation
- Zero current and quick ratios present liquidity concerns
- Fixed asset turnover at 0
- Neutral ROIC at 9.3%
- Moderate asset turnover at 0.88
- Lacks reported geographic diversification data
CB Weaknesses
- Zero current and quick ratios raise liquidity red flags
- Unfavorable asset turnover at 0.22
- Fixed asset turnover at 0
- Neutral dividend yield at 1.22%
- ROE neutral at 13.98%
- Limited geographic revenue concentration in the U.S. ($10.4B)
Both companies exhibit strong profitability and low leverage, but liquidity ratios are a notable concern. PGR’s exceptionally high ROE contrasts with CB’s superior ROIC, reflecting different capital efficiency dynamics that shape their strategic focus.
The Moat Duel: Analyzing Competitive Defensibility
A structural moat protects long-term profits from relentless competitive erosion. Without it, market share and margins quickly vanish:
The Progressive Corporation: Data-Driven Switching Costs
Progressive’s moat stems from switching costs embedded in its customer-centric digital platform and tailored insurance products. This advantage yields stable margins and a 4% ROIC premium over WACC. In 2026, expanding commercial lines deepens its lock-in, reinforcing value creation.
Chubb Limited: Diversified Risk Intangible Assets
Chubb’s moat rests on its intangible assets—brand strength and underwriting expertise across global risk categories. Unlike Progressive, Chubb’s ROIC premium is higher but declining, signaling margin pressure. Future growth depends on leveraging specialty insurance and global reinsurance markets to offset headwinds.
Switching Costs vs. Intangible Expertise: The Moat Face-Off
Progressive shows a wider, growing moat with rising ROIC and operational efficiency. Chubb creates value but faces a shrinking moat due to declining profitability. I see Progressive better positioned to defend and expand its market share in 2026.
Which stock offers better returns?
The past year shows contrasting stock dynamics: The Progressive Corporation (PGR) declined modestly with decelerating losses, while Chubb Limited (CB) surged strongly with accelerating gains.
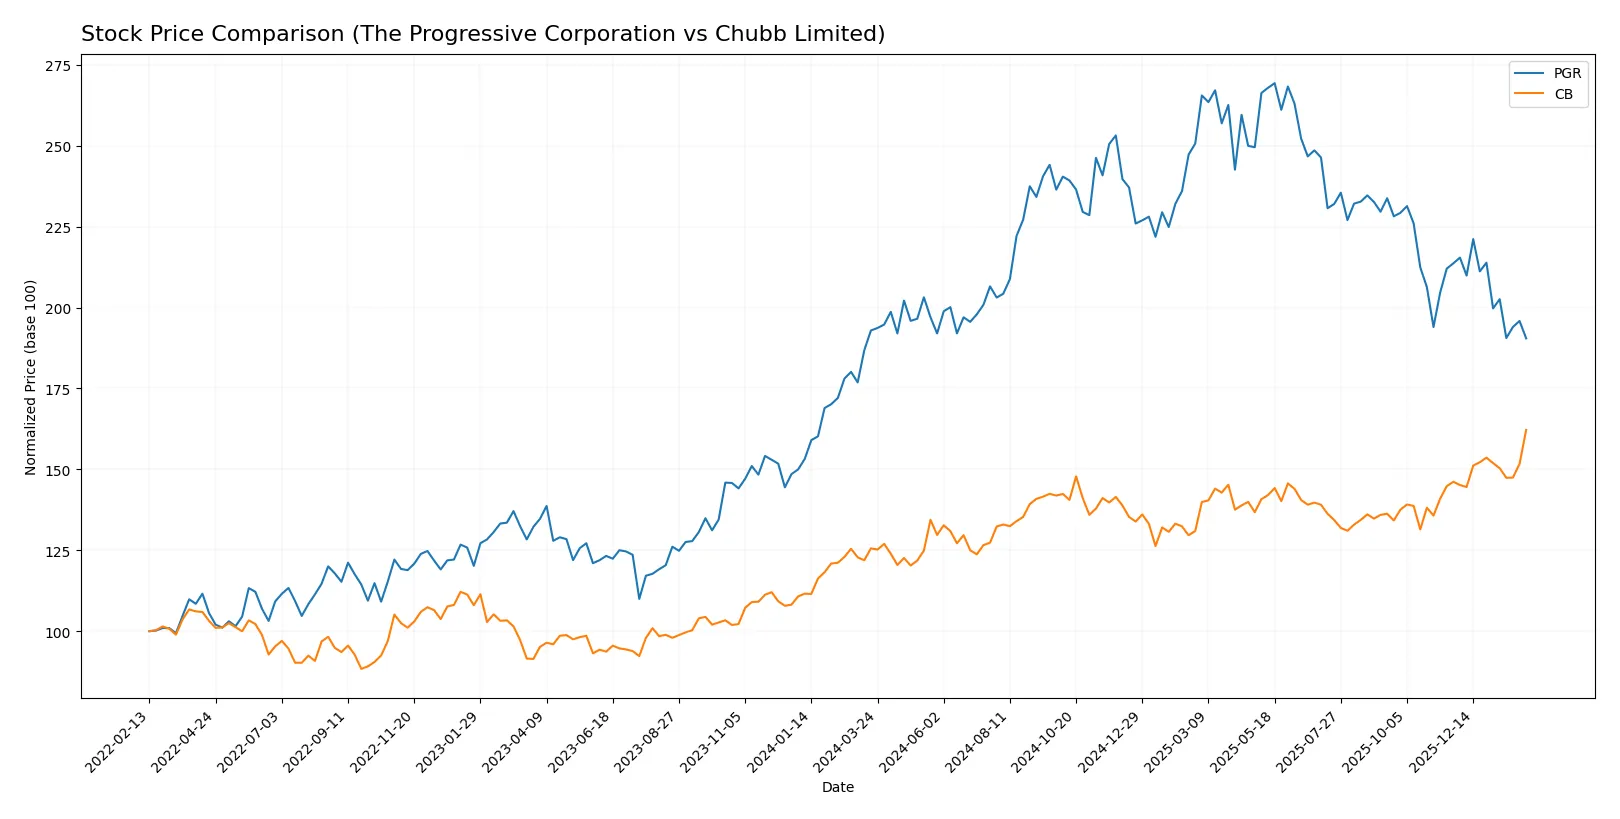
Trend Comparison
The Progressive Corporation’s stock fell by 1.26% over the last 12 months, signaling a bearish trend with decelerating losses despite a high volatility of 24.38. Recent months show sharper declines near -10.85%. Chubb Limited’s stock rose 29.14% in the same period, marking a bullish trend with accelerating gains and lower volatility at 16.12. Recent performance added 10.96%, reinforcing positive momentum. Chubb clearly outperformed Progressive, delivering the highest market return with sustained upward acceleration over the past year.
Target Prices
Analysts present a bullish consensus for both The Progressive Corporation and Chubb Limited.
| Company | Target Low | Target High | Consensus |
|---|---|---|---|
| The Progressive Corporation | 214 | 265 | 236.55 |
| Chubb Limited | 283 | 366 | 330.5 |
The Progressive’s target consensus of 236.55 exceeds its current 2026 price of 202.29, signaling upside potential. Chubb’s consensus target at 330.5 nearly matches its current price of 330.97, indicating a balanced risk-reward outlook.

Don’t Let Luck Decide Your Entry Point
Optimize your entry points with our advanced ProRealTime indicators. You’ll get efficient buy signals with precise price targets for maximum performance. Start outperforming now!
How do institutions grade them?
The following tables summarize recent institutional grades for The Progressive Corporation and Chubb Limited:
The Progressive Corporation Grades
This table shows recent grades from major financial institutions for The Progressive Corporation.
| Grading Company | Action | New Grade | Date |
|---|---|---|---|
| Citigroup | Maintain | Buy | 2026-02-04 |
| Keefe, Bruyette & Woods | Maintain | Market Perform | 2026-01-30 |
| Wells Fargo | Maintain | Equal Weight | 2026-01-29 |
| Morgan Stanley | Maintain | Underweight | 2026-01-29 |
| BMO Capital | Maintain | Market Perform | 2026-01-29 |
| BMO Capital | Maintain | Market Perform | 2026-01-15 |
| Wells Fargo | Maintain | Equal Weight | 2026-01-13 |
| Barclays | Upgrade | Overweight | 2026-01-08 |
| Evercore ISI Group | Maintain | In Line | 2026-01-07 |
| JP Morgan | Maintain | Overweight | 2026-01-07 |
Chubb Limited Grades
This table shows recent grades from major financial institutions for Chubb Limited.
| Grading Company | Action | New Grade | Date |
|---|---|---|---|
| Wells Fargo | Maintain | Equal Weight | 2026-02-05 |
| Evercore ISI Group | Maintain | Outperform | 2026-02-04 |
| JP Morgan | Maintain | Neutral | 2026-02-04 |
| Roth Capital | Maintain | Buy | 2026-02-04 |
| Citizens | Maintain | Market Outperform | 2026-02-04 |
| Citizens | Maintain | Market Outperform | 2026-01-16 |
| Cantor Fitzgerald | Maintain | Neutral | 2026-01-14 |
| Wells Fargo | Maintain | Equal Weight | 2026-01-13 |
| Barclays | Maintain | Equal Weight | 2026-01-08 |
| Goldman Sachs | Upgrade | Buy | 2026-01-08 |
Which company has the best grades?
Chubb Limited generally receives higher grades, including multiple Buy and Outperform ratings. The Progressive Corporation mostly earns Market Perform and Equal Weight, with some Overweight ratings. This disparity could influence investor perception of growth and risk.
Risks specific to each company
The following categories identify critical pressure points and systemic threats facing both firms in the 2026 market environment:
1. Market & Competition
The Progressive Corporation
- Strong presence in U.S. personal and commercial auto insurance; faces intense pricing competition.
Chubb Limited
- Global footprint with diversified offerings; competes in niche specialty and high-net-worth segments.
2. Capital Structure & Debt
The Progressive Corporation
- No reported debt; strong interest coverage ratio at 50.33; favorable debt metrics.
Chubb Limited
- Also no debt; interest coverage lower at 12.8 but still favorable; solid financial leverage.
3. Stock Volatility
The Progressive Corporation
- Low beta at 0.318 signals low market volatility; stock price range wider.
Chubb Limited
- Moderate beta at 0.488 indicates more sensitivity to market swings; narrower price range.
4. Regulatory & Legal
The Progressive Corporation
- U.S.-centric regulatory environment with evolving auto insurance mandates.
Chubb Limited
- Faces complex multinational regulatory frameworks and compliance risks.
5. Supply Chain & Operations
The Progressive Corporation
- Operates through independent agents and digital channels; reliant on efficient claims handling.
Chubb Limited
- Global operations require robust risk management across diverse markets and products.
6. ESG & Climate Transition
The Progressive Corporation
- Exposure to climate risks via property and auto lines; increasing focus on sustainable underwriting.
Chubb Limited
- Strong emphasis on ESG; specialty lines include environmental and catastrophe risk coverage.
7. Geopolitical Exposure
The Progressive Corporation
- Primarily U.S. market limits geopolitical risk but exposes to domestic policy shifts.
Chubb Limited
- Swiss-based with global operations; greater exposure to geopolitical volatility and currency fluctuations.
Which company shows a better risk-adjusted profile?
The Progressive Corporation’s strongest risk is regulatory shifts in the U.S. auto insurance market. Chubb Limited faces significant geopolitical risk due to its global footprint. Progressive’s low beta and no debt provide a more stable risk-adjusted profile. Chubb’s Altman Z-score in the distress zone raises caution despite diversification. Progressive’s recent high interest coverage and favorable debt metrics justify a more confident stance.
Final Verdict: Which stock to choose?
The Progressive Corporation’s superpower lies in its robust value creation, with a strong and growing ROIC that outpaces its cost of capital. Its aggressive growth is supported by impressive income statement momentum. A point of vigilance remains its stretched balance sheet ratios, which may challenge liquidity during stress periods. It suits investors seeking high-growth, value-creating opportunities with tolerance for financial leverage.
Chubb Limited offers a formidable strategic moat through exceptional capital efficiency and recurring revenue stability. Despite a declining ROIC trend, it maintains solid profitability and a safer financial profile relative to Progressive. Chubb fits well with portfolios emphasizing GARP (Growth at a Reasonable Price) strategies, where steady returns and risk management are key.
If you prioritize dynamic growth and value creation with a willingness to accept higher financial leverage, Progressive outshines as a compelling choice due to its expanding profitability. However, if you seek better stability and a durable moat with more conservative financial risk, Chubb offers a superior risk-adjusted profile, albeit with a premium valuation. Both present analytical scenarios tailored to distinct investor profiles.
Disclaimer: Investment carries a risk of loss of initial capital. The past performance is not a reliable indicator of future results. Be sure to understand risks before making an investment decision.
Go Further
I encourage you to read the complete analyses of The Progressive Corporation and Chubb Limited to enhance your investment decisions: