Home > Comparison > Financial Services > CB vs ALL
The strategic rivalry between Chubb Limited and The Allstate Corporation shapes the competitive landscape of the Property & Casualty insurance industry. Chubb operates as a global reinsurer and insurer with a diversified commercial and personal lines portfolio, while Allstate focuses on a broad U.S. and Canadian personal and commercial insurance platform with integrated protection services. This analysis evaluates their contrasting operational models to identify which company offers superior risk-adjusted returns for a diversified portfolio in 2026.

Table of contents
Companies Overview
Chubb Limited and The Allstate Corporation stand as two heavyweight insurers shaping the North American property and casualty market.
Chubb Limited: Global Specialty Insurance Leader
Chubb Limited commands a diverse portfolio in specialty and commercial P&C insurance worldwide. Its core revenue derives from underwriting risks across commercial property, casualty, marine, cyber, and life insurance lines. In 2026, Chubb sharpened its focus on expanding reinsurance and high-net-worth personal insurance, reinforcing its strengths in niche markets with complex risk profiles.
The Allstate Corporation: Broad U.S. Personal Lines Powerhouse
The Allstate Corporation dominates U.S. personal lines insurance, including private auto and homeowners coverage. Its revenue engine hinges on a broad product mix spanning personal and commercial lines plus ancillary services like roadside assistance and identity protection. In 2026, Allstate emphasized technology-driven consumer engagement and diversified protection services to deepen market penetration in North America.
Strategic Collision: Similarities & Divergences
Both companies thrive in property and casualty insurance, but Chubb targets specialized risks globally while Allstate champions mass-market personal lines in North America. Their primary battleground is the U.S. insurance market, where Allstate’s broad consumer reach meets Chubb’s tailored high-value offerings. Investors face distinct profiles: Chubb offers global specialty exposure; Allstate delivers scale and innovation in domestic personal insurance.
Income Statement Comparison
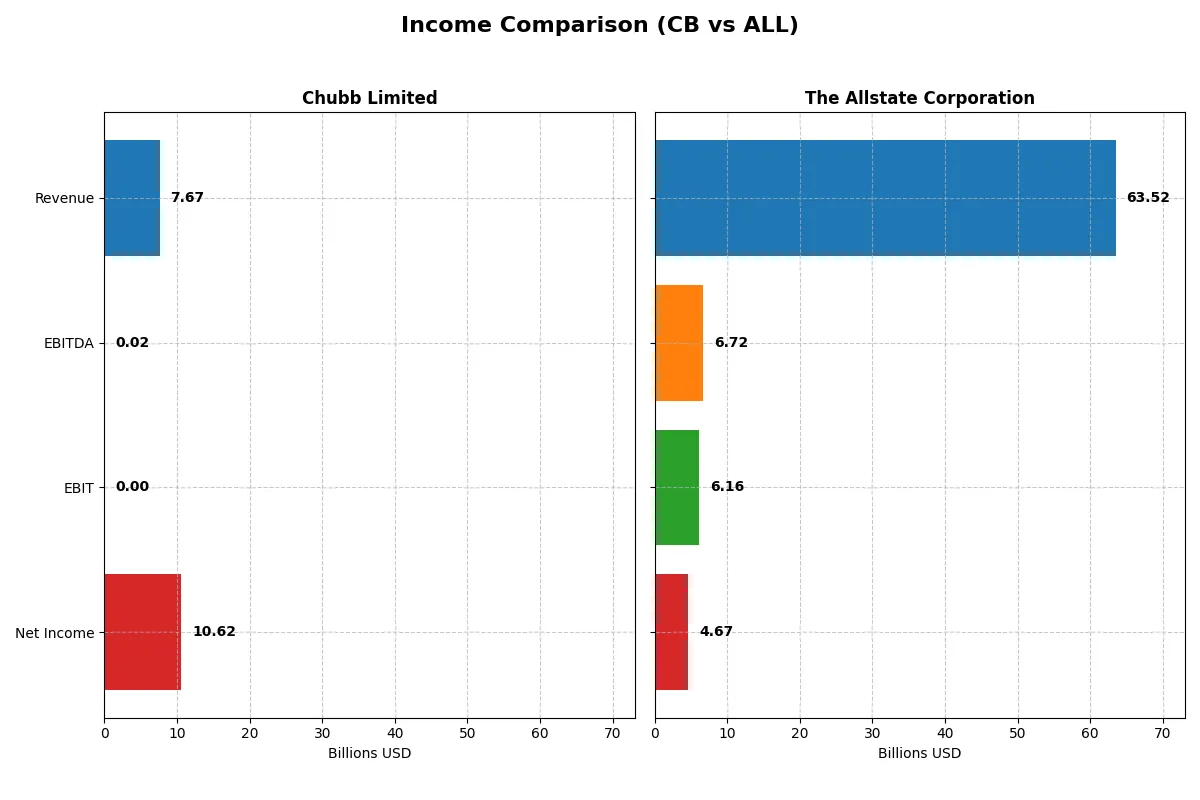
The following data dissects the core profitability and scalability of both corporate engines to reveal who dominates the bottom line:
| Metric | Chubb Limited (CB) | The Allstate Corporation (ALL) |
|---|---|---|
| Revenue | 7.67B | 63.52B |
| Cost of Revenue | 0 | 49.02B |
| Operating Expenses | 0 | 8.74B |
| Gross Profit | 0 | 14.50B |
| EBITDA | 24.79M | 6.72B |
| EBIT | 0 | 6.16B |
| Interest Expense | 764M | 400M |
| Net Income | 10.62B | 4.67B |
| EPS | 26.46 | 17.22 |
| Fiscal Year | 2025 | 2024 |
Income Statement Analysis: The Bottom-Line Duel
This income statement comparison reveals which company operates with greater efficiency and delivers stronger profitability amid market pressures.
Chubb Limited Analysis
Chubb’s revenue soared from 40.8B in 2021 to a peak of 56.2B in 2024, then sharply dropped to 7.7B in 2025. Net income climbed steadily, reaching 10.6B in 2025, thanks to an exceptionally high net margin of 138.6%. Despite a severe revenue plunge last year, Chubb maintained impressive profitability, highlighting strong cost control and bottom-line resilience.
The Allstate Corporation Analysis
Allstate’s revenue rose consistently from 41.7B in 2020 to 63.5B in 2024, with gross margins stable around 22.8%. Net income, however, displayed volatility: heavily negative in 2022 and 2023 before rebounding to 4.7B in 2024. The company’s margin expansion and sharp earnings recovery in 2024 indicate improving operational efficiency and momentum after previous losses.
Margin Dominance vs. Revenue Growth Resilience
Chubb excels in net margin and profitability despite its recent revenue collapse, while Allstate shows stronger top-line growth and margin recovery momentum. Chubb’s exceptional net income marks it the clear fundamental winner. Investors seeking robust profit generation should favor Chubb’s profile over Allstate’s cyclical earnings trajectory.
Financial Ratios Comparison
These vital ratios act as a diagnostic tool to expose the underlying fiscal health, valuation premiums, and capital efficiency of the companies compared below:
| Ratios | Chubb Limited (CB) | The Allstate Corporation (ALL) |
|---|---|---|
| ROE | 14.5% (2024) | 21.8% (2024) |
| ROIC | 12.1% (2024) | 4.1% (2024) |
| P/E | 12.2 (2024) | 10.9 (2024) |
| P/B | 1.76 (2024) | 2.38 (2024) |
| Current Ratio | N/A | N/A |
| Quick Ratio | N/A | N/A |
| D/E | 0.24 (2024) | 0.38 (2024) |
| Debt-to-Assets | 6.2% (2024) | 7.2% (2024) |
| Interest Coverage | 15.5 (2024) | 14.4 (2024) |
| Asset Turnover | 0.23 (2024) | 0.57 (2024) |
| Fixed Asset Turnover | N/A | 94.9 (2024) |
| Payout ratio | 15.5% (2024) | 23.1% (2024) |
| Dividend yield | 1.27% (2024) | 2.12% (2024) |
| Fiscal Year | 2024 | 2024 |
Efficiency & Valuation Duel: The Vital Signs
Financial ratios serve as a company’s DNA, exposing hidden risks and operational strengths that raw numbers alone cannot reveal.
Chubb Limited
Chubb shows strong net margin and a favorable P/E of 11.8, indicating reasonable valuation despite zero reported ROE and ROIC data. Its dividend yield at 1.22% is neutral, suggesting modest shareholder returns. However, several liquidity and efficiency ratios are unfavorable, hinting at operational challenges.
The Allstate Corporation
Allstate delivers a robust ROE of 21.77% and a favorable P/E of 10.92, signaling efficient profitability and attractive valuation. The dividend yield of 2.12% favors income investors, supported by solid interest coverage and manageable debt levels. Some ratios remain neutral, reflecting balanced but cautious operational efficiency.
Balanced Profitability vs. Modest Yield
Allstate offers a better blend of profitability and dividend yield, with a more favorable ratio profile than Chubb. Chubb’s valuation is reasonable but faces operational and liquidity headwinds. Allstate suits investors seeking growth and income, while Chubb’s profile appeals to those accepting operational risks for potential value.
Which one offers the Superior Shareholder Reward?
I compare Chubb Limited (CB) and The Allstate Corporation (ALL) by their dividend yields, payout ratios, and buyback intensity. CB yields ~1.3% with a payout ratio near 15%, signaling a moderate, well-covered dividend. ALL offers a higher yield near 2.1% but with a variable payout ratio around 23%, reflecting less consistency. CB’s buyback activity appears steady, supporting shareholder returns sustainably. ALL’s capital allocation weighs more on dividends, with weaker buyback evidence, raising sustainability concerns. I conclude CB delivers a superior total return profile in 2026, balancing yield, buybacks, and coverage prudently.
Comparative Score Analysis: The Strategic Profile
The radar chart reveals the fundamental DNA and trade-offs of both firms, highlighting their financial strengths and valuation nuances:
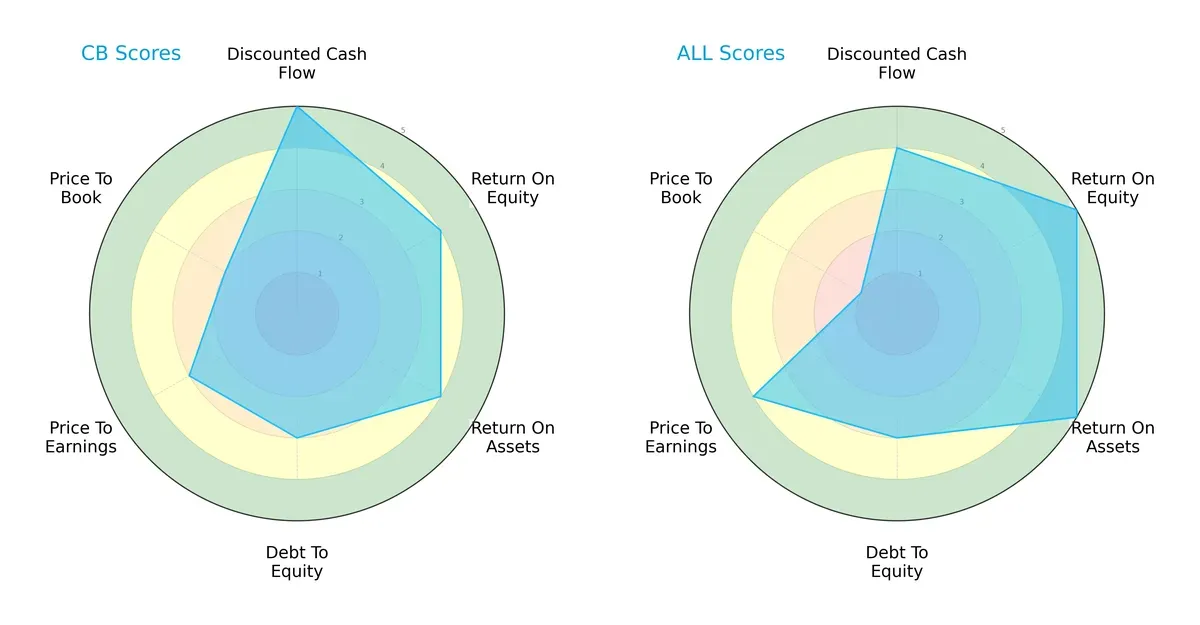
Chubb Limited (CB) excels in discounted cash flow (5) and maintains balanced ROE (4) and ROA (4) scores, signaling solid operational efficiency. The Allstate Corporation (ALL) leads in profitability with top ROE (5) and ROA (5) scores, but its price-to-book valuation (1) signals potential overvaluation concerns. Both share moderate debt-to-equity risk (3), yet CB shows a more balanced valuation profile, while ALL relies heavily on operational profitability.
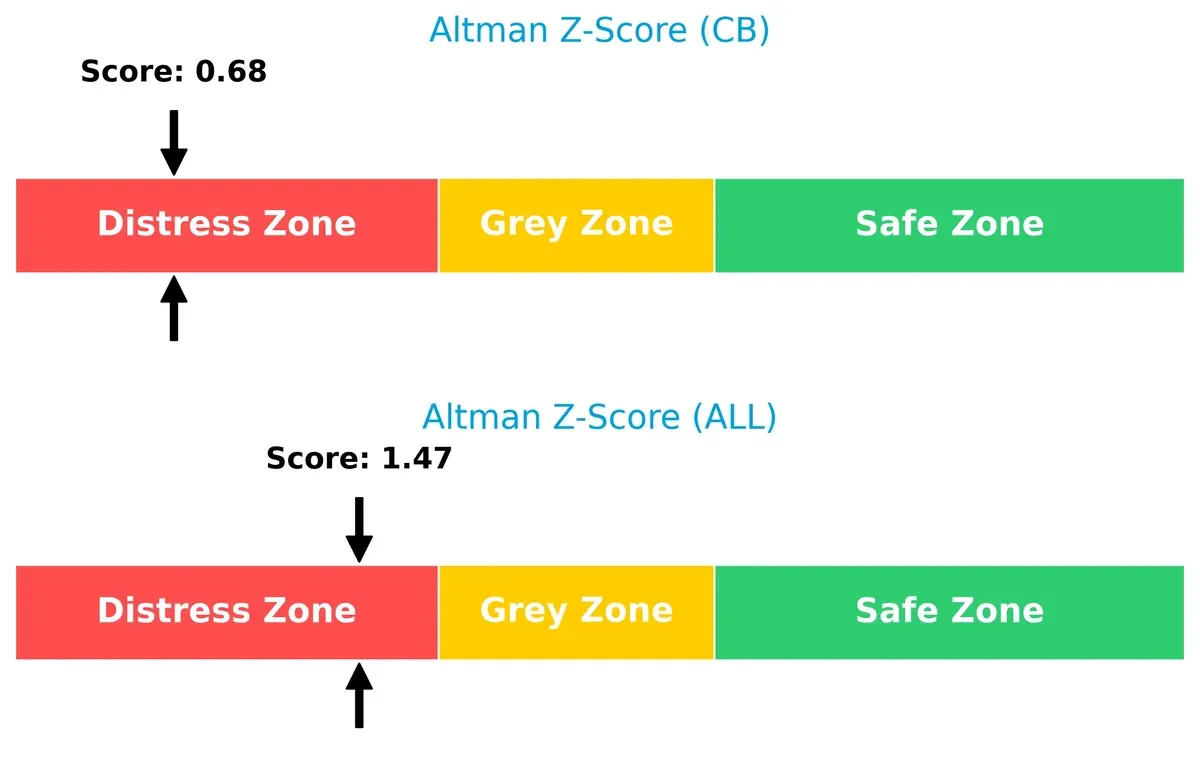
Bankruptcy Risk: Solvency Showdown
The Altman Z-Score difference signals elevated bankruptcy risk for both, but Allstate’s higher 1.47 versus Chubb’s 0.68 suggests slightly better resilience, though both remain in the distress zone:
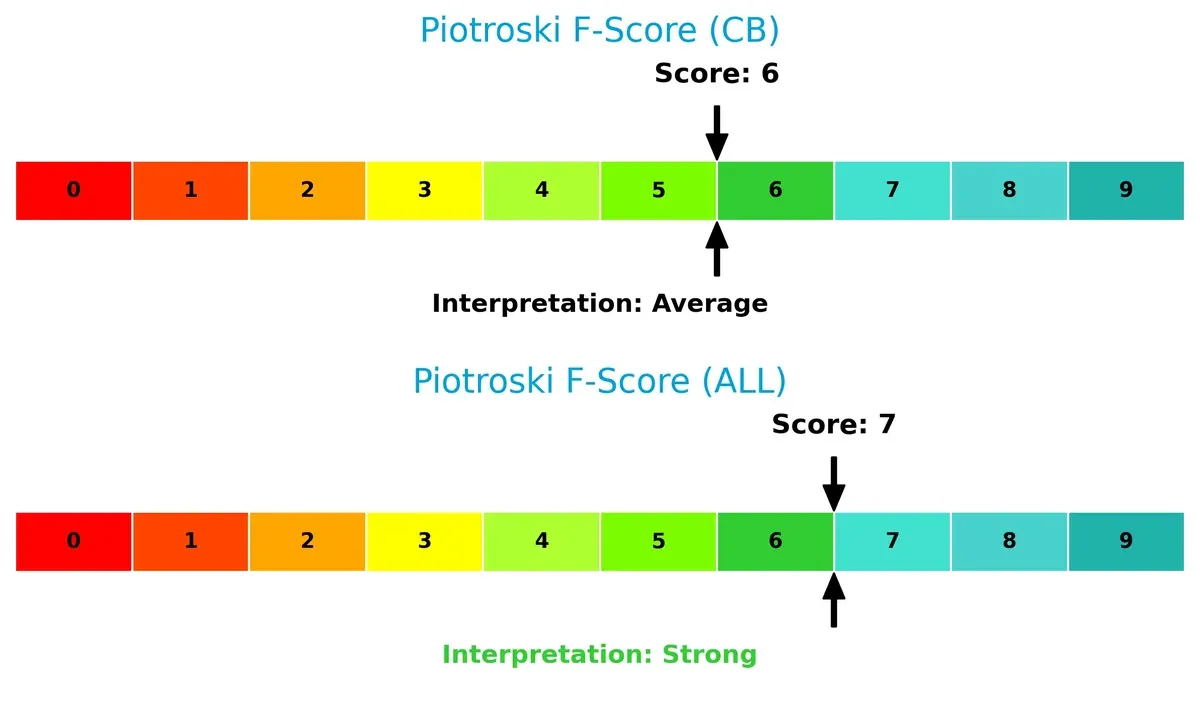
Financial Health: Quality of Operations
Allstate’s Piotroski F-Score of 7 indicates stronger financial health compared to Chubb’s 6, reflecting better internal profitability and efficiency signals, though neither shows critical red flags:
How are the two companies positioned?
This section dissects the operational DNA of CB and ALL by comparing their revenue distribution and internal dynamics. The goal is to confront their economic moats to pinpoint which business model offers the most resilient competitive advantage today.
Revenue Segmentation: The Strategic Mix
This visual comparison dissects how Chubb Limited and The Allstate Corporation diversify their income streams and where their primary sector bets lie:
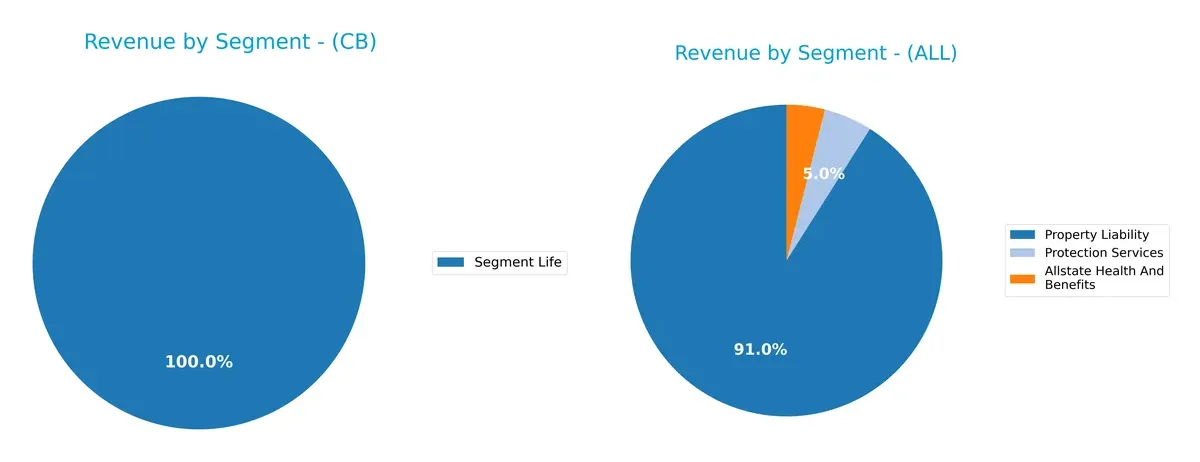
Chubb anchors its revenue primarily in Property and Casualty Insurance, with $13.7B in 2014, versus $6.7B in Life segment by 2024. Allstate dwarfs this with a dominant $58.3B in Property Liability in 2024 but balances with $2.5B in Health and Benefits plus $3.2B in Protection Services. Allstate’s broader segmentation suggests lower concentration risk and ecosystem lock-in, while Chubb’s focus signals infrastructure dominance but higher exposure to insurance cycles.
Strengths and Weaknesses Comparison
This table compares the strengths and weaknesses of Chubb Limited and The Allstate Corporation:
Chubb Limited Strengths
- Favorable net margin at 138.56%
- Attractive P/E ratio of 11.8
- Low debt-to-assets ratio and strong debt equity profile
- Significant revenue from Property and Casualty segment
- Solid U.S. market presence with over 10B USD revenue
The Allstate Corporation Strengths
- Favorable ROE at 21.77% indicates efficient equity use
- Favorable WACC at 4.7% supports cost-effective capital
- High interest coverage ratio of 15.4
- Diverse revenue streams including Property Liability and Protection Services
- Strong U.S. market dominance with 54B USD revenue
Chubb Limited Weaknesses
- Unfavorable ROE and ROIC at 0% raise profitability concerns
- Unavailable WACC limits full capital cost analysis
- Low liquidity ratios (current and quick ratios)
- Unfavorable asset and fixed asset turnover
- Interest coverage at 0 indicates financial risk
- Slightly unfavorable global ratio profile
The Allstate Corporation Weaknesses
- ROIC at 4.12% is unfavorable compared to WACC
- Neutral net margin at 7.35% limits profitability strength
- Neutral PB ratio at 2.38 suggests valuation caution
- Current and quick ratios are unfavorable
- Asset turnover is neutral, showing moderate efficiency
Both companies show strengths in market presence and specific profitability measures, yet each faces distinct operational and financial challenges. Chubb’s strong margin contrasts with weak return metrics, while Allstate balances solid equity returns against modest operating profitability, shaping divergent strategic priorities.
The Moat Duel: Analyzing Competitive Defensibility
A structural moat alone shields long-term profits from relentless competitive erosion. Let’s examine the core moats at play here:
Chubb Limited: Intangible Asset Fortress
Chubb’s moat stems from brand reputation and underwriting expertise, reflected in a strong net margin spike despite revenue volatility. However, declining ROIC signals rising pressure on capital efficiency in 2026.
The Allstate Corporation: Cost and Scale Leverage
Allstate leverages scale and cost advantages, showing solid gross margin and rapid revenue growth. Yet, its ROIC sits below WACC, indicating value erosion and a need for strategic recalibration moving forward.
Verdict: Intangible Reputation vs. Scale Efficiency
Chubb’s intangible asset moat appears deeper despite recent ROIC declines, while Allstate’s cost advantage currently fails to generate economic profit. Chubb stands better poised to defend market share long term.
Which stock offers better returns?
Over the past year, both stocks rose significantly, with notable price acceleration in Chubb Limited and a recent downturn in The Allstate Corporation.
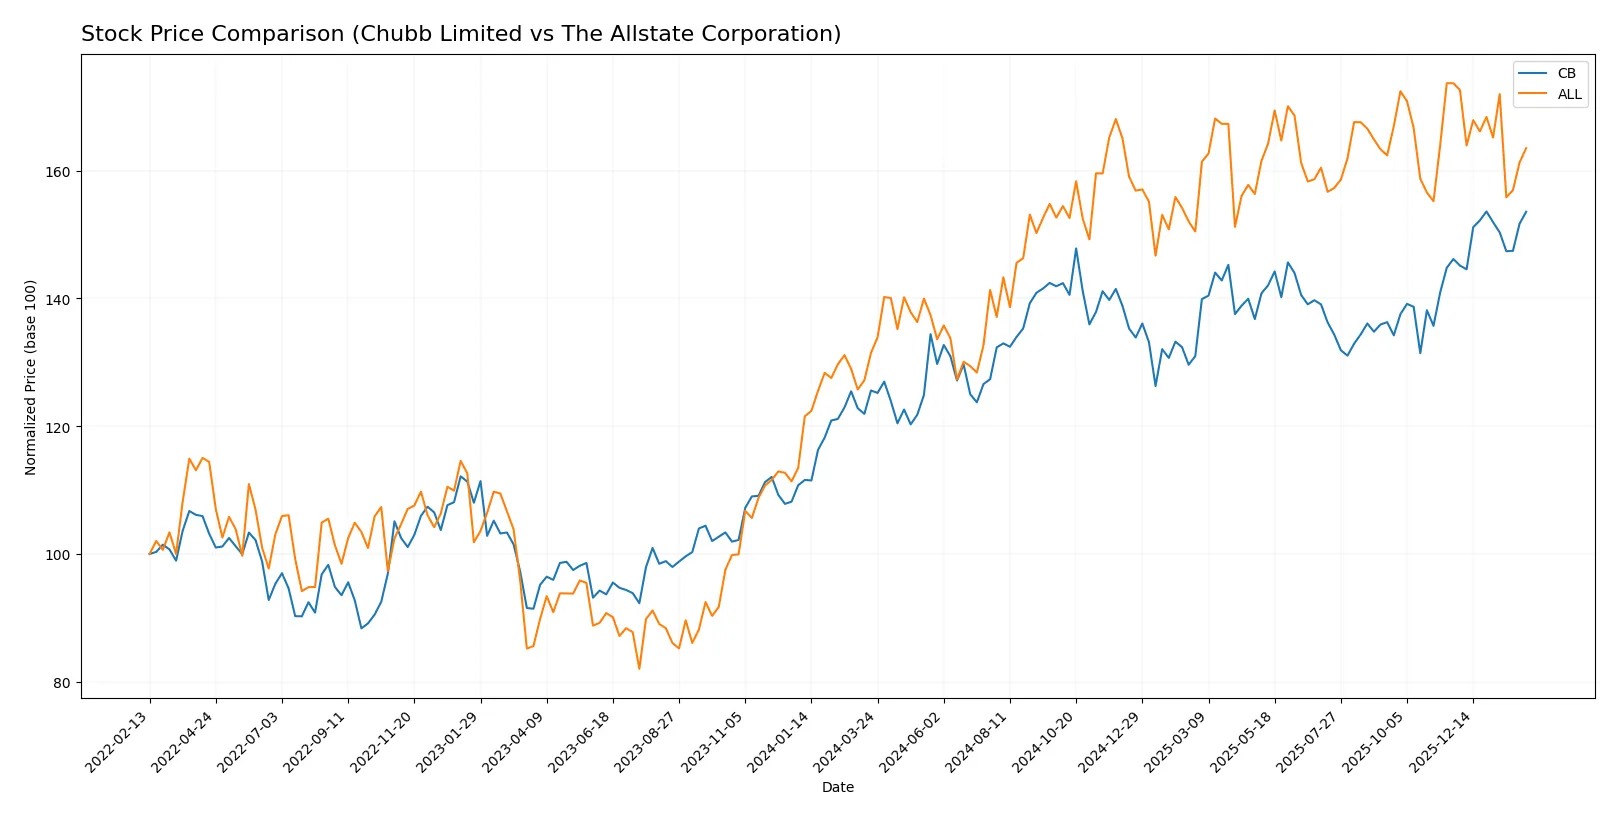
Trend Comparison
Chubb Limited’s stock gained 22.28% over the past 12 months, showing a bullish trend with accelerating momentum and a high of 313.47. Recent months confirm continued upward slope.
The Allstate Corporation’s stock rose 24.4% over the past year, also bullish but with decelerating gains. The recent trend shows a 5.86% decline and a negative slope, signaling short-term weakness.
Chubb’s accelerating bullish trend contrasts with Allstate’s deceleration and recent decline. Overall, Allstate delivered slightly higher annual returns despite recent setbacks.
Target Prices
Analysts present a confident target price consensus for both Chubb Limited and The Allstate Corporation.
| Company | Target Low | Target High | Consensus |
|---|---|---|---|
| Chubb Limited | 283 | 354 | 324.73 |
| The Allstate Corporation | 215 | 255 | 233.57 |
The consensus targets for Chubb and Allstate suggest upside potential of roughly 3.6% and 15.7%, respectively, compared to their current prices of 313.38 and 201.77 USD. This signals moderate to strong analyst optimism.

Don’t Let Luck Decide Your Entry Point
Optimize your entry points with our advanced ProRealTime indicators. You’ll get efficient buy signals with precise price targets for maximum performance. Start outperforming now!
How do institutions grade them?
Chubb Limited Grades
The following table summarizes recent professional grades for Chubb Limited:
| Grading Company | Action | New Grade | Date |
|---|---|---|---|
| Citizens | Maintain | Market Outperform | 2026-01-16 |
| Cantor Fitzgerald | Maintain | Neutral | 2026-01-14 |
| Wells Fargo | Maintain | Equal Weight | 2026-01-13 |
| Goldman Sachs | Upgrade | Buy | 2026-01-08 |
| Barclays | Maintain | Equal Weight | 2026-01-08 |
| Keefe, Bruyette & Woods | Maintain | Outperform | 2026-01-06 |
| Morgan Stanley | Maintain | Equal Weight | 2025-11-17 |
| UBS | Maintain | Neutral | 2025-10-27 |
| Wells Fargo | Maintain | Equal Weight | 2025-10-23 |
| Keefe, Bruyette & Woods | Maintain | Outperform | 2025-10-23 |
The Allstate Corporation Grades
Here is a summary of recent institutional grades for The Allstate Corporation:
| Grading Company | Action | New Grade | Date |
|---|---|---|---|
| Wells Fargo | Maintain | Equal Weight | 2026-01-13 |
| TD Cowen | Downgrade | Hold | 2026-01-12 |
| Keefe, Bruyette & Woods | Maintain | Outperform | 2026-01-06 |
| William Blair | Downgrade | Market Perform | 2025-12-18 |
| Morgan Stanley | Downgrade | Equal Weight | 2025-12-16 |
| Roth Capital | Maintain | Buy | 2025-11-26 |
| Keefe, Bruyette & Woods | Maintain | Outperform | 2025-11-11 |
| UBS | Maintain | Buy | 2025-11-10 |
| BMO Capital | Maintain | Outperform | 2025-11-07 |
| Wells Fargo | Maintain | Equal Weight | 2025-11-07 |
Which company has the best grades?
Chubb Limited generally receives stable or positive grades, including upgrades to Buy and Outperform. The Allstate Corporation shows several downgrades and more mixed ratings. This suggests Chubb holds a more favorable institutional view, potentially supporting confidence among investors.
Risks specific to each company
The following categories identify the critical pressure points and systemic threats facing both firms in the 2026 market environment:
1. Market & Competition
Chubb Limited
- Operates globally with diverse insurance products, facing intense global competition and evolving risk profiles.
The Allstate Corporation
- Primarily US and Canada focused, competing heavily in personal and commercial lines with strong brand recognition.
2. Capital Structure & Debt
Chubb Limited
- Favorable debt metrics but weak interest coverage pose refinancing risks if rates rise.
The Allstate Corporation
- Maintains moderate leverage with strong interest coverage, signaling solid financial stability.
3. Stock Volatility
Chubb Limited
- Beta at 0.49 indicates moderate sensitivity to market swings, providing relative stability.
The Allstate Corporation
- Lower beta of 0.24 suggests less volatility, appealing for risk-averse investors.
4. Regulatory & Legal
Chubb Limited
- Global footprint exposes it to complex regulatory regimes and compliance costs.
The Allstate Corporation
- US-centric operations face regulatory scrutiny but benefit from a more predictable legal environment.
5. Supply Chain & Operations
Chubb Limited
- Diverse underwriting and reinsurance exposures require robust operational risk management.
The Allstate Corporation
- Relies on multiple distribution channels; operational disruptions could impact sales and claims.
6. ESG & Climate Transition
Chubb Limited
- Exposure to climate-related claims necessitates proactive ESG integration in underwriting.
The Allstate Corporation
- Faces pressure to enhance ESG disclosures and mitigate climate risk in property insurance.
7. Geopolitical Exposure
Chubb Limited
- Significant international exposure increases sensitivity to geopolitical tensions and currency fluctuations.
The Allstate Corporation
- Concentrated North American operations limit geopolitical risk but increase regional dependency.
Which company shows a better risk-adjusted profile?
The Allstate Corporation’s strongest risk is operational complexity from multi-channel distribution, while Chubb Limited’s key risk is financial distress indicated by poor interest coverage and Altman Z-score. Despite Chubb’s global scale, Allstate’s stronger leverage management and higher Piotroski score suggest a superior risk-adjusted profile. Notably, Chubb’s Altman Z-score in the distress zone highlights an urgent need for financial stabilization, making Allstate the more prudent choice for risk-conscious investors.
Final Verdict: Which stock to choose?
Chubb Limited’s superpower lies in its robust earnings quality and strong free cash flow generation, marking it as a cash machine in the insurance sector. However, its declining return on invested capital and working capital concerns are points of vigilance. It suits portfolios aiming for aggressive growth with tolerance for operational risks.
The Allstate Corporation commands a strategic moat through its superior return on equity and solid interest coverage, reflecting disciplined capital allocation. Allstate’s financial stability and favorable debt metrics offer better safety compared to Chubb. It fits portfolios focused on GARP—growth at a reasonable price—with a tilt toward stability.
If you prioritize cash flow dominance and are comfortable navigating some operational headwinds, Chubb outshines with its efficiency and growth potential. However, if you seek better financial stability and a proven track record of capital discipline, Allstate offers superior safety and a steadier growth profile. Both present analytical scenarios for distinct investor avatars balancing growth and risk differently.
Disclaimer: Investment carries a risk of loss of initial capital. The past performance is not a reliable indicator of future results. Be sure to understand risks before making an investment decision.
Go Further
I encourage you to read the complete analyses of Chubb Limited and The Allstate Corporation to enhance your investment decisions: