Home > Comparison > Financial Services > CB vs L
The strategic rivalry between Chubb Limited and Loews Corporation shapes the property and casualty insurance landscape. Chubb operates as a global insurance and reinsurance powerhouse with diversified specialty lines. Loews blends insurance with diversified industrial and energy assets, offering a unique conglomerate model. This analysis pits sector leadership against diversified growth, aiming to identify which trajectory delivers superior risk-adjusted returns for a balanced portfolio.

Table of contents
Companies Overview
Chubb Limited and Loews Corporation both anchor the global property and casualty insurance markets with broad exposure and diverse portfolios.
Chubb Limited: Global Insurance Powerhouse
Chubb Limited leads as a global insurer specializing in commercial and personal property and casualty coverage. Its core revenue stems from diverse insurance products, including specialty lines like cyber risk and agricultural insurance. In 2026, Chubb sharpens its focus on expanding reinsurance services and broadening risk management solutions for affluent clients.
Loews Corporation: Diversified Insurance & Energy
Loews Corporation operates in property and casualty insurance, but also diversifies into natural gas pipelines, hotels, and plastics manufacturing. It generates revenue through specialty insurance products and extensive energy infrastructure. Its 2026 strategy emphasizes growth in loss-sensitive insurance programs and expanding its energy pipeline operations in the United States.
Strategic Collision: Similarities & Divergences
Both firms prioritize property and casualty insurance, yet Chubb pursues a global, specialty-driven insurance model, while Loews embraces diversification into energy and manufacturing. Their battleground is risk management innovation within commercial insurance markets. Chubb’s focused underwriting contrasts with Loews’ multi-industry portfolio, creating distinct investment profiles defined by concentration versus diversification.
Income Statement Comparison
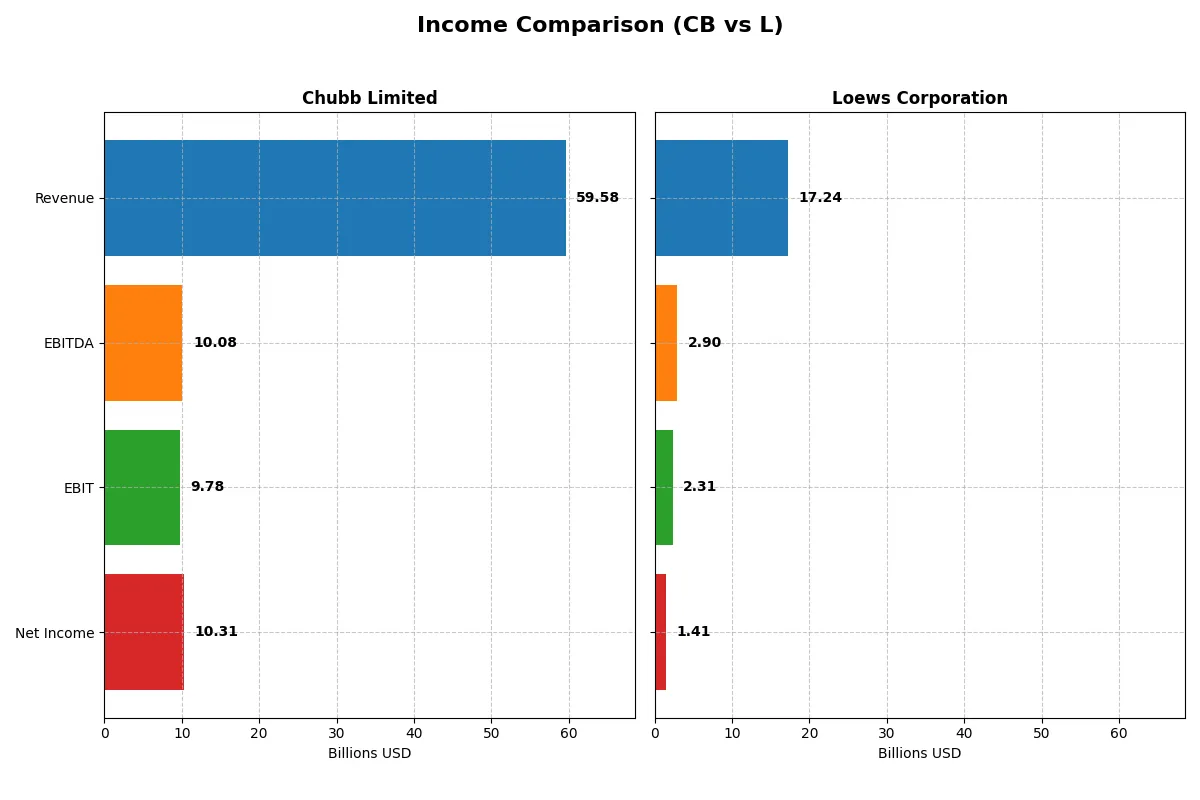
This data dissects core profitability and scalability of both corporate engines to reveal who dominates the bottom line:
| Metric | Chubb Limited (CB) | Loews Corporation (L) |
|---|---|---|
| Revenue | 59.6B | 17.2B |
| Cost of Revenue | 32.0B | 9.5B |
| Operating Expenses | 4.36B | 5.83B |
| Gross Profit | 27.5B | 7.7B |
| EBITDA | 10.1B | 2.9B |
| EBIT | 9.78B | 2.3B |
| Interest Expense | 764M | 441M |
| Net Income | 10.3B | 1.41B |
| EPS | 25.91 | 6.42 |
| Fiscal Year | 2025 | 2024 |
Income Statement Analysis: The Bottom-Line Duel
This income statement comparison reveals which company runs its operations with greater efficiency and stronger profit generation.
Chubb Limited Analysis
Chubb Limited’s revenue climbed steadily from $40.8B in 2021 to $59.6B in 2025, with net income rising from $8.5B to $10.3B. The company maintains robust gross margins around 46%, signaling strong cost control. Despite a slight EBIT decline recently, net margins hold firm near 17.3%, reflecting resilient profitability and efficient expense management.
Loews Corporation Analysis
Loews Corporation grew revenue from $13.7B in 2021 to $17.2B in 2024, with net income fluctuating but surging overall from -$931M in 2020 to $1.4B in 2024. Gross margin stands at a healthy 44.7%, though net margin is lower at 8.2%. EBIT dipped slightly last year, and margins show more volatility, indicating uneven operational momentum.
Margin Strength vs. Growth Trajectory
Chubb delivers stronger net margins and steadier profitability, while Loews exhibits impressive net income growth from a low base but with more margin variability. Chubb’s profile suits investors prioritizing consistent income and operational efficiency. Loews appeals more to those targeting turnaround potential and growth acceleration.
Financial Ratios Comparison
These vital ratios act as a diagnostic tool to expose the underlying fiscal health, valuation premiums, and capital efficiency of the companies compared below:
| Ratios | Chubb Limited (CB) | Loews Corporation (L) |
|---|---|---|
| ROE | 14.0% | 8.3% |
| ROIC | 71.4% | 298.8% |
| P/E | 12.0 | 13.2 |
| P/B | 1.68 | 1.09 |
| Current Ratio | N/A | N/A |
| Quick Ratio | N/A | N/A |
| D/E | 0.24 | 0.52 |
| Debt-to-Assets | 6.2% | 10.9% |
| Interest Coverage | 30.3 | 4.2 |
| Asset Turnover | 0.22 | 0.21 |
| Fixed Asset Turnover | N/A | 1.61 |
| Payout Ratio | 14.7% | 3.9% |
| Dividend Yield | 1.22% | 0.29% |
| Fiscal Year | 2025 | 2024 |
Efficiency & Valuation Duel: The Vital Signs
Financial ratios serve as a company’s DNA, unveiling hidden risks and operational strengths that shape investment decisions.
Chubb Limited
Chubb shows a solid ROE at 14% and a strong net margin of 17.3%, reflecting operational efficiency. Its P/E of 12.0 suggests a reasonably priced stock, supported by a favorable ROIC of 71.36% versus WACC at 6.06%. Dividend yield at 1.22% indicates steady shareholder returns with balanced capital allocation.
Loews Corporation
Loews posts a lower ROE of 8.29% and a net margin of 8.2%, signaling moderate profitability. The P/E of 13.19 is slightly higher but still favorable, while an exceptionally high ROIC of 29,880% versus WACC of 5.79% points to effective capital use. Dividend yield is weak at 0.29%, hinting at limited cash returned to shareholders.
Robust Profitability Meets Valuation Discipline
Chubb presents a better profitability and valuation balance, with consistent shareholder returns and strong capital efficiency. Loews, despite an eye-catching ROIC, shows weaker margins and shareholder yield. Investors prioritizing steady earnings and dividends may prefer Chubb’s profile, while those focused on capital efficiency might consider Loews’ potential.
Which one offers the Superior Shareholder Reward?
I see Chubb Limited (CB) offers a 1.22% dividend yield with a 14.7% payout ratio, well-covered by stable free cash flow. Its consistent 3.8B dividend payments paired with moderate buybacks suggest balanced distributions. Loews Corporation (L) yields just 0.29% with a 3.9% payout ratio, favoring reinvestment and modest buybacks. CB’s higher yield and sustainable payout, combined with steady buybacks, provide superior total shareholder return potential in 2026.
Comparative Score Analysis: The Strategic Profile
The radar chart reveals the fundamental DNA and trade-offs of both firms, highlighting their strategic strengths and vulnerabilities:
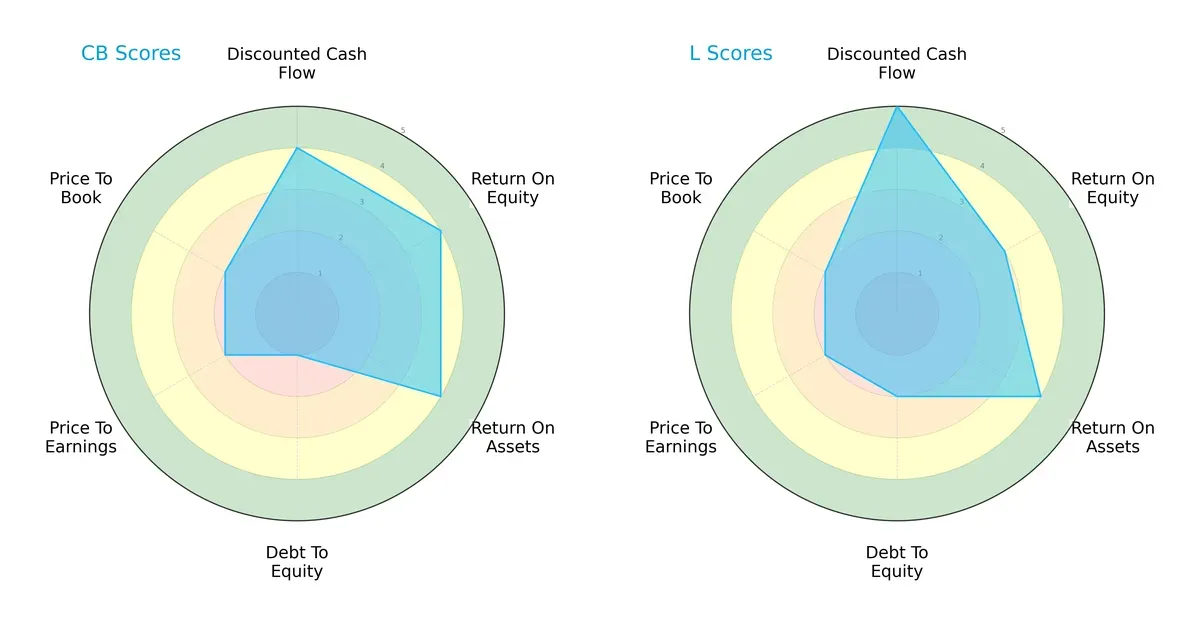
Chubb Limited leans on operational efficiency with strong ROE and ROA scores (4 each) but suffers from a weak debt profile (score 1). Loews Corporation shows superior valuation discipline with a top DCF score (5) and a slightly better debt score (2), yet its profitability metrics are moderate. Loews offers a more balanced valuation and risk profile, while Chubb relies heavily on operational excellence despite financial leverage concerns.
Bankruptcy Risk: Solvency Showdown
The Altman Z-Scores place both firms in the distress zone, signaling elevated bankruptcy risk in this cycle:
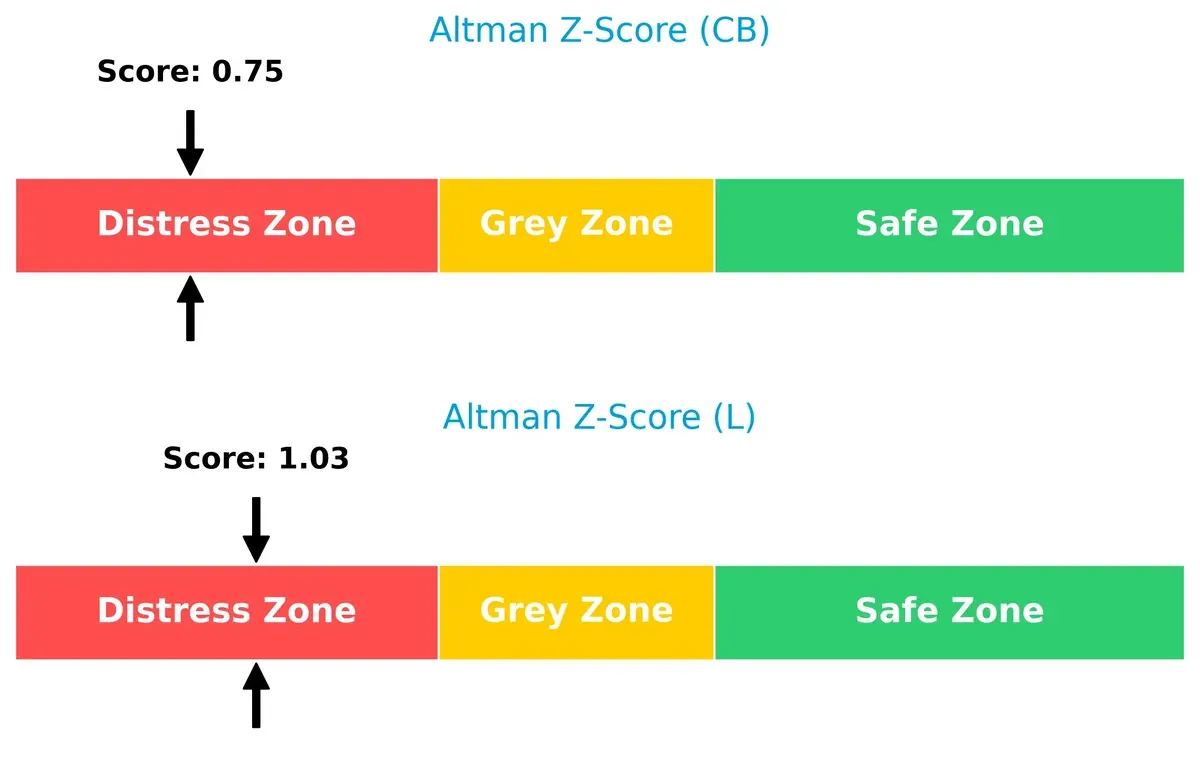
Chubb’s score at 0.75 is notably weaker than Loews’ 1.03, indicating a higher probability of financial distress. Both companies face solvency challenges, but Loews holds a marginally safer position, underscoring the need for cautious exposure.
Financial Health: Quality of Operations
Piotroski F-Scores highlight Loews Corporation’s stronger internal financial health compared to Chubb Limited:
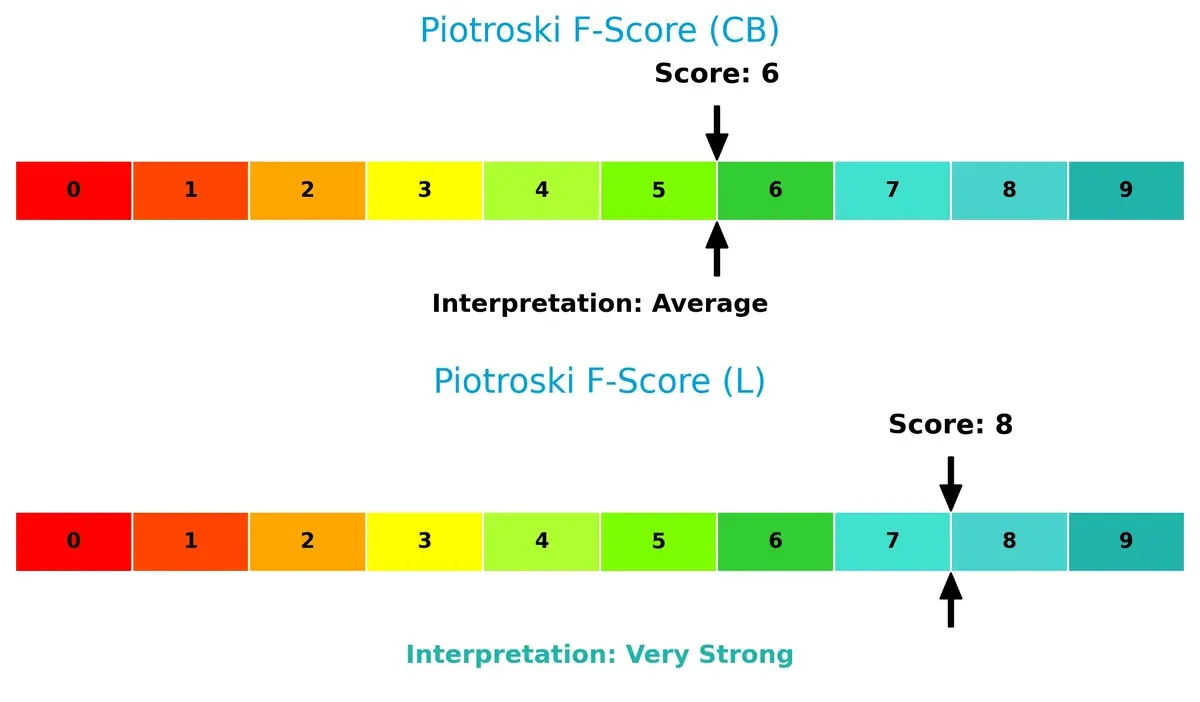
Loews scores an impressive 8, signaling very strong fundamentals and efficient capital allocation. Chubb’s 6, while average, suggests some red flags in profitability or liquidity metrics. This disparity stresses Loews’ superior financial resilience amid market pressures.
How are the two companies positioned?
This section dissects CB and L’s operational DNA by comparing revenue distribution across segments and examining internal strengths and weaknesses. The goal is to confront their economic moats and identify which model offers the most resilient, sustainable advantage today.
Revenue Segmentation: The Strategic Mix
This visual comparison dissects how Chubb Limited and Loews Corporation diversify their income streams and where their primary sector bets lie:
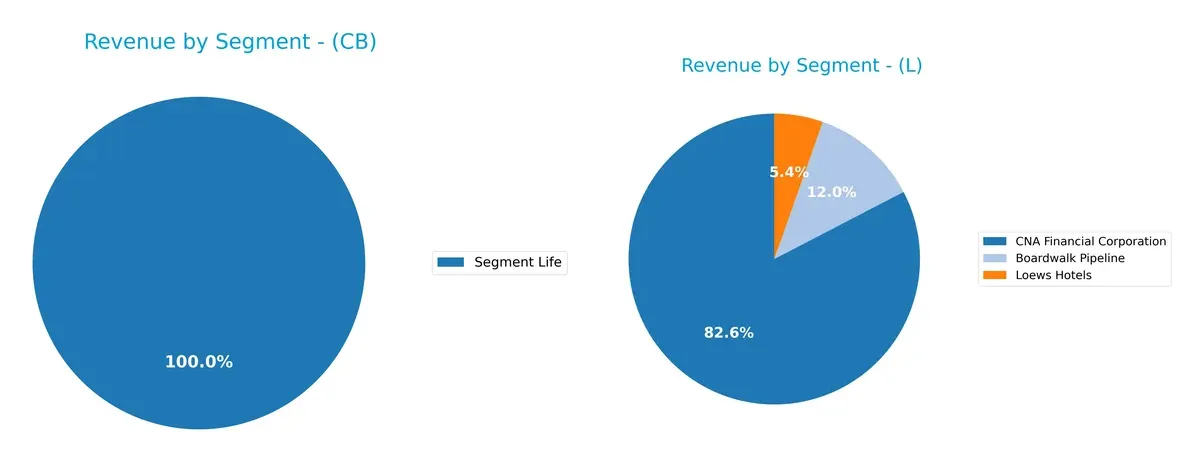
Chubb Limited anchors revenue primarily in its Life segment, generating about 6.75B in 2024, indicating a focused specialization. In contrast, Loews Corporation boasts a more diversified mix with CNA Financial at 14.27B, Boardwalk Pipeline at 2.07B, and Loews Hotels at 933M. Loews’ broad portfolio reduces concentration risk and leverages infrastructure and hospitality, while Chubb’s narrow focus suggests deep moat potential but higher exposure to life insurance cycles.
Strengths and Weaknesses Comparison
This table compares the Strengths and Weaknesses of Chubb Limited and Loews Corporation:
Chubb Limited Strengths
- Higher net margin at 17.3%
- Strong ROIC of 71.36% above WACC
- Favorable PE ratio at 12.0
- Zero debt with strong interest coverage
- Large US revenue base over 10B
- Focused insurance segments with steady revenues
Loews Corporation Strengths
- Extremely high ROIC at 29880%
- Favorable WACC and PE ratios
- Diversified segments including financials, pipelines, and hotels
- Moderate debt with manageable interest coverage
- Positive asset turnover and fixed asset turnover
- Long-term revenue growth across businesses
Chubb Limited Weaknesses
- Unfavorable liquidity ratios at zero current and quick ratio
- Low asset and fixed asset turnover indicating inefficiency
- Neutral ROE at 13.98%
- Neutral PB ratio at 1.68
- Moderate dividend yield at 1.22%
- Heavy US geographic concentration
Loews Corporation Weaknesses
- Unfavorable ROE at 8.29%
- Unfavorable liquidity ratios at zero current and quick ratio
- Low dividend yield at 0.29%
- Higher unfavorable ratio percentage at 35.71%
- Neutral debt-to-equity ratio at 0.52
- Slightly weaker interest coverage compared to CB
Both companies show slightly favorable global ratio evaluations but face liquidity concerns with zero current and quick ratios. Chubb relies heavily on the US market and insurance, while Loews benefits from diversified segments. Profitability and capital efficiency metrics vary notably, reflecting distinct strategic focuses and operational challenges.
The Moat Duel: Analyzing Competitive Defensibility
A structural moat shields long-term profits from relentless competitive pressure. Without it, market forces erode value quickly:
Chubb Limited: Intangible Assets Moat
Chubb leverages brand strength and underwriting expertise, reflected in a solid 17.3% net margin. Declining ROIC warns of margin pressure, but new markets may deepen its moat by 2026.
Loews Corporation: Diversified Asset Moat
Loews boasts a rare blend of insurance and energy pipelines, fueling a soaring ROIC trend and expanding profitability. This diversification broadens its moat beyond Chubb’s focused insurance model.
Insurance Expertise vs. Asset Diversification
Loews commands a wider, growing moat through diversified cash flows and improving ROIC. Chubb’s moat is narrower and facing margin compression, making Loews better positioned to defend market share.
Which stock offers better returns?
The past year showed strong price gains for both stocks, with Chubb Limited accelerating upward and Loews Corporation posting steady, though decelerating, growth.
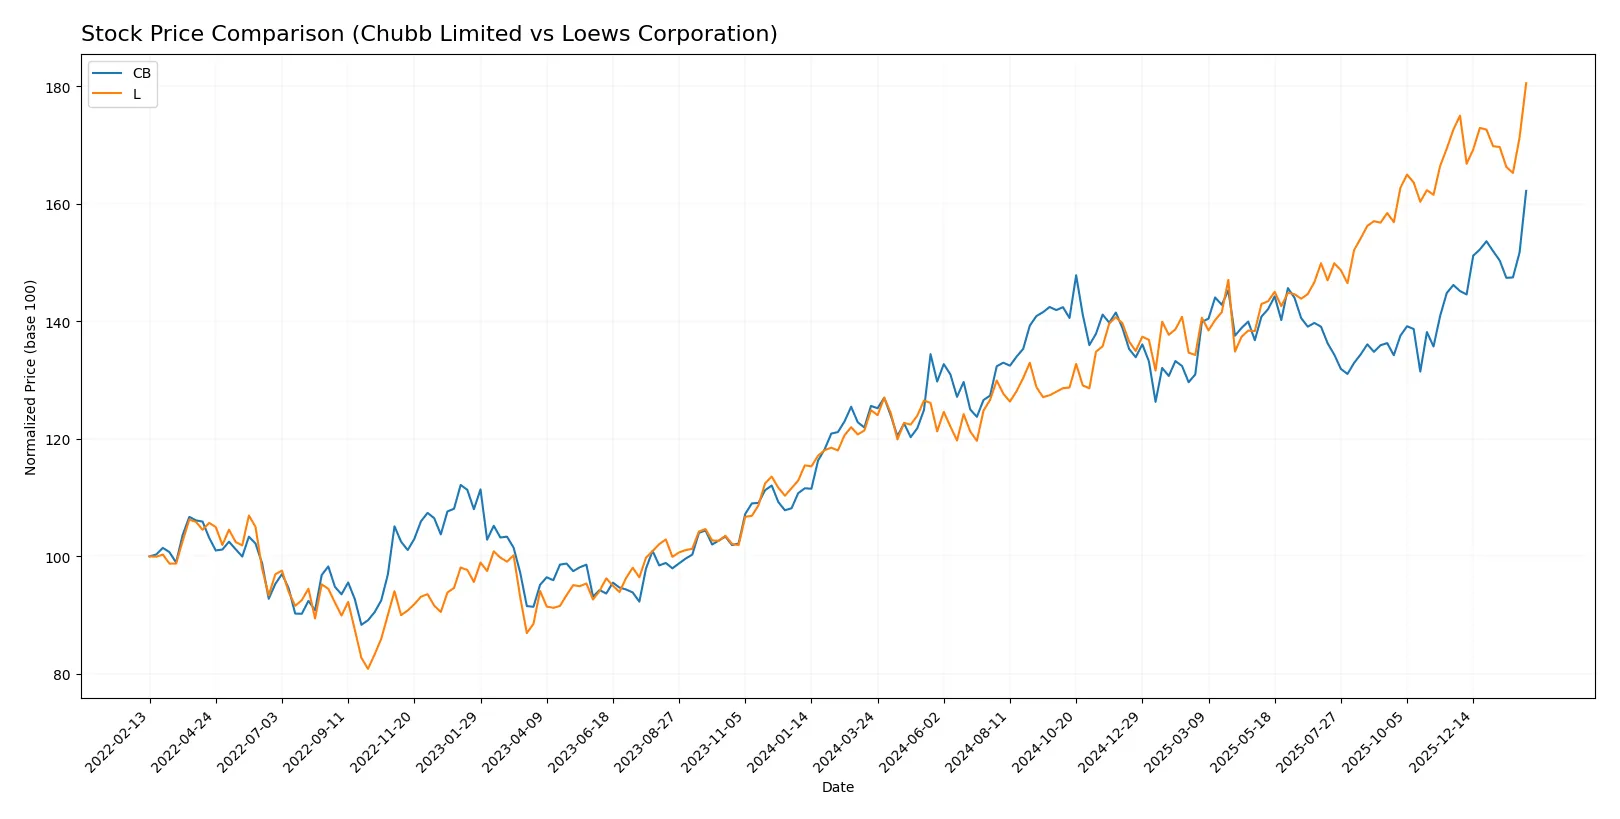
Trend Comparison
Chubb Limited’s stock rose 29.14% over the past year, marking a bullish trend with accelerating momentum and notable volatility at a 16.12% standard deviation. The price ranged between 245.45 and 330.97.
Loews Corporation’s stock gained 44.56% in the same period, showing a bullish trend but with decelerating growth and lower volatility at 9.88%. The price fluctuated from 73.76 to 111.27.
Comparing both, Loews Corporation delivered the highest market performance with stronger overall gains despite slowing momentum, outpacing Chubb Limited’s accelerated but smaller price rise.
Target Prices
Chubb Limited shows a solid target price consensus reflecting moderate upside potential.
| Company | Target Low | Target High | Consensus |
|---|---|---|---|
| Chubb Limited | 283 | 366 | 330.5 |
Analysts expect Chubb’s price to trade near its current level of 331 USD, indicating balanced upside and downside risks. No verified target price data is available for Loews Corporation.

Don’t Let Luck Decide Your Entry Point
Optimize your entry points with our advanced ProRealTime indicators. You’ll get efficient buy signals with precise price targets for maximum performance. Start outperforming now!
How do institutions grade them?
The institutional grades for Chubb Limited and Loews Corporation are summarized below:
Chubb Limited Grades
The following table shows recent institutional grades for Chubb Limited:
| Grading Company | Action | New Grade | Date |
|---|---|---|---|
| Wells Fargo | Maintain | Equal Weight | 2026-02-05 |
| Evercore ISI Group | Maintain | Outperform | 2026-02-04 |
| JP Morgan | Maintain | Neutral | 2026-02-04 |
| Roth Capital | Maintain | Buy | 2026-02-04 |
| Citizens | Maintain | Market Outperform | 2026-02-04 |
| Citizens | Maintain | Market Outperform | 2026-01-16 |
| Cantor Fitzgerald | Maintain | Neutral | 2026-01-14 |
| Wells Fargo | Maintain | Equal Weight | 2026-01-13 |
| Barclays | Maintain | Equal Weight | 2026-01-08 |
| Goldman Sachs | Upgrade | Buy | 2026-01-08 |
Loews Corporation Grades
The following table shows the most recent institutional grades for Loews Corporation:
| Grading Company | Action | New Grade | Date |
|---|---|---|---|
| RBC Capital | Maintain | Outperform | 2025-05-27 |
| Deutsche Bank | Maintain | Hold | 2018-08-01 |
| Deutsche Bank | Maintain | Hold | 2018-07-31 |
| Deutsche Bank | Maintain | Hold | 2015-11-06 |
| Deutsche Bank | Maintain | Hold | 2015-11-05 |
| JP Morgan | Maintain | Hold | 2014-08-08 |
| JP Morgan | Maintain | Hold | 2014-08-07 |
| Deutsche Bank | Downgrade | Hold | 2014-03-24 |
| Deutsche Bank | Downgrade | Hold | 2014-03-23 |
| Deutsche Bank | Maintain | Buy | 2013-09-04 |
Which company has the best grades?
Chubb Limited has consistently received more recent and generally stronger grades, including multiple Buy and Outperform ratings. Loews Corporation’s latest grades are older and mostly Hold, indicating less bullish sentiment. This suggests investors view Chubb more favorably currently.
Risks specific to each company
The following categories identify critical pressure points and systemic threats facing both firms in the 2026 market environment:
1. Market & Competition
Chubb Limited
- Operates globally in P&C insurance with broad product offerings; faces intense competition from large global insurers.
Loews Corporation
- Focuses on U.S. and international P&C specialty insurance; diversified into energy and manufacturing, facing sector-specific competition.
2. Capital Structure & Debt
Chubb Limited
- Very low debt-to-equity and debt-to-assets ratios indicate strong balance sheet and low financial risk.
Loews Corporation
- Moderate debt-to-equity (0.52) and low debt-to-assets (10.9%) suggest manageable leverage but higher financial risk than Chubb.
3. Stock Volatility
Chubb Limited
- Beta of 0.49 signals lower volatility and defensive stock characteristics in market swings.
Loews Corporation
- Beta of 0.61 indicates moderate volatility, exposing investors to higher market risk.
4. Regulatory & Legal
Chubb Limited
- Global operations expose it to complex international regulatory regimes, increasing compliance costs and risks.
Loews Corporation
- Regulatory risk concentrated in U.S. insurance and energy sectors, where evolving rules may impact profitability.
5. Supply Chain & Operations
Chubb Limited
- Primarily service-based with broker distribution; less vulnerable to physical supply chain disruptions.
Loews Corporation
- Diverse operations including pipelines and manufacturing face higher operational risks and supply chain complexity.
6. ESG & Climate Transition
Chubb Limited
- As an insurer, exposed to climate-related underwriting risks but can manage through risk modeling and pricing.
Loews Corporation
- Energy pipeline operations present significant exposure to climate transition risks and regulatory pressures.
7. Geopolitical Exposure
Chubb Limited
- Headquartered in Switzerland with global footprint, facing geopolitical risks in multiple regions.
Loews Corporation
- U.S.-based with international insurance exposure; geopolitical risks more concentrated but present in energy assets abroad.
Which company shows a better risk-adjusted profile?
Chubb’s most impactful risk is global regulatory complexity, balanced by a fortress-like capital structure and low stock volatility. Loews faces significant climate transition risk in its energy business, which elevates operational and regulatory uncertainty. Chubb’s lower leverage and beta create a superior risk-adjusted profile. The disparity in Altman Z-scores—Chubb’s distress zone versus Loews’s slightly higher yet still distress-level score—underscores Chubb’s relatively stronger financial stability despite sector headwinds.
Final Verdict: Which stock to choose?
Chubb Limited’s superpower lies in its robust value creation and consistent cash generation. Its slight decline in profitability and weak liquidity ratios remain points of vigilance. This stock fits well within portfolios aiming for steady income with a taste for moderate risk and long-term value preservation.
Loews Corporation commands a strategic moat through an exceptionally high and growing ROIC, signaling a sustainable competitive advantage. Its conservative balance sheet and strong Piotroski score suggest better financial health relative to Chubb. Loews suits investors looking for growth at a reasonable price with a preference for stability.
If you prioritize durable value creation and income generation, Chubb is the compelling choice due to its solid cash flow and market position. However, if you seek superior capital efficiency and a rising profitability trend, Loews offers better stability and a stronger moat. Both stocks carry risks tied to liquidity concerns and market cycles, requiring prudent portfolio fit.
Disclaimer: Investment carries a risk of loss of initial capital. The past performance is not a reliable indicator of future results. Be sure to understand risks before making an investment decision.
Go Further
I encourage you to read the complete analyses of Chubb Limited and Loews Corporation to enhance your investment decisions: