Home > Comparison > Financial Services > CB vs CINF
The strategic rivalry between Chubb Limited and Cincinnati Financial Corporation defines the current trajectory of the property and casualty insurance sector. Chubb operates as a global, diversified insurer with a broad portfolio spanning commercial, personal, agricultural, and reinsurance lines. Cincinnati Financial focuses on a more concentrated U.S. market niche with targeted commercial and personal insurance products. This analysis will assess which business model presents a superior risk-adjusted return for a diversified portfolio.

Table of contents
Companies Overview
Chubb Limited and Cincinnati Financial Corporation are heavyweight contenders in the global and US insurance markets.
Chubb Limited: Global Property & Casualty Powerhouse
Chubb Limited dominates the global insurance sector with a focus on commercial and personal property and casualty insurance. It generates revenue through diverse lines including workers’ compensation, cyber risk, and specialty reinsurance. In 2026, Chubb emphasizes expanding specialty risk coverage and global reinsurance under its Chubb Tempest Re brand to leverage its broad international footprint.
Cincinnati Financial Corporation: US-Focused Insurance Specialist
Cincinnati Financial Corporation excels in the US property and casualty market with a stronghold in commercial and personal lines insurance. Its revenue stems largely from commercial casualty, property, and personal auto insurance. The company’s 2026 strategy prioritizes growth in excess and surplus lines insurance and life insurance products, supported by its investment portfolio in bonds and preferred stocks.
Strategic Collision: Similarities & Divergences
Both firms capitalize on property and casualty insurance, but Chubb adopts a global, diversified specialty approach while Cincinnati focuses on niche US markets with tailored commercial and personal products. The primary battleground is the commercial insurance segment, where scale and product breadth matter. Chubb’s broader geographic reach contrasts with Cincinnati’s concentrated US investment strategy, resulting in distinct risk profiles and capital allocation priorities.
Income Statement Comparison
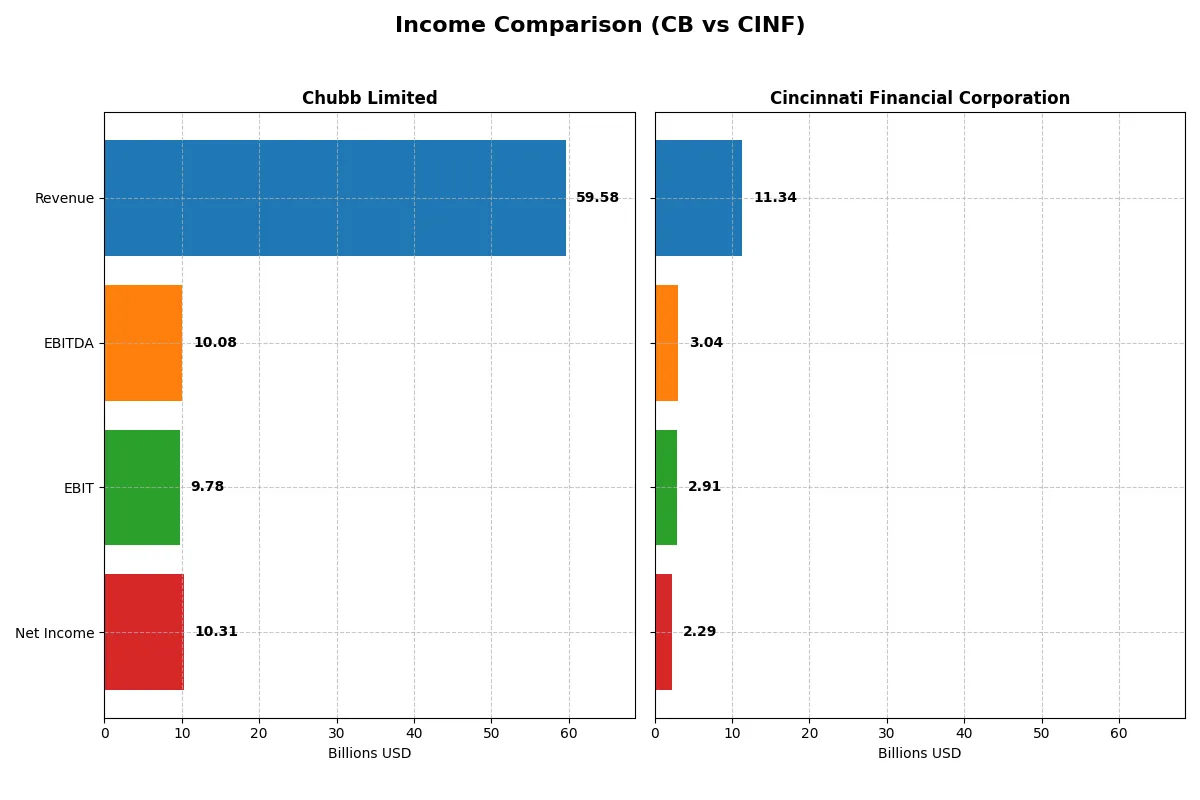
This data dissects the core profitability and scalability of both corporate engines to reveal who dominates the bottom line:
| Metric | Chubb Limited (CB) | Cincinnati Financial Corporation (CINF) |
|---|---|---|
| Revenue | 59.6B | 11.3B |
| Cost of Revenue | 32.0B | 5.7B |
| Operating Expenses | 4.4B | 2.7B |
| Gross Profit | 27.5B | 5.6B |
| EBITDA | 10.1B | 3.0B |
| EBIT | 9.8B | 2.9B |
| Interest Expense | 764M | 53M |
| Net Income | 10.3B | 2.3B |
| EPS | 25.91 | 14.65 |
| Fiscal Year | 2025 | 2024 |
Income Statement Analysis: The Bottom-Line Duel
This income statement comparison reveals how efficiently each company converts sales into profits and manages costs over time.
Chubb Limited Analysis
Chubb’s revenue climbed steadily from $40.8B in 2021 to $59.6B in 2025, reflecting a robust 46% growth over five years. Net income rose from $8.5B to $10.3B, showing disciplined margin control despite mixed EBIT trends. Its gross margin holds strong at 46.2%, and net margin remains healthy at 17.3%, signaling solid profitability momentum in 2025.
Cincinnati Financial Corporation Analysis
Cincinnati Financial’s revenue surged from $7.5B in 2020 to $11.3B in 2024, a 50% increase marked by accelerating growth. Net income nearly doubled from $1.2B to $2.3B, driven by an impressive rise in gross margin to 49.4% and a net margin of 20.2%. EBIT margin expanded to 25.7%, highlighting improved operational efficiency and strong earnings momentum.
Margin Strength vs. Earnings Momentum
Cincinnati Financial outpaces Chubb in margin expansion and net income growth, boasting a cleaner, more favorable earnings trajectory. Chubb delivers larger scale and solid profit levels but shows some EBIT volatility. For investors, Cincinnati’s profile offers sharper margin improvement and EPS growth, appealing to those prioritizing profitability efficiency over sheer revenue size.
Financial Ratios Comparison
These vital ratios act as a diagnostic tool to expose the underlying fiscal health, valuation premiums, and capital efficiency for the companies compared below:
| Ratios | Chubb Limited (CB) | Cincinnati Financial Corporation (CINF) |
|---|---|---|
| ROE | 14.0% (2025) | 16.4% (2024) |
| ROIC | 71.4% (2025) | 91.7% (2024) |
| P/E | 12.0 (2025) | 9.8 (2024) |
| P/B | 1.68 (2025) | 1.61 (2024) |
| Current Ratio | N/A | N/A |
| Quick Ratio | N/A | N/A |
| D/E (Debt-to-Equity) | 0.24 (2024) | 0.06 (2024) |
| Debt-to-Assets | 6.2% (2024) | 2.4% (2024) |
| Interest Coverage | 15.5x (2024) | 53.9x (2024) |
| Asset Turnover | 0.23 (2024) | 0.31 (2024) |
| Fixed Asset Turnover | N/A | 53.0 (2024) |
| Payout Ratio | 15.5% (2024) | 21.4% (2024) |
| Dividend Yield | 1.27% (2024) | 2.18% (2024) |
| Fiscal Year | 2025 | 2024 |
Efficiency & Valuation Duel: The Vital Signs
Financial ratios act as a company’s DNA, revealing hidden risks and operational excellence that raw numbers alone cannot capture.
Chubb Limited
Chubb Limited shows solid profitability with a neutral ROE at 14% and a favorable net margin of 17.3%. Its P/E of 12.0 suggests a reasonably priced stock, not stretched. The company returns value via a 1.22% dividend yield, balancing shareholder payouts with reinvestment in stable operations.
Cincinnati Financial Corporation
Cincinnati Financial demonstrates stronger profitability, boasting a 16.45% ROE and a higher net margin of 20.22%. Its P/E of 9.81 indicates an attractive valuation. The firm supports shareholders with a 2.18% dividend yield, reflecting robust cash generation and a commitment to steady returns without overleveraging.
Operational Efficiency and Valuation: Cincinnati’s Edge
Cincinnati Financial offers a better blend of profitability and valuation, highlighted by its superior ROE and dividend yield. Chubb’s profile suits investors prioritizing stable margins and moderate valuation. Cincinnati appeals more to those seeking higher returns with slightly greater operational efficiency.
Which one offers the Superior Shareholder Reward?
I see Chubb Limited (CB) delivers a modest 1.22% dividend yield with a prudent 15% payout ratio, signaling strong free cash flow coverage and room for growth reinvestment. Buybacks appear steady but less aggressive. Cincinnati Financial Corporation (CINF) boasts a higher 2.18% yield and a 21% payout ratio, supported by robust free cash flow and a stronger buyback intensity. Historically, CINF’s distribution model balances income and capital return more sustainably. For 2026, I favor Cincinnati for its superior total return profile driven by higher yield and disciplined buybacks.
Comparative Score Analysis: The Strategic Profile
The radar chart reveals the fundamental DNA and trade-offs of Chubb Limited and Cincinnati Financial Corporation’s financial profiles:
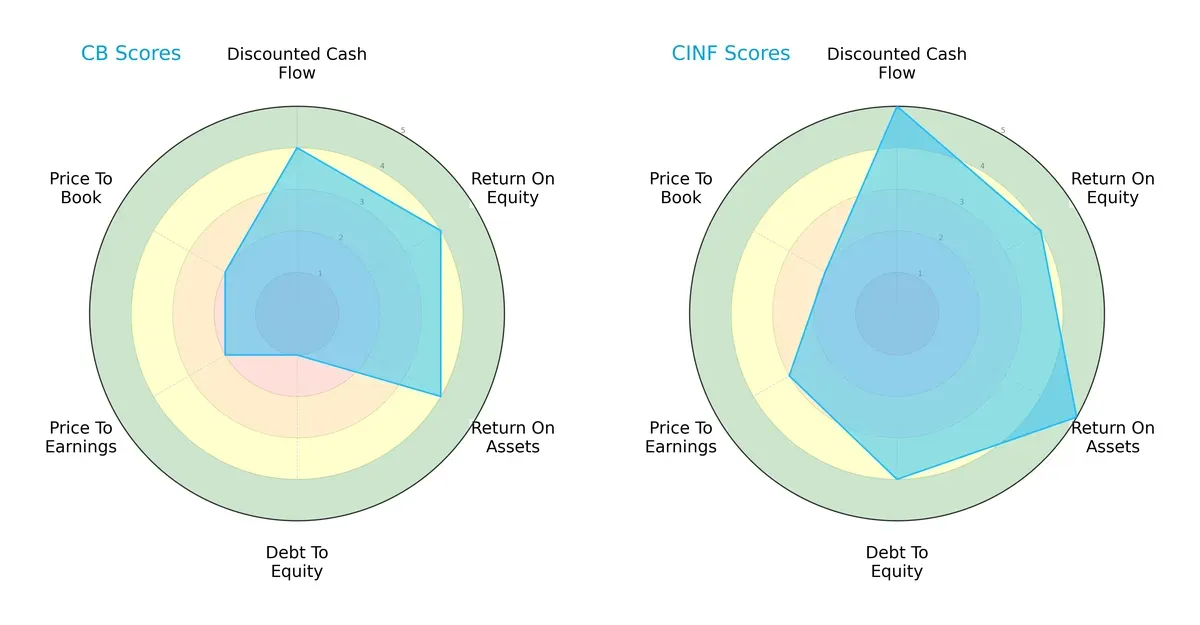
Cincinnati Financial leads with a stronger DCF (5 vs. 4) and ROA (5 vs. 4), reflecting superior cash flow projections and asset utilization. Both firms share a solid ROE score of 4. However, Chubb’s debt-to-equity score is a glaring weakness at 1, signaling higher financial risk, unlike Cincinnati’s healthier 4. Valuation metrics favor Cincinnati moderately on P/E but are equal on P/B. Overall, Cincinnati Financial presents a more balanced, financially stable profile, while Chubb relies heavily on operational efficiency but carries leverage risks.
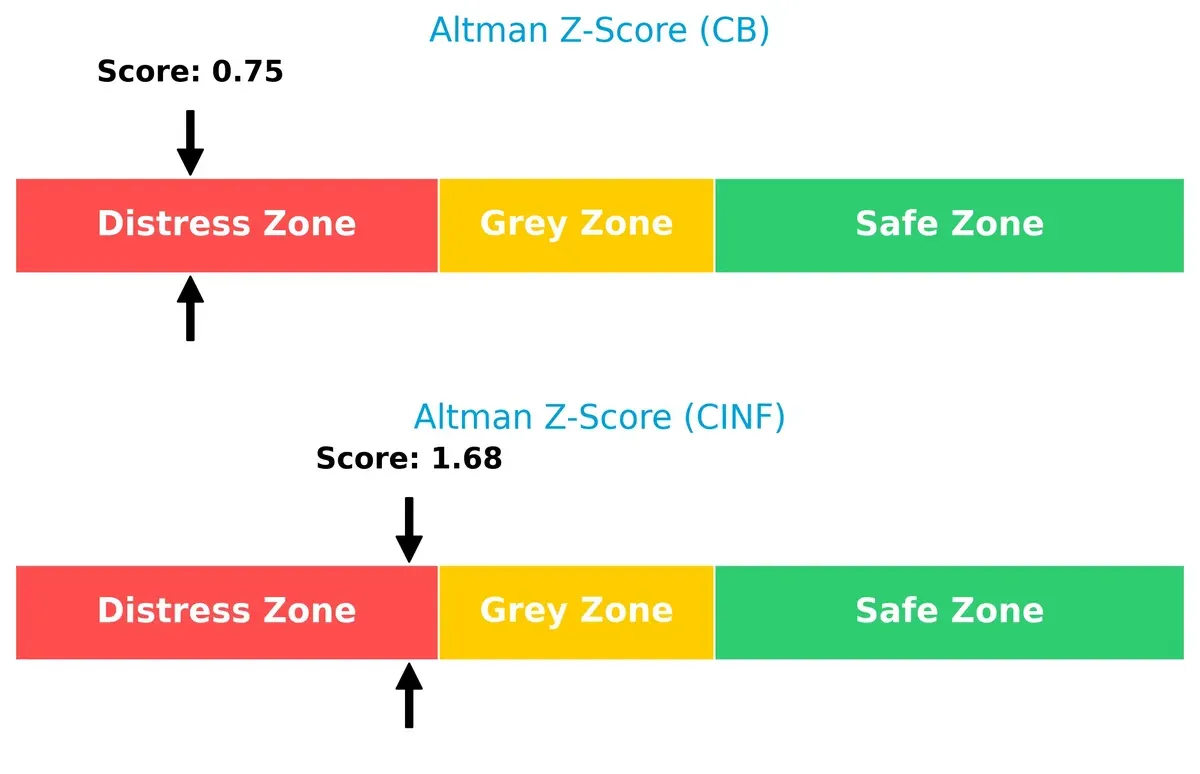
Bankruptcy Risk: Solvency Showdown
Chubb’s Altman Z-Score of 0.75 versus Cincinnati’s 1.68 places both in the distress zone, but Cincinnati is closer to the grey area, indicating a relatively lower bankruptcy risk in this cycle:
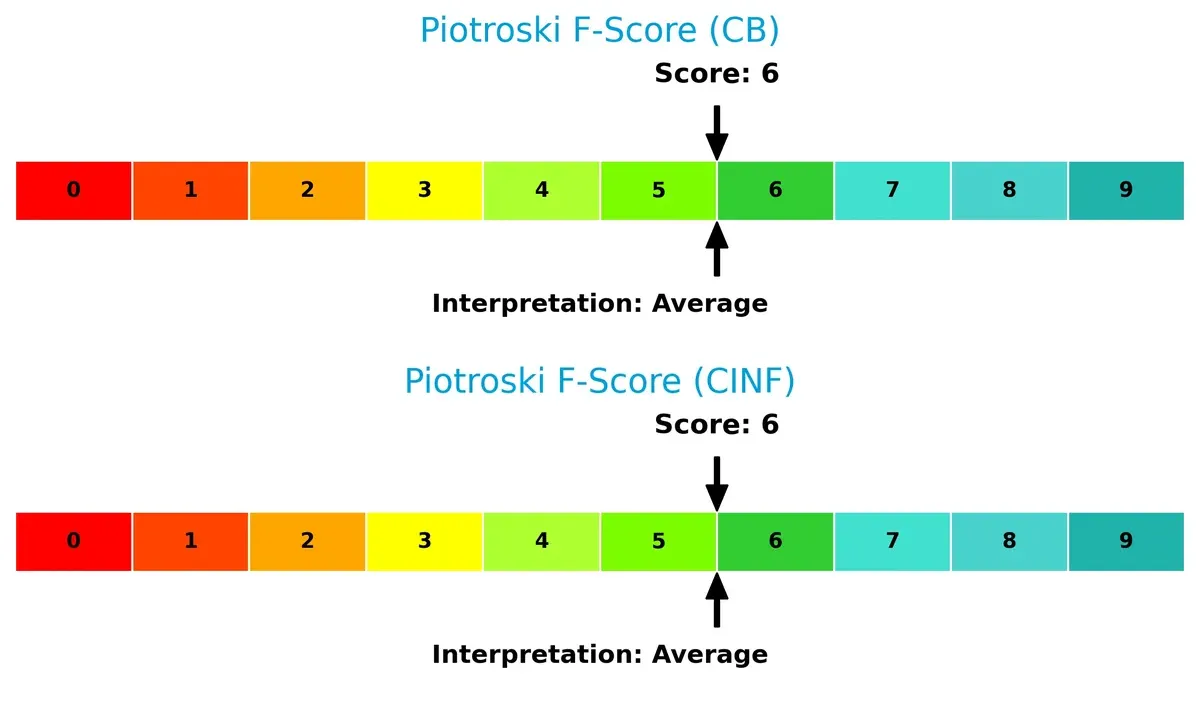
Financial Health: Quality of Operations
Both firms score a 6 on the Piotroski F-Score, indicating average financial health with no immediate red flags in operational quality, profitability, or liquidity:
How are the two companies positioned?
This section dissects the operational DNA of CB and CINF by comparing their revenue distribution and internal dynamics. The goal is to confront their economic moats to reveal which business model offers the most resilient competitive advantage today.
Revenue Segmentation: The Strategic Mix
This side-by-side visual comparison dissects how Chubb Limited and Cincinnati Financial Corporation diversify their income streams and reveals their primary sector bets:
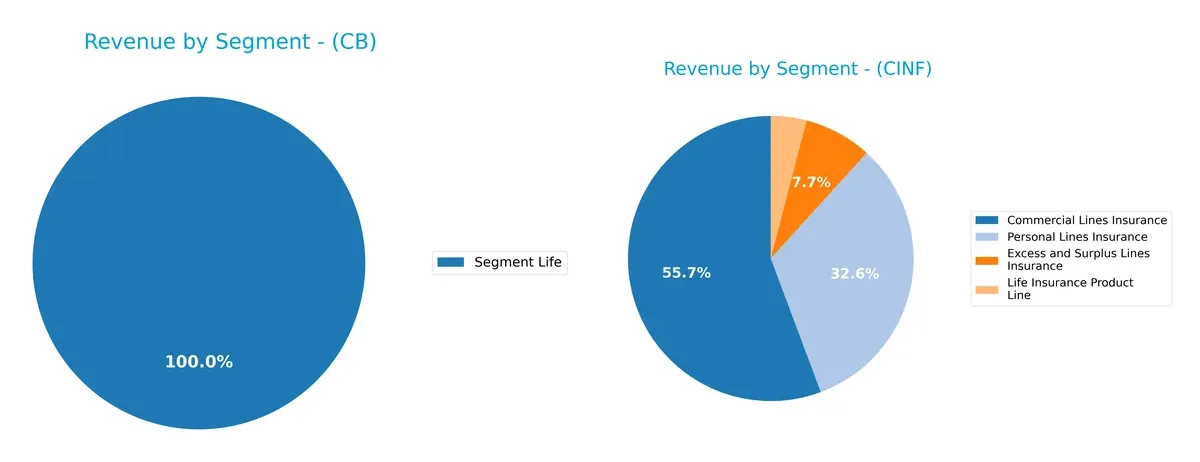
Chubb Limited anchors its revenue in a single dominant segment, Life Insurance, generating $6.75B in 2024. In contrast, Cincinnati Financial shows a more diversified mix, with Commercial Lines Insurance at $4.49B, Personal Lines at $2.63B, plus smaller streams from Excess and Surplus and Life Insurance segments. Cincinnati’s spread reduces concentration risk, while Chubb’s focus suggests deep expertise but higher exposure to lifecycle and regulatory shifts.
Strengths and Weaknesses Comparison
This table compares the strengths and weaknesses of Chubb Limited and Cincinnati Financial Corporation:
Chubb Limited Strengths
- High net margin at 17.3%
- Strong ROIC at 71.36%
- Favorable WACC at 6.06%
- Low debt-to-assets ratio
- Solid interest coverage at 12.8
- Diverse property and casualty insurance segment
Cincinnati Financial Strengths
- Higher net margin at 20.22%
- Strong ROE at 16.45%
- Exceptionally high ROIC at 9168%
- Favorable WACC at 6.75%
- High interest coverage at 54.92
- Diverse product lines including commercial, personal, and excess insurance
Chubb Limited Weaknesses
- Zero current and quick ratios indicate liquidity risk
- Low asset turnover at 0.22
- Unfavorable fixed asset turnover
- Neutral ROE and PB ratios
- Heavy reliance on US market revenue
Cincinnati Financial Weaknesses
- Zero current and quick ratios indicate liquidity risk
- Moderate asset turnover at 0.31
- Small debt-to-assets ratio of 2.4%
- Limited geographic revenue data beyond US
- Lower dividend yield compared to peers
Both companies demonstrate strong profitability and conservative capital structures. However, liquidity concerns and limited geographic diversification pose risks, influencing their strategies toward balance sheet optimization and market expansion.
The Moat Duel: Analyzing Competitive Defensibility
A structural moat is the only thing protecting long-term profits from the erosion of competition. Here’s how Chubb Limited and Cincinnati Financial Corporation stack up:
Chubb Limited: Intangible Assets with Global Reach
Chubb’s moat stems from its strong brand and diversified insurance portfolio. It shows high ROIC well above WACC but faces declining profitability trends. New specialty products could deepen its moat if managed carefully in 2026.
Cincinnati Financial Corporation: Efficient Capital Allocation and Margin Expansion
Cincinnati’s moat relies on superior capital efficiency and margin growth, outperforming Chubb with a rising ROIC trend. Its focused U.S. market presence and consistent profit expansion position it for further gains in 2026.
Margin Discipline vs. Capital Efficiency: The Moat Battle
Cincinnati’s growing ROIC and expanding margins form a wider, deeper moat than Chubb’s declining profitability despite higher scale. I see Cincinnati better equipped to defend and grow its market share in a competitive insurance landscape.
Which stock offers better returns?
Over the past year, both Chubb Limited and Cincinnati Financial Corporation posted gains, with Chubb showing accelerating momentum and Cincinnati experiencing a slowdown despite a higher overall rise.
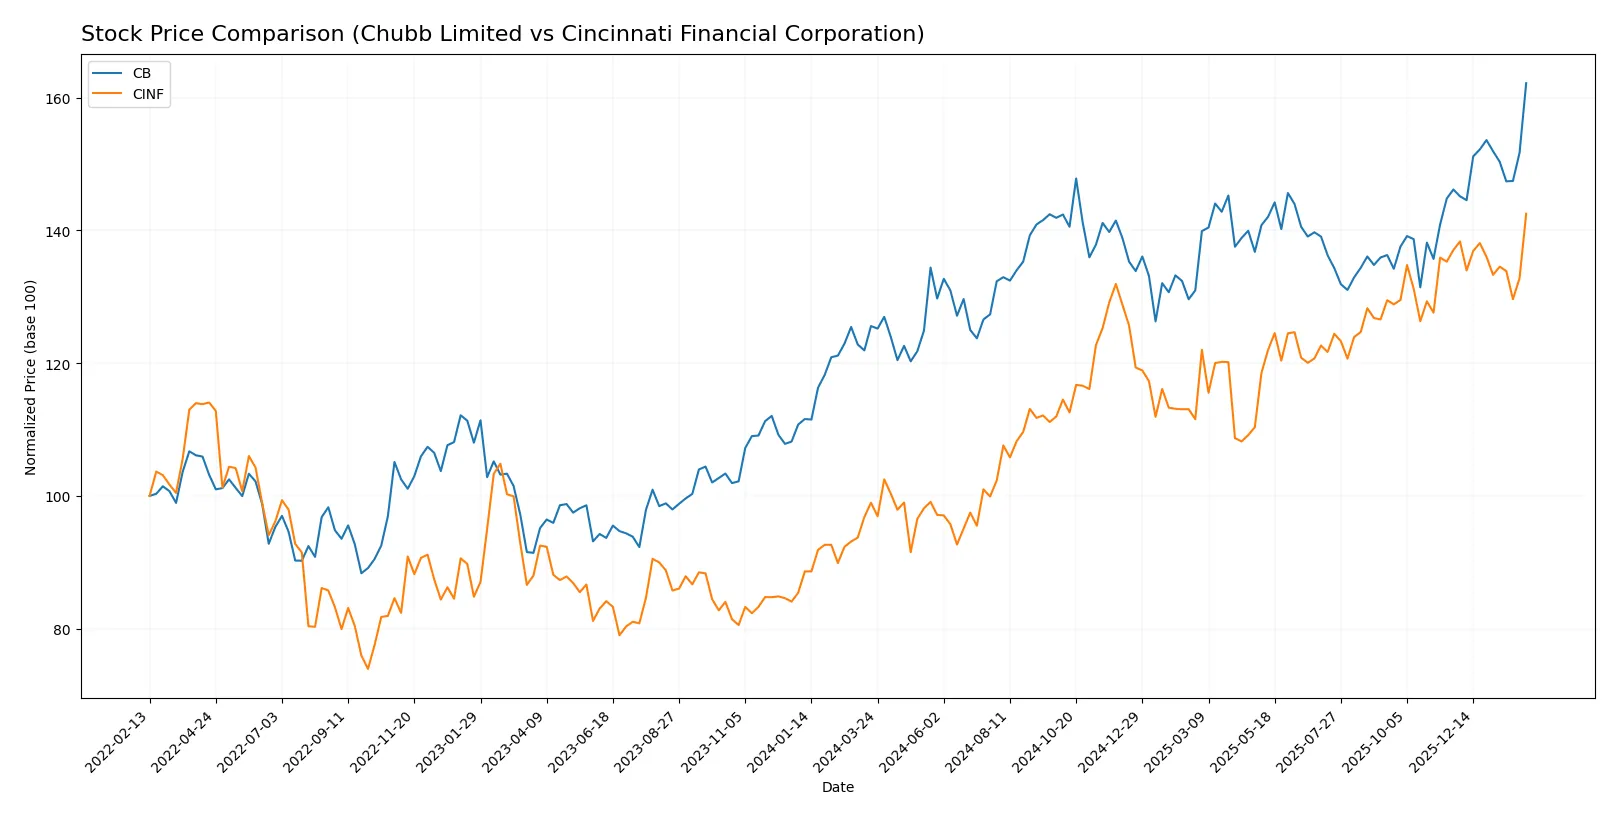
Trend Comparison
Chubb Limited’s stock gained 29.14% over 12 months, marking a bullish trend with accelerating upward momentum and a notable price range between 245.45 and 330.97. Cincinnati Financial Corporation’s stock rose 43.99% over the same period, also bullish but showing deceleration in price gains and trading between 110.88 and 172.65. Cincinnati outperformed Chubb with a higher total return, though its recent trend decelerated while Chubb accelerated.
Target Prices
Analysts present a solid target price consensus for Chubb Limited and Cincinnati Financial Corporation.
| Company | Target Low | Target High | Consensus |
|---|---|---|---|
| Chubb Limited | 283 | 366 | 330.5 |
| Cincinnati Financial Corporation | 157 | 175 | 166 |
Target prices suggest moderate upside for Chubb, aligning closely with its current price of 331 USD. Cincinnati Financial’s consensus at 166 USD sits slightly below its 173 USD market price, implying limited near-term gains.

Don’t Let Luck Decide Your Entry Point
Optimize your entry points with our advanced ProRealTime indicators. You’ll get efficient buy signals with precise price targets for maximum performance. Start outperforming now!
How do institutions grade them?
Here are the latest institutional grades for Chubb Limited and Cincinnati Financial Corporation:
Chubb Limited Grades
This table shows recent grade actions from major financial institutions for Chubb Limited.
| Grading Company | Action | New Grade | Date |
|---|---|---|---|
| Wells Fargo | Maintain | Equal Weight | 2026-02-05 |
| Evercore ISI Group | Maintain | Outperform | 2026-02-04 |
| JP Morgan | Maintain | Neutral | 2026-02-04 |
| Roth Capital | Maintain | Buy | 2026-02-04 |
| Citizens | Maintain | Market Outperform | 2026-02-04 |
| Citizens | Maintain | Market Outperform | 2026-01-16 |
| Cantor Fitzgerald | Maintain | Neutral | 2026-01-14 |
| Wells Fargo | Maintain | Equal Weight | 2026-01-13 |
| Barclays | Maintain | Equal Weight | 2026-01-08 |
| Goldman Sachs | Upgrade | Buy | 2026-01-08 |
Cincinnati Financial Corporation Grades
This table summarizes recent institutional grade actions for Cincinnati Financial Corporation.
| Grading Company | Action | New Grade | Date |
|---|---|---|---|
| Keefe, Bruyette & Woods | Maintain | Outperform | 2026-01-06 |
| Piper Sandler | Maintain | Neutral | 2025-12-22 |
| Keefe, Bruyette & Woods | Maintain | Outperform | 2025-11-04 |
| B of A Securities | Maintain | Buy | 2025-10-28 |
| B of A Securities | Maintain | Buy | 2025-10-13 |
| Keefe, Bruyette & Woods | Maintain | Outperform | 2025-10-06 |
| Keefe, Bruyette & Woods | Maintain | Outperform | 2025-08-05 |
| Roth Capital | Maintain | Buy | 2025-07-29 |
| Keefe, Bruyette & Woods | Maintain | Outperform | 2025-07-09 |
| Keefe, Bruyette & Woods | Maintain | Outperform | 2025-04-09 |
Which company has the best grades?
Cincinnati Financial Corporation consistently receives “Outperform” and “Buy” ratings, indicating stronger institutional confidence. Chubb Limited shows a mix of “Equal Weight,” “Neutral,” and some “Buy” upgrades. Investors may interpret Cincinnati’s higher grades as a signal of better growth or stability prospects.
Risks specific to each company
The following categories identify the critical pressure points and systemic threats facing both firms in the 2026 market environment:
1. Market & Competition
Chubb Limited
- Large global footprint faces intense competition from diversified reinsurers and niche insurers.
Cincinnati Financial Corporation
- Smaller scale with regional focus exposes it to competitive pressure from larger national insurers expanding locally.
2. Capital Structure & Debt
Chubb Limited
- Debt-free with favorable debt-to-equity metrics, indicating strong balance sheet discipline.
Cincinnati Financial Corporation
- Low debt ratio but carries modest leverage, maintaining financial flexibility with excellent interest coverage.
3. Stock Volatility
Chubb Limited
- Low beta of 0.49 signals defensive stock with limited market sensitivity.
Cincinnati Financial Corporation
- Moderate beta of 0.65 suggests higher sensitivity to market swings, increasing volatility risk.
4. Regulatory & Legal
Chubb Limited
- Operates globally, subject to complex multinational insurance regulations and compliance risks.
Cincinnati Financial Corporation
- Primarily U.S.-focused, facing evolving federal and state insurance regulations but less complexity.
5. Supply Chain & Operations
Chubb Limited
- Extensive broker and agent networks globally, operational risks include disruption in distribution channels.
Cincinnati Financial Corporation
- More concentrated operational footprint, which may reduce complexity but increase regional operational risks.
6. ESG & Climate Transition
Chubb Limited
- Exposed to climate-related claims worldwide; must invest heavily in climate risk modeling and sustainable underwriting.
Cincinnati Financial Corporation
- Faces climate transition risks primarily in U.S. markets, with opportunities to lead in regional ESG initiatives.
7. Geopolitical Exposure
Chubb Limited
- Significant exposure to geopolitical volatility in multiple regions, increasing risk of claims and regulatory changes.
Cincinnati Financial Corporation
- Limited international exposure, reducing geopolitical risks but still sensitive to U.S. domestic political shifts.
Which company shows a better risk-adjusted profile?
Cincinnati Financial’s most impactful risk is its regional competitive pressure and moderate stock volatility. Chubb’s greatest risk lies in global regulatory complexity and geopolitical exposure. Despite these, Cincinnati’s stronger financial ratios and higher Altman Z-Score place it ahead on a risk-adjusted basis. Notably, Chubb’s Altman Z-Score remains deep in the distress zone at 0.75, signaling heightened bankruptcy risk compared to Cincinnati’s 1.68. This stark contrast highlights Cincinnati’s superior financial resilience amid 2026’s uncertain environment.
Final Verdict: Which stock to choose?
Chubb Limited’s superpower lies in its robust value creation with a solid ROIC well above its cost of capital. Its key point of vigilance is a declining ROIC trend and weaker asset turnover, signaling efficiency pressures ahead. This stock suits an Aggressive Growth portfolio focused on enduring moats amid operational challenges.
Cincinnati Financial Corporation boasts a strategic moat grounded in exceptional capital efficiency and rising profitability. Its superior interest coverage and stronger safety profile compared to Chubb offer resilience. This makes it a compelling candidate for a GARP (Growth at a Reasonable Price) portfolio seeking both growth and stability.
If you prioritize durable competitive advantages with a track record of value creation, Cincinnati Financial outshines due to its expanding ROIC and robust financial health. However, for investors targeting aggressive growth with tolerance for operational risks, Chubb presents an intriguing scenario given its entrenched market position but declining efficiency. Both require close monitoring of their evolving profitability and cash flow dynamics.
Disclaimer: Investment carries a risk of loss of initial capital. The past performance is not a reliable indicator of future results. Be sure to understand risks before making an investment decision.
Go Further
I encourage you to read the complete analyses of Chubb Limited and Cincinnati Financial Corporation to enhance your investment decisions: