Home > Comparison > Consumer Cyclical > MCD vs CMG
The strategic rivalry between McDonald’s Corporation and Chipotle Mexican Grill defines the current trajectory of the restaurant sector. McDonald’s operates a capital-intensive global franchise model, while Chipotle pursues a growth-focused, fast-casual dining approach. This head-to-head contrasts scale and operational efficiency against innovation and expansion. This analysis will determine which business model offers superior risk-adjusted returns for a diversified portfolio in the evolving consumer cyclical landscape.
Table of contents
Companies Overview
McDonald’s and Chipotle dominate the fast-casual restaurant landscape with distinct brand footprints and growth strategies.
McDonald’s Corporation: Global Fast-Food Giant
McDonald’s commands the global quick-service restaurant market with over 40,000 outlets worldwide. It generates revenue primarily through franchising fees and company-operated stores selling burgers, fries, and beverages. In 2026, McDonald’s strategic focus remains on digital innovation and menu diversification to boost customer engagement and operational efficiency.
Chipotle Mexican Grill, Inc.: Fast-Casual Pioneer
Chipotle leads the fast-casual segment with around 3,000 locations emphasizing customizable Mexican cuisine. Its revenue comes mainly from company-operated restaurants focused on fresh ingredients and sustainability. In 2026, Chipotle targets expanding its footprint internationally and enhancing digital ordering to capture new market share.
Strategic Collision: Similarities & Divergences
McDonald’s uses a franchise-driven global scale, while Chipotle emphasizes company-owned stores with a fresh, premium positioning. Both battle fiercely in customer experience and digital innovation. McDonald’s offers broad menu variety, contrasting with Chipotle’s focused, health-conscious approach. Their investment profiles diverge between McDonald’s stability and Chipotle’s growth-oriented momentum.
Income Statement Comparison
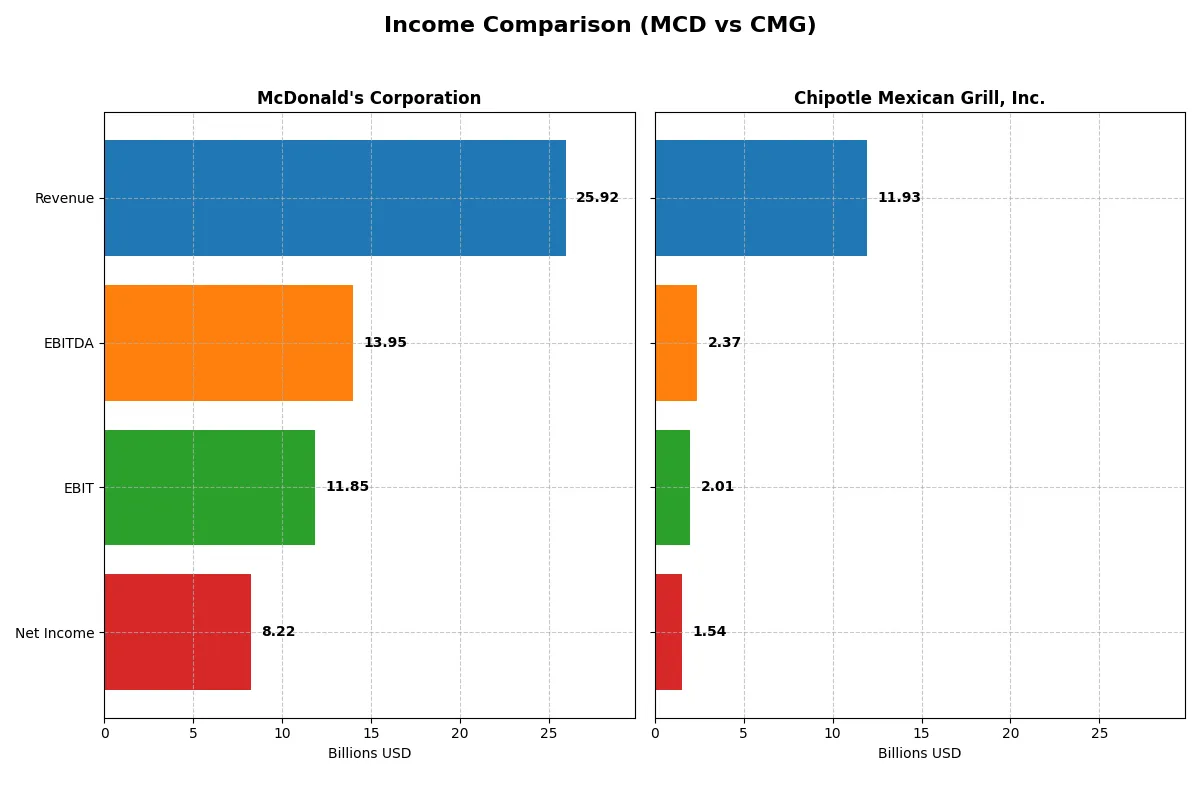
This data dissects the core profitability and scalability of both corporate engines to reveal who dominates the bottom line:
| Metric | McDonald’s (MCD) | Chipotle (CMG) |
|---|---|---|
| Revenue | 25.9B | 11.9B |
| Cost of Revenue | 11.2B | 9.3B |
| Operating Expenses | 3.0B | 0.7B |
| Gross Profit | 14.7B | 2.7B |
| EBITDA | 13.9B | 2.4B |
| EBIT | 11.9B | 2.0B |
| Interest Expense | 1.5B | 0 |
| Net Income | 8.2B | 1.5B |
| EPS | 11.45 | 1.15 |
| Fiscal Year | 2024 | 2025 |
Income Statement Analysis: The Bottom-Line Duel
This income statement comparison exposes which company runs a more efficient and profitable corporate engine through recent financial performance.
McDonald’s Corporation Analysis
McDonald’s revenue grew steadily by 35% over five years, with net income rising 74%. Its gross margin holds strong at 56.75%, and net margin remains robust at 31.72%. However, recent one-year figures show slight declines in revenue (1.7%) and net margin (-4.5%), indicating some momentum loss despite high profitability.
Chipotle Mexican Grill, Inc. Analysis
Chipotle delivered impressive revenue growth of 58% and net income surge of 135% across five years. Its gross margin sits at a leaner 22.35%, and net margin at 12.88%, reflecting its different cost structure. Recently, revenue grew 5.4% but gross profit fell nearly 12%, signaling margin pressure despite continued top-line expansion.
Margin Strength vs. Growth Momentum
McDonald’s dominates on profitability with superior margins and consistent earnings, but its recent growth shows signs of slowing. Chipotle excels in rapid revenue and earnings growth but faces margin compression. Investors seeking stable, high-margin cash flow may prefer McDonald’s, while those favoring growth potential might lean toward Chipotle’s dynamic expansion.
Financial Ratios Comparison
These vital ratios act as a diagnostic tool to expose the underlying fiscal health, valuation premiums, and capital efficiency of the companies compared below:
| Ratios | McDonald’s (MCD) | Chipotle (CMG) |
|---|---|---|
| ROE | -2.17% (2024) | 54.26% (2025) |
| ROIC | 17.9% (2024) | 18.93% (2025) |
| P/E | 25.32 (2024) | 32.22 (2025) |
| P/B | -54.85 (2024) | 17.48 (2025) |
| Current Ratio | 1.19 (2024) | 1.23 (2025) |
| Quick Ratio | 1.18 (2024) | 1.19 (2025) |
| D/E | -13.68 (2024) | 3.48 (2025) |
| Debt-to-Assets | 94.14% (2024) | 109.50% (2025) |
| Interest Coverage | 7.78 (2024) | 0 (2025) |
| Asset Turnover | 0.47 (2024) | 1.33 (2025) |
| Fixed Asset Turnover | 0.67 (2024) | 1.67 (2025) |
| Payout ratio | 59.22% (2024) | 0% (2025) |
| Dividend yield | 2.34% (2024) | 0% (2025) |
| Fiscal Year | 2024 | 2025 |
Efficiency & Valuation Duel: The Vital Signs
Financial ratios act as the company’s DNA, unveiling hidden risks and operational excellence critical for investment decisions.
McDonald’s Corporation
McDonald’s posts a robust net margin of 31.7%, signaling strong profitability despite a negative ROE of -216.6%. Its P/E ratio of 25.3 suggests a stretched valuation. The company rewards shareholders with a 2.34% dividend yield, reflecting steady cash returns alongside disciplined capital allocation.
Chipotle Mexican Grill, Inc.
Chipotle demonstrates excellent profitability with a 54.3% ROE and a 12.9% net margin, but trades at a higher P/E of 32.2, indicating a premium valuation. It reinvests heavily in growth rather than paying dividends, relying on strong ROIC of 18.9% to justify its valuation and fuel expansion.
Balanced Profitability vs. Growth Premium
McDonald’s offers a safer profile with solid margins and a shareholder-friendly dividend amidst a stretched valuation. Chipotle commands a premium for superior returns and growth potential but lacks income distribution. Risk-averse investors may prefer McDonald’s, while growth-focused investors might favor Chipotle’s dynamic profile.
Which one offers the Superior Shareholder Reward?
McDonald’s (MCD) pays a steady dividend yielding ~2.2% with a payout ratio near 54-59%, well-covered by free cash flow (~70%). It also pursues aggressive buybacks, enhancing shareholder returns. Chipotle (CMG) pays no dividend but reinvests heavily in growth, reflected in high ROIC and expanding margins. CMG’s buybacks are modest but growing. Historically, I’ve seen dividend plus buyback models like MCD’s provide stable, attractive total returns in mature sectors. CMG’s reinvestment strategy suits growth investors but carries higher risk. For 2026, I favor McDonald’s for a superior and sustainable shareholder reward, balancing income and capital return with prudent capital allocation.
Comparative Score Analysis: The Strategic Profile
The radar chart reveals the fundamental DNA and trade-offs of McDonald’s Corporation and Chipotle Mexican Grill, Inc., highlighting their core financial strengths and vulnerabilities:
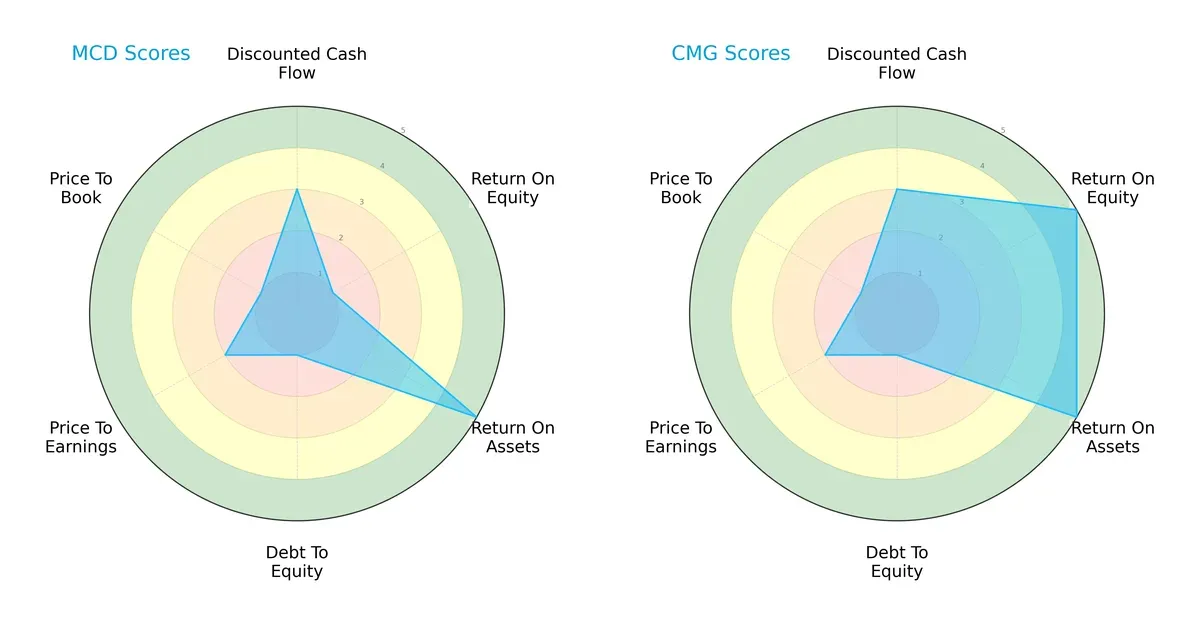
Chipotle leads with superior profitability metrics, scoring 5 in ROE and ROA, reflecting efficient capital and asset use. McDonald’s shows strength in asset utilization (ROA 5) but struggles with equity returns (ROE 1) and debt management (Debt/Equity 1). Both firms face valuation challenges with low PE and PB scores, signaling market skepticism or overvaluation risks. Chipotle presents a more balanced and robust financial profile, while McDonald’s relies heavily on asset efficiency amid capital structure weaknesses.
Bankruptcy Risk: Solvency Showdown
The Altman Z-Scores position both companies comfortably in the safe zone:
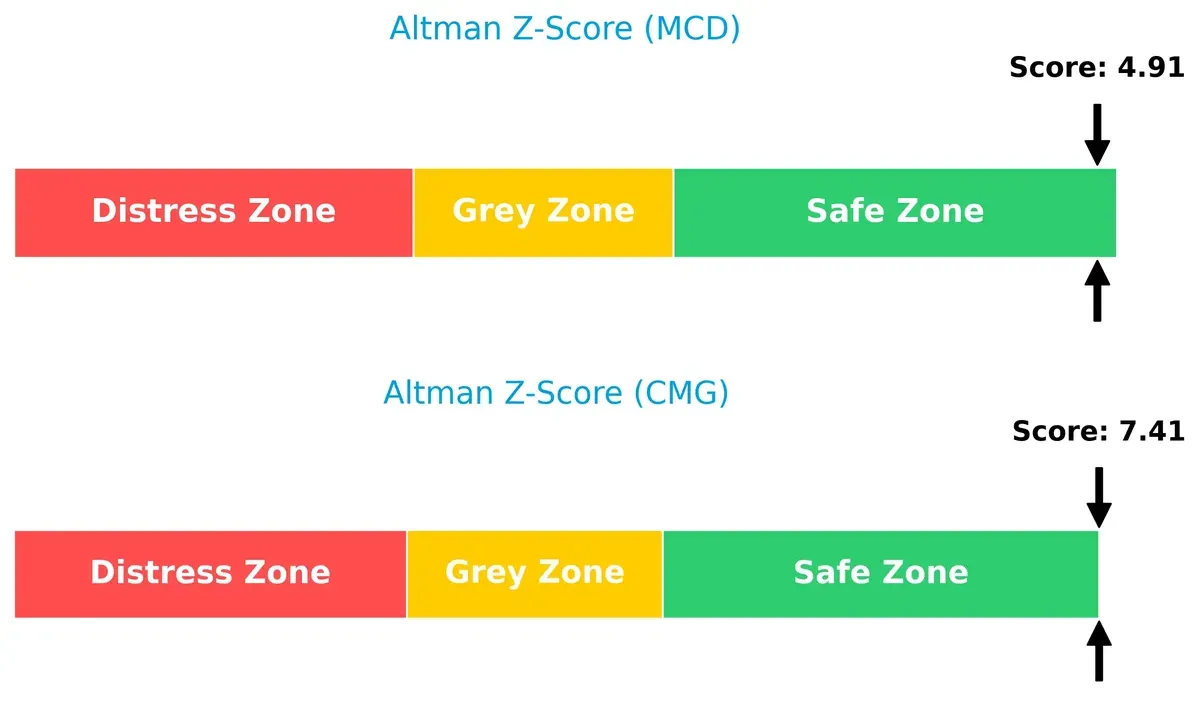
Chipotle’s higher score of 7.41 versus McDonald’s 4.91 indicates a stronger cushion against bankruptcy risk. This suggests Chipotle is better insulated from economic downturns, while McDonald’s, though safe, has a narrower margin of financial safety in this cycle.
Financial Health: Quality of Operations
Piotroski F-Scores show McDonald’s at 7, indicating strong operational health, against Chipotle’s 6, which is average:
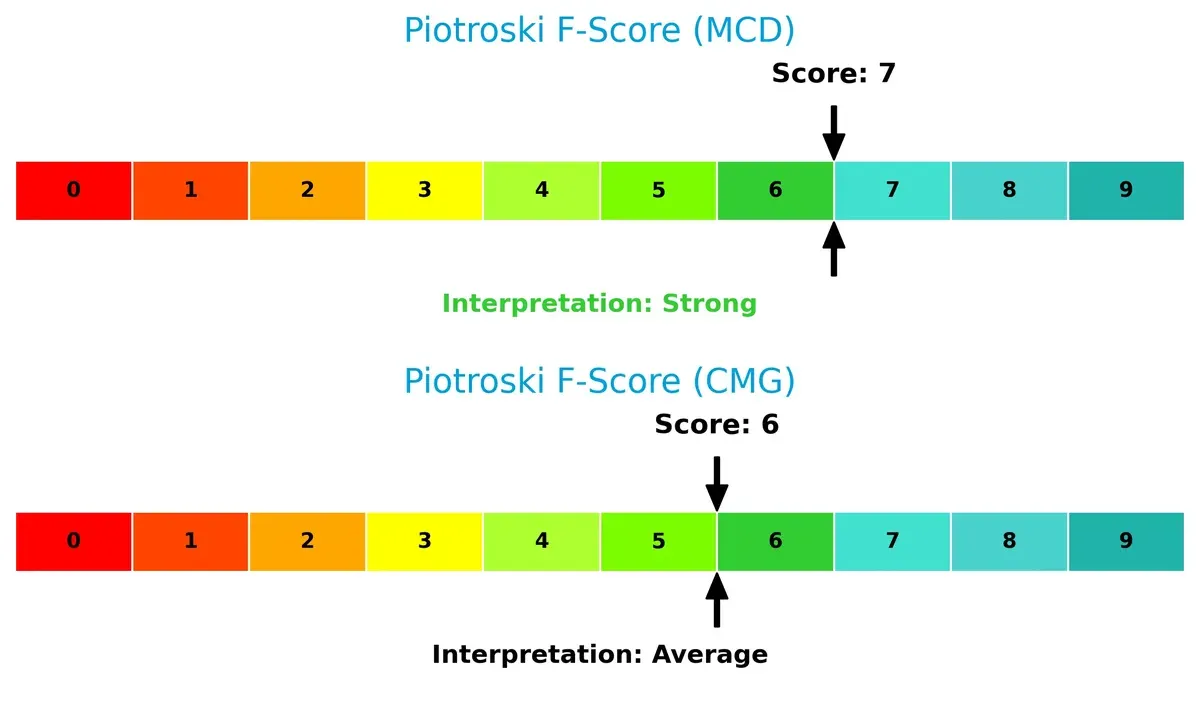
McDonald’s internal financial metrics suggest robust profitability, leverage, and liquidity management, reducing red flags. Chipotle’s slightly lower score signals some internal operational risks, despite its market strengths. Investors should monitor Chipotle’s internal metrics closely for potential deterioration.
How are the two companies positioned?
This section dissects the operational DNA of McDonald’s and Chipotle by comparing their revenue distribution and internal dynamics. The goal is to confront their economic moats and identify which model offers the most resilient competitive advantage today.
Revenue Segmentation: The Strategic Mix
The following visual comparison dissects how both firms diversify their income streams and where their primary sector bets lie:
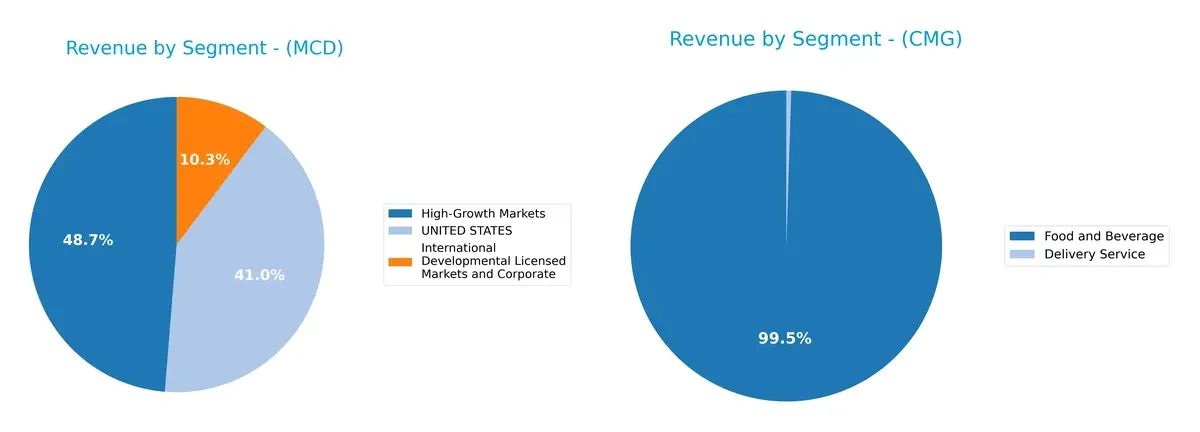
McDonald’s revenue splits among the United States ($10.6B), High-Growth Markets ($12.6B), and International Licensed Markets ($2.7B), showing a balanced geographic spread. Chipotle’s income pivots heavily on Food and Beverage ($11.9B) with a minor $66M from Delivery Service, revealing a concentrated operational model. McDonald’s diversified international footprint reduces concentration risk, while Chipotle’s focus amplifies operational leverage but increases vulnerability to segment-specific disruptions.
Strengths and Weaknesses Comparison
This table compares the strengths and weaknesses of McDonald’s Corporation and Chipotle Mexican Grill, Inc.:
McDonald’s Strengths
- Diverse global presence with strong revenues from US and international markets
- High net margin of 31.72% indicates strong profitability
- Favorable ROIC of 17.92% exceeds WACC, showing efficient capital allocation
Chipotle Strengths
- Favorable ROE of 54.26% signals strong shareholder returns
- ROIC of 18.93% surpasses WACC, reflecting solid operational efficiency
- Higher asset turnover of 1.33 shows effective use of assets
McDonald’s Weaknesses
- Negative ROE at -216.62% raises concerns about equity returns
- High debt-to-assets ratio of 94.14% indicates leverage risk
- Unfavorable asset turnover at 0.47 suggests asset inefficiency
Chipotle Weaknesses
- Elevated debt-to-assets ratio of 109.5%, signaling financial risk
- Unfavorable P/E and P/B ratios suggest potential overvaluation
- Zero dividend yield limits income for shareholders
McDonald’s benefits from a diversified global footprint and strong profitability but faces risks from high leverage and poor ROE. Chipotle demonstrates superior efficiency and returns but carries financial risk due to high leverage and lacks dividend income, impacting investor appeal.
The Moat Duel: Analyzing Competitive Defensibility
A structural moat is the only reliable barrier protecting long-term profits from relentless competitive pressure:
McDonald’s Corporation: Franchise Powerhouse with Scale and Brand Loyalty
McDonald’s moat stems from its vast global franchise network and iconic brand, reflected in a robust 56.75% gross margin and stable 31.72% net margin. Its expanding footprint in international markets supports deepening competitive advantages in 2026.
Chipotle Mexican Grill, Inc.: Growth-Driven Operational Efficiency
Chipotle’s moat relies on operational excellence and menu innovation, driving a strong 22.35% gross margin and accelerating 11.3% ROIC above WACC. Unlike McDonald’s scale, Chipotle leverages agile growth and premium positioning to expand market share in 2026.
Moat Depth Battle: Scale and Brand Loyalty vs. Operational Excellence and Growth
McDonald’s wider moat combines scale, brand, and international reach, delivering margin stability and value creation. Chipotle’s deeper ROIC growth indicates dynamic operational leverage but lacks McDonald’s global scale. McDonald’s remains better equipped to defend market share long term.
Which stock offers better returns?
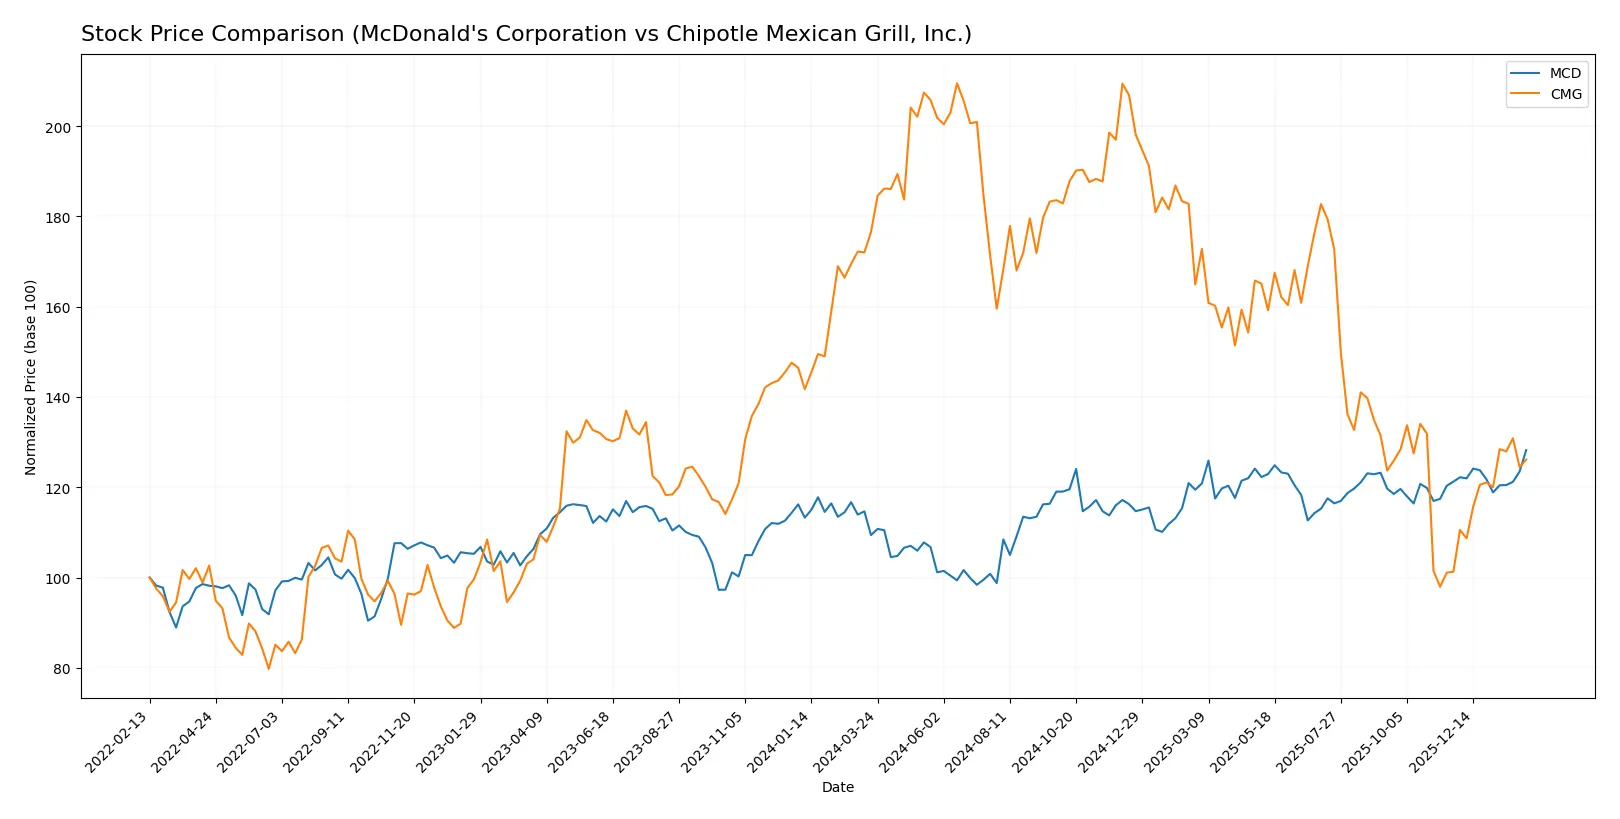
Over the past year, McDonald’s shares gained 17.2%, showing a bullish trend with decelerating momentum, while Chipotle’s stock fell 28.55%, reflecting a bearish trend but accelerating downside pressure.
Trend Comparison
McDonald’s stock rose 17.2% over 12 months, maintaining a bullish trend despite deceleration and a high volatility of 18.39%. The price ranged between 251.09 and 327.16.
Chipotle’s stock declined 28.55% in the same period, marking a bearish trend with accelerating losses. Volatility was lower at 9.32%, with prices fluctuating between 30.59 and 65.43.
McDonald’s outperformed Chipotle over the past year, delivering the highest market returns despite recent slower gains compared to Chipotle’s accelerating decline.
Target Prices
Analysts present a clear upward consensus for McDonald’s and Chipotle, reflecting confidence in their growth prospects.
| Company | Target Low | Target High | Consensus |
|---|---|---|---|
| McDonald’s Corporation | 315 | 372 | 341.07 |
| Chipotle Mexican Grill, Inc. | 35 | 52 | 44.35 |
McDonald’s target consensus of 341.07 exceeds the current price of 327.16, suggesting moderate upside. Chipotle’s consensus of 44.35 also surpasses its 39.39 share price, indicating positive analyst sentiment.

Don’t Let Luck Decide Your Entry Point
Optimize your entry points with our advanced ProRealTime indicators. You’ll get efficient buy signals with precise price targets for maximum performance. Start outperforming now!
How do institutions grade them?
The following tables summarize recent grades from established financial institutions for each company:
McDonald’s Corporation Grades
This table shows recent grades and actions from notable grading companies for McDonald’s Corporation.
| Grading Company | Action | New Grade | Date |
|---|---|---|---|
| Guggenheim | Maintain | Neutral | 2026-02-03 |
| BTIG | Upgrade | Buy | 2026-02-02 |
| Keybanc | Maintain | Overweight | 2026-01-09 |
| TD Cowen | Maintain | Hold | 2026-01-08 |
| Truist Securities | Maintain | Buy | 2026-01-08 |
| Barclays | Maintain | Overweight | 2026-01-07 |
| Oppenheimer | Upgrade | Outperform | 2026-01-06 |
| Guggenheim | Maintain | Neutral | 2025-11-19 |
| Baird | Maintain | Neutral | 2025-11-06 |
| Wells Fargo | Maintain | Overweight | 2025-11-06 |
Chipotle Mexican Grill, Inc. Grades
This table presents recent grades and actions from reputable grading companies for Chipotle Mexican Grill, Inc.
| Grading Company | Action | New Grade | Date |
|---|---|---|---|
| Argus Research | Maintain | Hold | 2026-02-05 |
| TD Cowen | Maintain | Buy | 2026-02-04 |
| Morgan Stanley | Maintain | Overweight | 2026-02-04 |
| Keybanc | Maintain | Overweight | 2026-02-04 |
| Piper Sandler | Maintain | Overweight | 2026-02-04 |
| Mizuho | Maintain | Neutral | 2026-02-04 |
| BTIG | Maintain | Buy | 2026-02-04 |
| Citigroup | Maintain | Buy | 2026-02-04 |
| Stifel | Maintain | Buy | 2026-02-04 |
| Barclays | Maintain | Equal Weight | 2026-02-04 |
Which company has the best grades?
McDonald’s receives a mix of Buy, Overweight, and Neutral grades with upgrades to Outperform noted. Chipotle holds mostly Buy and Overweight ratings, maintaining a generally positive outlook. Investors may interpret Chipotle’s consistent Buy ratings as confidence in growth, while McDonald’s diverse grades suggest caution with pockets of strong conviction.
Risks specific to each company
The following categories identify the critical pressure points and systemic threats facing McDonald’s Corporation and Chipotle Mexican Grill in the 2026 market environment:
1. Market & Competition
McDonald’s Corporation
- Dominates global fast-food with extensive franchise network but faces saturation risk.
Chipotle Mexican Grill, Inc.
- Rapid expansion in fast-casual segment but intense competition and market share volatility.
2. Capital Structure & Debt
McDonald’s Corporation
- High debt-to-assets ratio at 94% signals leverage risk despite solid interest coverage.
Chipotle Mexican Grill, Inc.
- Debt-to-assets exceeds 109%, reflecting aggressive financing; interest coverage is strong but leverage remains a concern.
3. Stock Volatility
McDonald’s Corporation
- Low beta (0.53) indicates defensive stock with limited volatility.
Chipotle Mexican Grill, Inc.
- Near-market beta (~1.0) implies higher sensitivity to market swings, increasing risk for investors.
4. Regulatory & Legal
McDonald’s Corporation
- Faces ongoing regulatory scrutiny globally, especially on labor and health standards.
Chipotle Mexican Grill, Inc.
- Subject to food safety regulations and potential litigation risks due to fresh food supply chain.
5. Supply Chain & Operations
McDonald’s Corporation
- Complex global supply chain vulnerable to geopolitical disruptions and commodity price swings.
Chipotle Mexican Grill, Inc.
- Relies on fresh ingredients, increasing exposure to supply volatility and operational disruptions.
6. ESG & Climate Transition
McDonald’s Corporation
- Under pressure to reduce carbon footprint and improve sustainable sourcing across franchisees.
Chipotle Mexican Grill, Inc.
- Strong focus on organic and sustainable sourcing but higher operational costs and transparency demands.
7. Geopolitical Exposure
McDonald’s Corporation
- Significant exposure in multiple international markets facing geopolitical tensions.
Chipotle Mexican Grill, Inc.
- Mostly North America and Europe focused, with moderate geopolitical risk but some currency exposure.
Which company shows a better risk-adjusted profile?
McDonald’s faces high leverage and operational complexity but benefits from a stable, low-volatility stock and robust global presence. Chipotle shows stronger profitability metrics but carries higher financial leverage and stock volatility. McDonald’s safer Altman Z-Score and stronger Piotroski score suggest better financial resilience. However, Chipotle’s growth potential justifies its elevated risk. The single most impactful risk for McDonald’s is its elevated debt burden, while Chipotle’s market volatility and leverage stand out. McDonald’s low beta of 0.53 versus Chipotle’s nearly 1.0 confirms McDonald’s as the better risk-adjusted choice in 2026.
Final Verdict: Which stock to choose?
McDonald’s superpower lies in its unmatched operational efficiency and a resilient economic moat, consistently generating strong returns on invested capital. Its main point of vigilance is the high debt load, which could pressure financial flexibility. This stock suits portfolios targeting steady, long-term income and moderate growth.
Chipotle’s strategic moat is its dynamic growth and superior capital efficiency, supported by a rapidly expanding customer base. It offers better return on equity and asset turnover than McDonald’s but carries higher valuation multiples and financial leverage. Chipotle fits well in growth-oriented portfolios that tolerate elevated risk for premium upside.
If you prioritize stable cash flow and a proven competitive advantage, McDonald’s is the compelling choice due to its durable value creation despite leverage concerns. However, if you seek aggressive growth fueled by strong operational momentum, Chipotle offers superior expansion potential and return metrics, albeit with greater volatility and valuation premium.
Disclaimer: Investment carries a risk of loss of initial capital. The past performance is not a reliable indicator of future results. Be sure to understand risks before making an investment decision.
Go Further
I encourage you to read the complete analyses of McDonald’s Corporation and Chipotle Mexican Grill, Inc. to enhance your investment decisions: