Home > Comparison > Consumer Cyclical > CMG vs DPZ
The strategic rivalry between Chipotle Mexican Grill, Inc. and Domino’s Pizza, Inc. defines the current trajectory of the consumer cyclical restaurant industry. Chipotle operates a premium fast-casual model emphasizing quality and experience, while Domino’s excels in a high-volume, franchise-driven pizza delivery network. This face-off highlights growth versus scale dynamics. This analysis aims to identify which company offers the superior risk-adjusted return potential for a diversified portfolio in today’s competitive landscape.

Table of contents
Companies Overview
Chipotle Mexican Grill and Domino’s Pizza dominate the fast-casual and delivery segments of the restaurant industry.
Chipotle Mexican Grill, Inc.: Pioneer of Fast-Casual Mexican Dining
Chipotle stands as a leader in fast-casual dining, primarily earning through company-operated restaurants across multiple countries. Its core revenue engine is menu innovation focused on fresh ingredients and customization. In 2026, Chipotle aggressively pursued digital expansion and drive-thru formats to boost same-store sales and customer convenience.
Domino’s Pizza, Inc.: Global Pizza Delivery Powerhouse
Domino’s commands the pizza delivery and carryout market with a massive footprint of company-owned and franchised stores worldwide. Its revenue relies on a diversified menu and efficient supply chain management. In 2026, Domino’s emphasized technology-driven order platforms and international franchise growth to extend its market leadership.
Strategic Collision: Similarities & Divergences
Both firms compete on convenience and customer experience but differ sharply in their business models. Chipotle invests heavily in a company-operated, fresh-food model, while Domino’s leverages a franchise-driven, delivery-centric infrastructure. Their primary battleground is digital ordering and geographic expansion. Investors face distinct profiles: Chipotle bets on operational control and innovation; Domino’s relies on scale and global franchising.
Income Statement Comparison
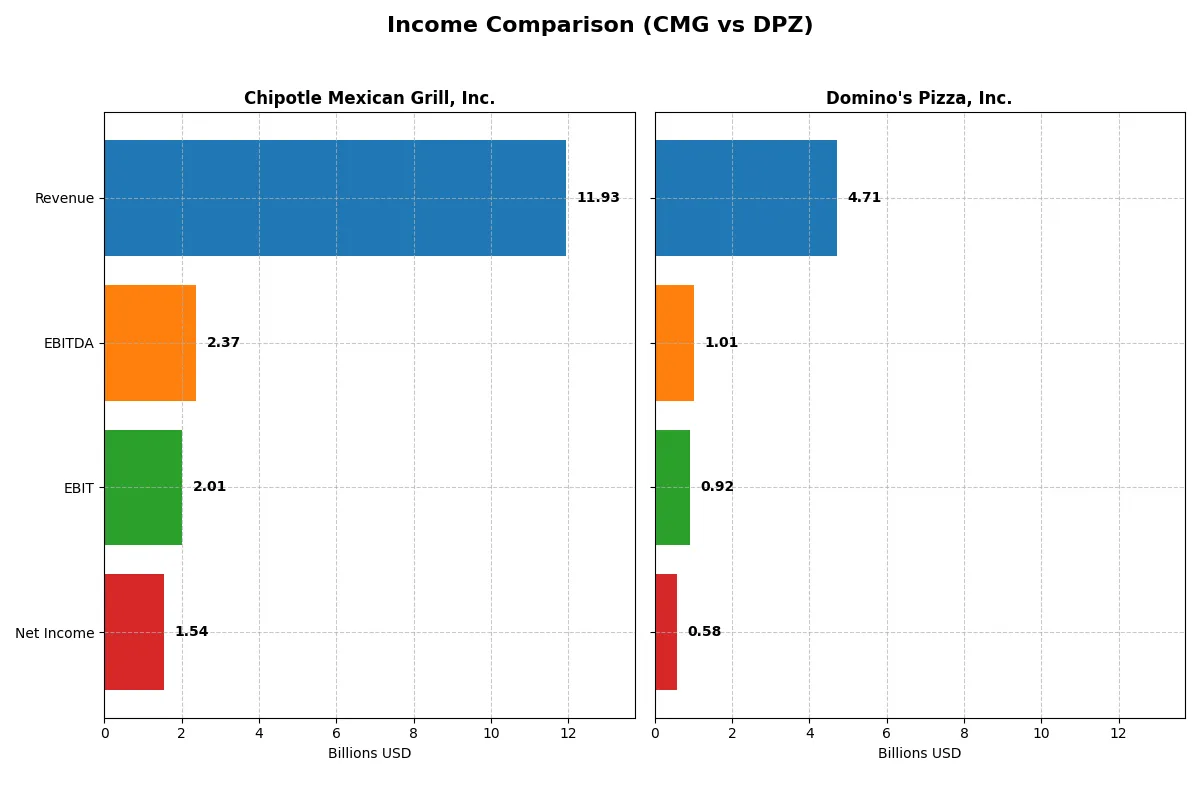
This data dissects the core profitability and scalability of both corporate engines to reveal who dominates the bottom line:
| Metric | Chipotle Mexican Grill, Inc. (CMG) | Domino’s Pizza, Inc. (DPZ) |
|---|---|---|
| Revenue | 11.93B | 4.71B |
| Cost of Revenue | 9.26B | 2.86B |
| Operating Expenses | 656M | 970M |
| Gross Profit | 2.66B | 1.85B |
| EBITDA | 2.37B | 1.01B |
| EBIT | 2.01B | 918M |
| Interest Expense | 0 | 196M |
| Net Income | 1.54B | 584M |
| EPS | 1.15 | 16.82 |
| Fiscal Year | 2025 | 2024 |
Income Statement Analysis: The Bottom-Line Duel
The following income statement comparison exposes the true operational efficiency and profitability dynamics of two leading restaurant chains.
Chipotle Mexican Grill, Inc. Analysis
Chipotle’s revenue surged from 7.5B in 2021 to 11.9B in 2025, reflecting strong growth momentum. Net income more than doubled, reaching 1.54B in 2025. Margins remain healthy, with a gross margin of 22.35% and net margin of 12.88%. Despite a slight gross profit dip in 2025, operational expenses grew in line with revenue, preserving earnings quality.
Domino’s Pizza, Inc. Analysis
Domino’s revenue climbed steadily from 4.1B in 2020 to 4.7B in 2024, with net income rising to 584M. The company boasts superior gross (39.28%) and EBIT margins (19.51%), indicating strong cost control. Margins and net income grew favorably over the year, although operating expenses slightly outpaced revenue growth, signaling margin pressure risks.
Margin Strength vs. Revenue Scale
Chipotle outpaces Domino’s in overall revenue and net income growth, driven by robust expansion and improving net margins. Domino’s, however, leads in profitability ratios, demonstrating superior operational efficiency. For investors, Chipotle offers a growth-oriented profile, while Domino’s appeals to those prioritizing margin stability and profitability.
Financial Ratios Comparison
These vital ratios act as a diagnostic tool to expose the underlying fiscal health, valuation premiums, and capital efficiency of each company:
| Ratios | Chipotle Mexican Grill, Inc. (CMG) | Domino’s Pizza, Inc. (DPZ) |
|---|---|---|
| ROE | 54.3% | -14.7% |
| ROIC | 18.9% | 54.1% |
| P/E | 32.2 | 25.0 |
| P/B | 17.5 | -3.69 |
| Current Ratio | 1.23 | 0.56 |
| Quick Ratio | 1.19 | 0.52 |
| D/E | 3.48 | -1.31 |
| Debt-to-Assets | 109.5% | 299.2% |
| Interest Coverage | 0 | 4.49 |
| Asset Turnover | 1.33 | 2.71 |
| Fixed Asset Turnover | 1.67 | 9.20 |
| Payout Ratio | 0 | 36.0% |
| Dividend Yield | 0 | 1.44% |
| Fiscal Year | 2025 | 2024 |
Efficiency & Valuation Duel: The Vital Signs
Financial ratios act as a company’s DNA, uncovering hidden risks and revealing operational excellence critical for investment decisions.
Chipotle Mexican Grill, Inc.
Chipotle shows strong profitability with a 54.3% ROE and favorable 12.9% net margin. Its valuation is stretched, marked by a 32.2 P/E and 17.5 P/B, signaling premium pricing. The firm offers no dividends, reinvesting heavily in operations instead. Debt levels remain high, but asset turnover efficiency supports its financial structure.
Domino’s Pizza, Inc.
Domino’s boasts a robust 54.1% ROIC and 12.4% net margin, but suffers from a negative -14.7% ROE, indicating shareholder returns strain. The P/E of 25.0 suggests a relatively cheaper valuation than Chipotle. Debt metrics are mixed, with unfavorable current and quick ratios. Domino’s delivers a modest 1.44% dividend yield, balancing growth with shareholder returns.
Premium Valuation vs. Operational Safety
Chipotle commands a premium valuation driven by superior equity returns and operational efficiency, but its debt levels pose caution. Domino’s offers attractive capital returns on invested capital and a dividend, despite weaker equity returns and liquidity concerns. Investors seeking growth may lean toward Chipotle, while those favoring income and stability might prefer Domino’s profile.
Which one offers the Superior Shareholder Reward?
I observe that Domino’s Pizza (DPZ) pays a consistent dividend with a yield near 1.4% and a payout ratio around 33-36%. This yield is modest but well-covered by free cash flow, with a healthy FCF/operating cash flow ratio above 80%. DPZ also maintains robust buybacks, enhancing total returns. Chipotle (CMG) opts against dividends, reinvesting heavily into growth and innovation. CMG’s free cash flow yield is lower, reflecting its growth focus, and buyback activity is minimal or absent. Historically in fast-casual dining, dividend payers like DPZ offer more tangible shareholder rewards, especially in a mature market. I find DPZ’s balanced distribution—dividends plus buybacks—more sustainable and attractive for income and total return investors in 2026.
Comparative Score Analysis: The Strategic Profile
The radar chart reveals the fundamental DNA and trade-offs of Chipotle Mexican Grill, Inc. and Domino’s Pizza, Inc., highlighting their core financial strengths and vulnerabilities:
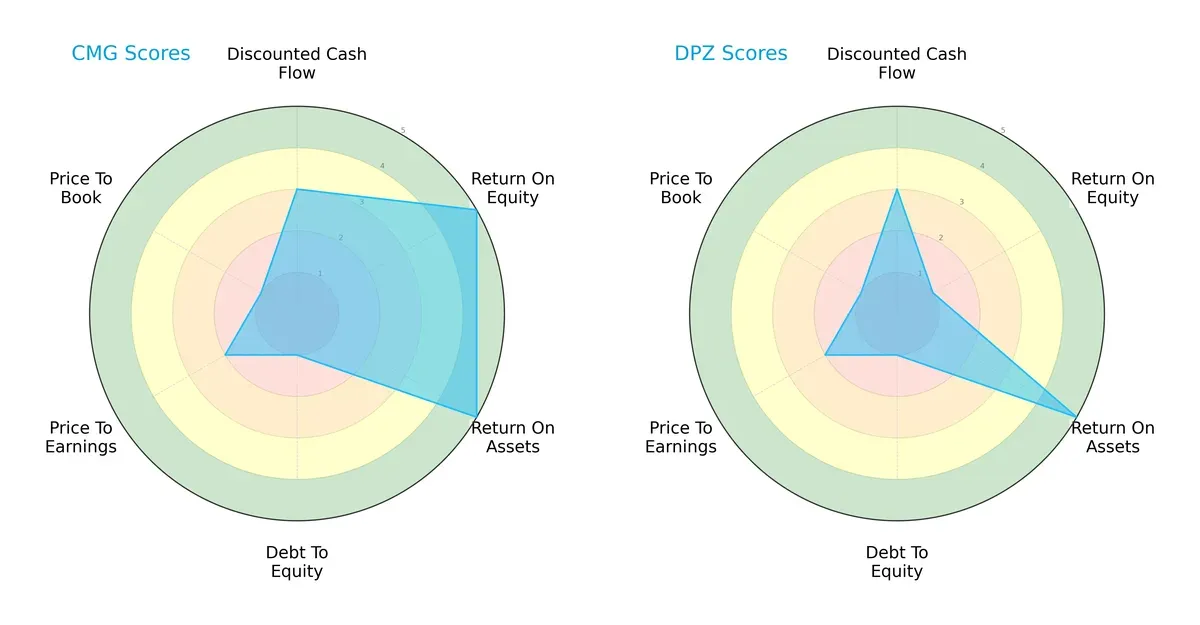
Chipotle (CMG) shows a balanced profile with strong ROE (5) and ROA (5) scores, signaling efficient profit generation and asset use. Domino’s (DPZ) matches CMG on ROA (5) but lags significantly on ROE (1), indicating weaker equity profitability. Both firms share very unfavorable debt-to-equity (1) and price-to-book (1) scores, suggesting elevated financial leverage and valuation concerns. CMG edges out with a better overall score (3 vs. 2) and a moderate DCF score (3) compared to DPZ’s moderate DCF (3) but less favorable equity returns, making CMG the more balanced choice.
—
Bankruptcy Risk: Solvency Showdown
The Altman Z-Score gap between CMG (7.41) and DPZ (3.17) illustrates differing solvency risks in today’s cycle:
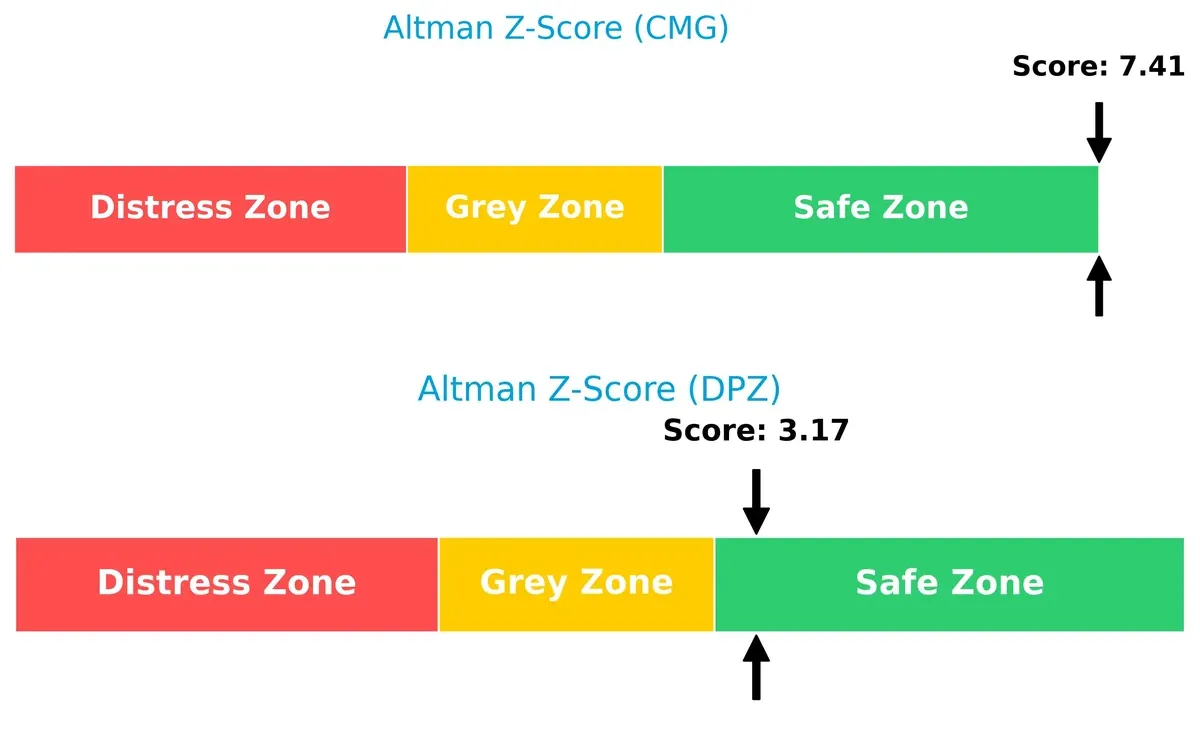
Both companies operate safely above the distress threshold, but CMG’s significantly higher Z-score signals a robust buffer against bankruptcy risk. DPZ remains in the safe zone but with a thinner margin, reflecting moderate vulnerability if market conditions deteriorate.
—
Financial Health: Quality of Operations
Piotroski F-Scores reveal contrasting internal financial health profiles between the two firms:
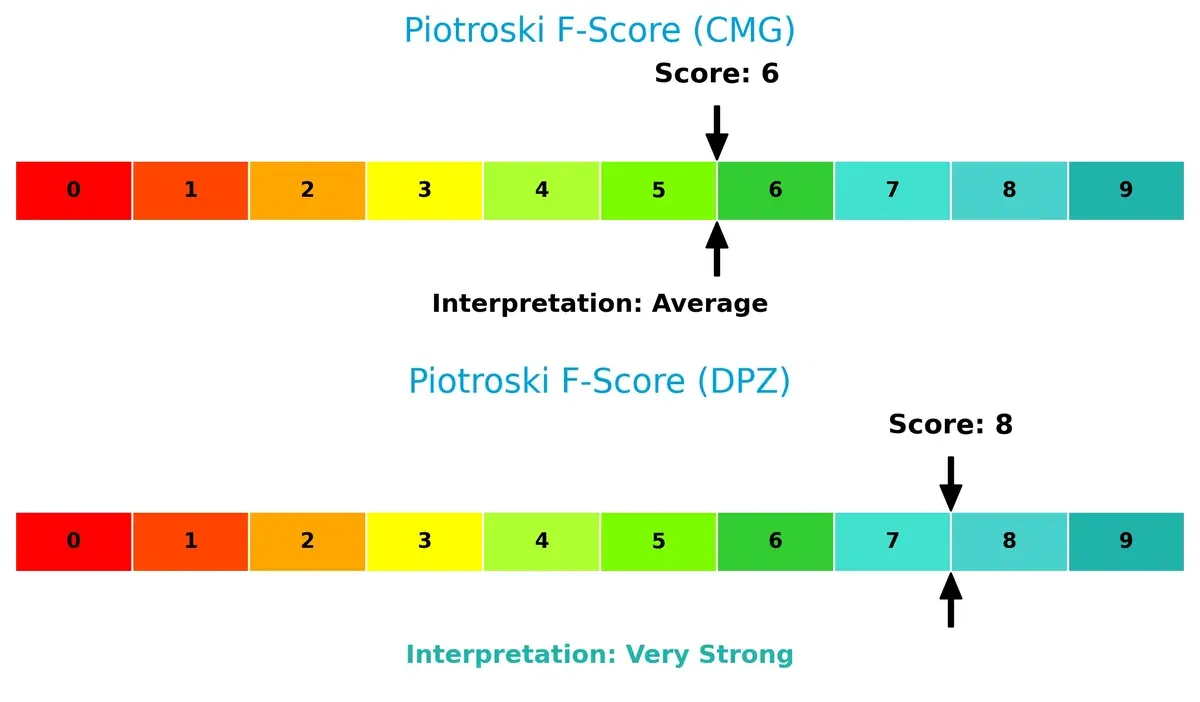
DPZ’s score of 8 indicates very strong operational quality and financial discipline. CMG’s 6, while average, flags some internal weaknesses relative to DPZ. Investors should view CMG’s score cautiously as it suggests areas for improvement in profitability, leverage, or liquidity metrics compared to its peer.
How are the two companies positioned?
This section dissects the operational DNA of Chipotle and Domino’s by comparing their revenue distribution and internal dynamics. The goal is to confront their economic moats and identify which model delivers the most resilient competitive advantage today.
Revenue Segmentation: The Strategic Mix
This visual comparison dissects how Chipotle Mexican Grill and Domino’s Pizza diversify their income streams and where their primary sector bets lie:
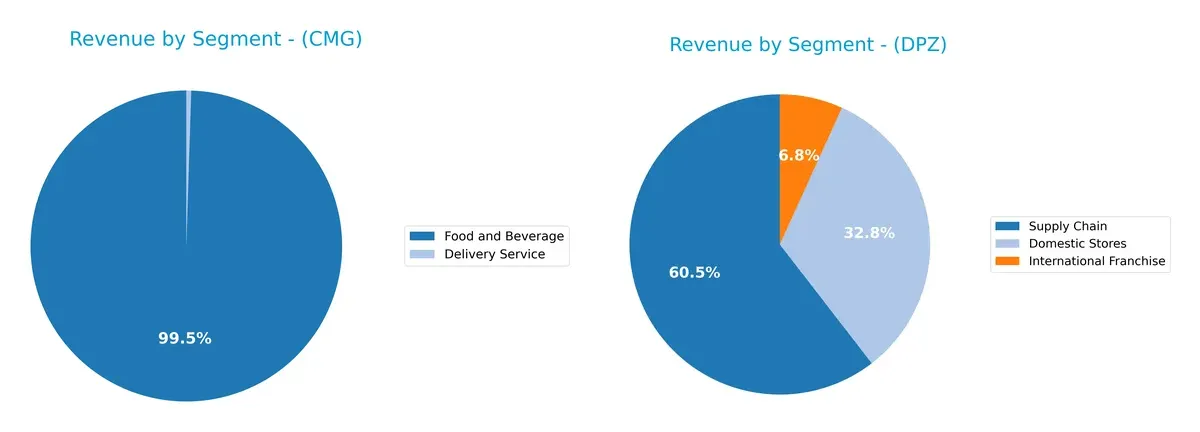
Chipotle’s revenue overwhelmingly anchors on Food and Beverage, generating $11.87B in 2025, with Delivery Service contributing a modest $60M. Domino’s showcases a more diversified mix: Supply Chain leads with $2.85B, Domestic Stores follow at $1.54B, and International Franchise adds $319M. Domino’s multi-segment approach reduces concentration risk. Chipotle’s reliance on one core segment suggests strong product focus but higher vulnerability to market shifts.
Strengths and Weaknesses Comparison
This table compares the Strengths and Weaknesses of Chipotle Mexican Grill, Inc. (CMG) and Domino’s Pizza, Inc. (DPZ):
CMG Strengths
- High ROE at 54.26%
- Favorable ROIC at 18.93% above WACC
- Strong net margin of 12.88%
- Quick ratio at 1.19 indicates liquidity
- Consistent U.S. revenue growth
- Solid asset turnover at 1.33
DPZ Strengths
- Exceptional ROIC at 54.1% well above WACC
- Strong asset turnover at 2.71
- High fixed asset turnover at 9.2
- Favorable PB ratio
- Diverse revenue streams: Domestic Stores, International Franchise, Supply Chain
- Dividend yield of 1.44%
CMG Weaknesses
- Elevated debt-to-assets ratio at 109.5%
- High debt-to-equity ratio of 3.48
- Unfavorable PE at 32.22 and PB at 17.48
- No dividend yield
- Moderate current ratio at 1.23
- Lower fixed asset turnover neutral at 1.67
DPZ Weaknesses
- Negative ROE at -14.74%
- Low current and quick ratios at 0.56 and 0.52 respectively
- High debt-to-assets ratio at 299.21%
- Unfavorable PE at 25.01
- Interest coverage only neutral at 4.69
Both companies show strengths in efficient capital use, highlighted by strong ROIC exceeding WACC. CMG excels in profitability metrics and liquidity, while DPZ benefits from operational efficiency and diversified revenue. However, both face significant leverage concerns that could constrain flexibility. These financial profiles suggest focused strategies to address capital structure risks while leveraging operational strengths.
The Moat Duel: Analyzing Competitive Defensibility
A structural moat is the only defense protecting long-term profits from relentless competitive erosion. Let’s dissect how each company guards its turf:
Chipotle Mexican Grill, Inc.: Intangible Assets and Operational Excellence
Chipotle’s moat stems from strong brand loyalty and streamlined operations, reflected in a 12.9% net margin and a growing ROIC exceeding WACC by 11.3%. Expansion into new markets deepens its moat, though margin pressure from input costs remains a risk.
Domino’s Pizza, Inc.: Cost Advantage with Scale
Domino’s leverages a cost advantage through an optimized delivery network and franchising. Its gross margin of 39.3% and ROIC well above WACC confirm efficient capital use. Yet, a declining ROIC trend signals potential challenges in sustaining this edge long-term.
Brand Loyalty vs. Cost Leadership: The Moat Showdown
Chipotle’s expanding intangible asset moat offers deeper, more sustainable competitive protection than Domino’s cost-based advantage, which faces margin compression risks. I see Chipotle better positioned to defend and grow its market share in 2026.
Which stock offers better returns?
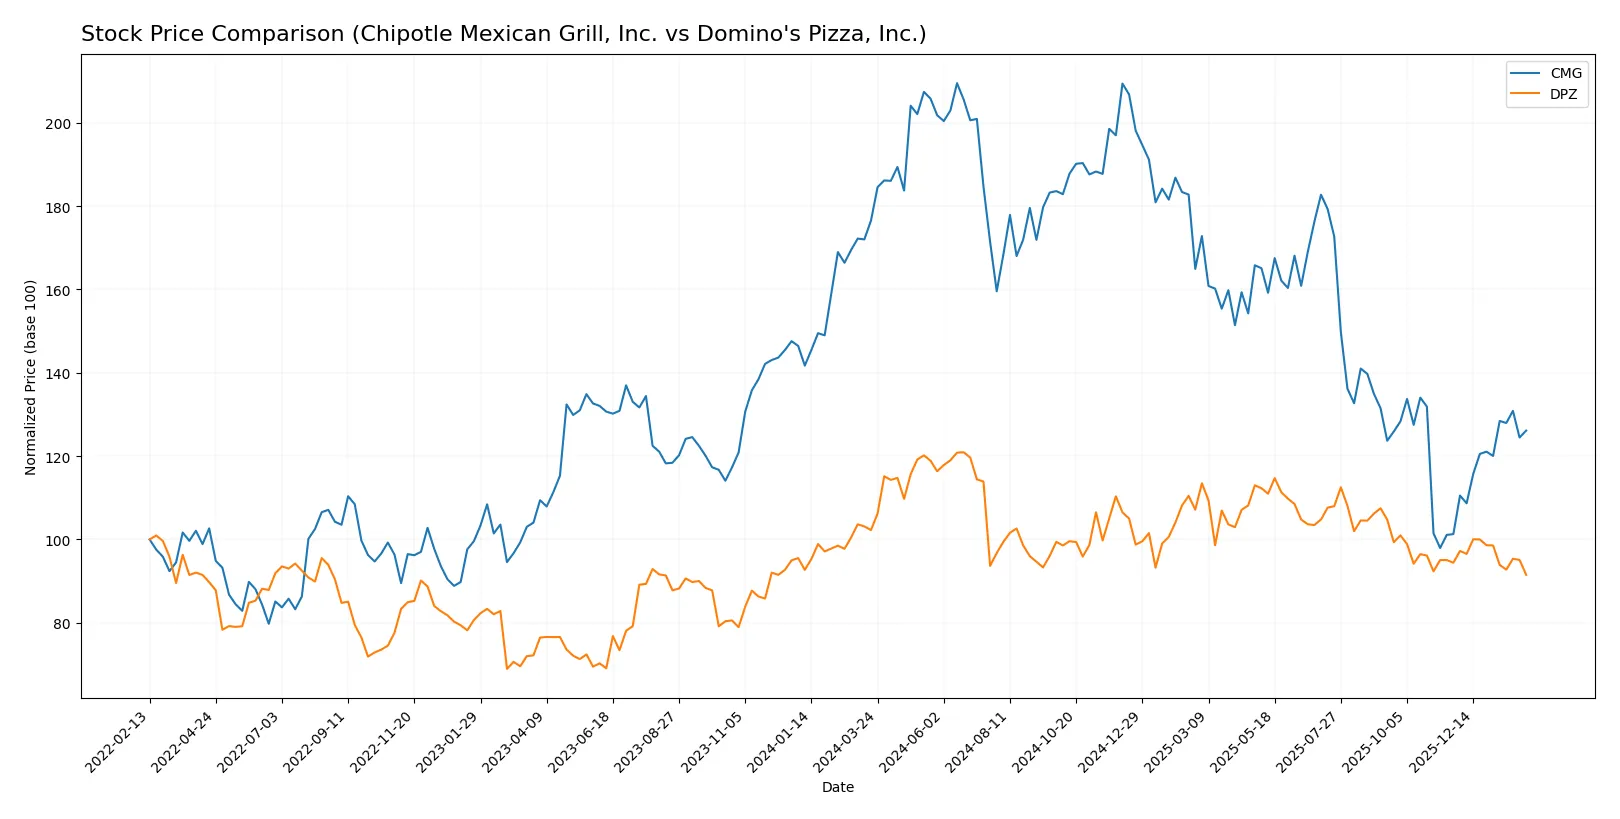
Over the past 12 months, Chipotle Mexican Grill and Domino’s Pizza exhibited contrasting price dynamics, with notable volatility and shifting buyer dominance in recent months.
Trend Comparison
Chipotle Mexican Grill’s stock fell 28.55% over the past year, signaling a bearish trend with accelerating decline and moderate volatility (9.32 std deviation). The price ranged from a high of 65.43 to a low of 30.59.
Domino’s Pizza’s stock decreased 10.5% over the same period, marking a bearish trend with decelerating losses and higher volatility (33.53 std deviation). The price fluctuated between 521.83 and 394.88.
Comparing both, Chipotle experienced a steeper decline but recent months show strong buyer dominance, while Domino’s faced milder losses with seller dominance recently. Chipotle delivered the lower market performance over 12 months.
Target Prices
Analysts present a moderate upside potential for both Chipotle Mexican Grill and Domino’s Pizza based on current consensus targets.
| Company | Target Low | Target High | Consensus |
|---|---|---|---|
| Chipotle Mexican Grill, Inc. | 35 | 52 | 44.35 |
| Domino’s Pizza, Inc. | 370 | 535 | 463.33 |
The consensus target for Chipotle stands about 13% above its current price of 39.39, implying modest growth expectations. Domino’s target consensus exceeds its current 394.88 price by roughly 17%, signaling stronger analyst confidence in its appreciation potential.

Don’t Let Luck Decide Your Entry Point
Optimize your entry points with our advanced ProRealTime indicators. You’ll get efficient buy signals with precise price targets for maximum performance. Start outperforming now!
How do institutions grade them?
Below is the comparison of institutional grades for Chipotle Mexican Grill, Inc. and Domino’s Pizza, Inc.:
Chipotle Mexican Grill, Inc. Grades
The following table lists recent grades from notable grading companies for Chipotle Mexican Grill:
| Grading Company | Action | New Grade | Date |
|---|---|---|---|
| Argus Research | Maintain | Hold | 2026-02-05 |
| TD Cowen | Maintain | Buy | 2026-02-04 |
| Morgan Stanley | Maintain | Overweight | 2026-02-04 |
| Keybanc | Maintain | Overweight | 2026-02-04 |
| Piper Sandler | Maintain | Overweight | 2026-02-04 |
| Mizuho | Maintain | Neutral | 2026-02-04 |
| BTIG | Maintain | Buy | 2026-02-04 |
| Citigroup | Maintain | Buy | 2026-02-04 |
| Stifel | Maintain | Buy | 2026-02-04 |
| Barclays | Maintain | Equal Weight | 2026-02-04 |
Domino’s Pizza, Inc. Grades
The following table lists recent grades from notable grading companies for Domino’s Pizza:
| Grading Company | Action | New Grade | Date |
|---|---|---|---|
| Guggenheim | Maintain | Neutral | 2026-01-28 |
| Wells Fargo | Maintain | Equal Weight | 2026-01-22 |
| Morgan Stanley | Downgrade | Equal Weight | 2026-01-20 |
| Evercore ISI Group | Maintain | Outperform | 2026-01-08 |
| Barclays | Maintain | Underweight | 2026-01-07 |
| Stifel | Maintain | Buy | 2026-01-07 |
| TD Cowen | Downgrade | Hold | 2026-01-05 |
| BTIG | Maintain | Buy | 2025-11-14 |
| BTIG | Maintain | Buy | 2025-10-15 |
| RBC Capital | Maintain | Sector Perform | 2025-10-15 |
Which company has the best grades?
Chipotle Mexican Grill holds consistently higher grades, with multiple “Buy” and “Overweight” ratings. Domino’s shows mixed ratings, including downgrades. Investors may view Chipotle as more favored by analysts.
Risks specific to each company
The following categories identify the critical pressure points and systemic threats facing both firms in the 2026 market environment:
1. Market & Competition
Chipotle Mexican Grill, Inc. (CMG)
- Faces intense competition in the fast-casual segment, with pressure from new entrants and evolving consumer preferences.
Domino’s Pizza, Inc. (DPZ)
- Strong franchise model supports scale but faces stiff competition from delivery-centric platforms and local pizza chains.
2. Capital Structure & Debt
Chipotle Mexican Grill, Inc. (CMG)
- High debt-to-assets ratio at 109.5%, signaling aggressive leverage and financial risk.
Domino’s Pizza, Inc. (DPZ)
- Debt-to-assets at 299.21%, indicating even greater leverage concerns and potential solvency risks.
3. Stock Volatility
Chipotle Mexican Grill, Inc. (CMG)
- Beta near 1.0 (0.996) suggests stock moves closely with the market, moderate volatility.
Domino’s Pizza, Inc. (DPZ)
- Higher beta of 1.167 indicates greater stock price swings and market sensitivity.
4. Regulatory & Legal
Chipotle Mexican Grill, Inc. (CMG)
- Subject to food safety regulations with occasional recalls impacting reputation.
Domino’s Pizza, Inc. (DPZ)
- Also exposed to food safety regulations; franchise operations add complexity to compliance.
5. Supply Chain & Operations
Chipotle Mexican Grill, Inc. (CMG)
- Supply chain disruptions can affect fresh ingredient availability, critical for brand promise.
Domino’s Pizza, Inc. (DPZ)
- Relies on a robust supply chain for franchise support; vulnerability to cost inflation and logistics delays.
6. ESG & Climate Transition
Chipotle Mexican Grill, Inc. (CMG)
- Faces pressure to improve sustainability practices, particularly in sourcing and packaging.
Domino’s Pizza, Inc. (DPZ)
- ESG initiatives ongoing but lag behind peers; franchise model complicates uniform ESG adoption.
7. Geopolitical Exposure
Chipotle Mexican Grill, Inc. (CMG)
- Operations in multiple countries expose CMG to foreign exchange and geopolitical risks.
Domino’s Pizza, Inc. (DPZ)
- International franchise presence spreads geopolitical risk but also adds complexity and currency exposure.
Which company shows a better risk-adjusted profile?
Chipotle’s most impactful risk is its high leverage, which raises financial vulnerability despite strong operational metrics. Domino’s faces extreme leverage and weaker liquidity ratios, heightening solvency concerns. Chipotle’s stable beta and safer Altman Z-score suggest a superior risk-adjusted profile, despite competitive challenges. Domino’s higher stock volatility and weaker return on equity deepen my caution.
Final Verdict: Which stock to choose?
Chipotle Mexican Grill’s superpower lies in its ability to generate robust returns on invested capital well above its cost of capital, signaling a durable competitive edge. However, its elevated leverage and premium valuation are points of vigilance. It fits well in portfolios seeking aggressive growth with tolerance for financial risk.
Domino’s Pizza boasts a strategic moat through exceptional operational efficiency and strong asset turnover, delivering solid cash flow generation. Compared to Chipotle, it offers a more stable income profile but faces challenges in profitability trends and liquidity. It suits investors focused on growth at a reasonable price with a preference for operational resilience.
If you prioritize aggressive growth backed by sustainable value creation, Chipotle outshines due to its expanding profitability and strong ROIC trajectory. However, if you seek more stability with operational efficiency and cash flow consistency, Domino’s offers better risk-adjusted stability despite some earnings headwinds. Both present compelling but distinct analytical scenarios depending on investor risk appetite and strategy.
Disclaimer: Investment carries a risk of loss of initial capital. The past performance is not a reliable indicator of future results. Be sure to understand risks before making an investment decision.
Go Further
I encourage you to read the complete analyses of Chipotle Mexican Grill, Inc. and Domino’s Pizza, Inc. to enhance your investment decisions: