Home > Comparison > Consumer Cyclical > CMG vs DRI
The strategic rivalry between Chipotle Mexican Grill, Inc. and Darden Restaurants, Inc. shapes the competitive landscape in the restaurant sector. Chipotle operates a fast-casual, growth-focused model with approximately 3,000 locations internationally. In contrast, Darden manages a diversified portfolio of full-service restaurants, emphasizing steady cash flow and dividend returns. This analysis will assess which company presents a superior risk-adjusted opportunity for a balanced, diversified portfolio.
Table of contents
Companies Overview
Chipotle Mexican Grill and Darden Restaurants stand as influential players in the competitive restaurant industry.
Chipotle Mexican Grill, Inc.: Pioneer of Fast-Casual Mexican Dining
Chipotle leads the fast-casual Mexican segment with approximately 3,000 locations across North America and Europe. Its core revenue stems from company-operated restaurants emphasizing fresh ingredients and customizable meals. In 2026, Chipotle focuses on expanding its digital platform and enhancing delivery to capture evolving consumer preferences.
Darden Restaurants, Inc.: Full-Service Dining Powerhouse
Darden operates nearly 1,900 full-service restaurants across multiple brands, including Olive Garden and LongHorn Steakhouse. The company generates revenue mainly through a diversified portfolio of casual and upscale dining experiences. Its strategic focus in 2026 centers on optimizing brand mix and improving guest experience to sustain steady traffic and profitability.
Strategic Collision: Similarities & Divergences
Both companies thrive in the restaurant sector but adopt contrasting models: Chipotle’s fast-casual, tech-driven approach versus Darden’s multi-brand full-service strategy. Their primary battleground is customer engagement through menu innovation and service delivery. Chipotle offers growth potential through digital expansion; Darden delivers stability via brand diversification and dividend payouts.
Income Statement Comparison
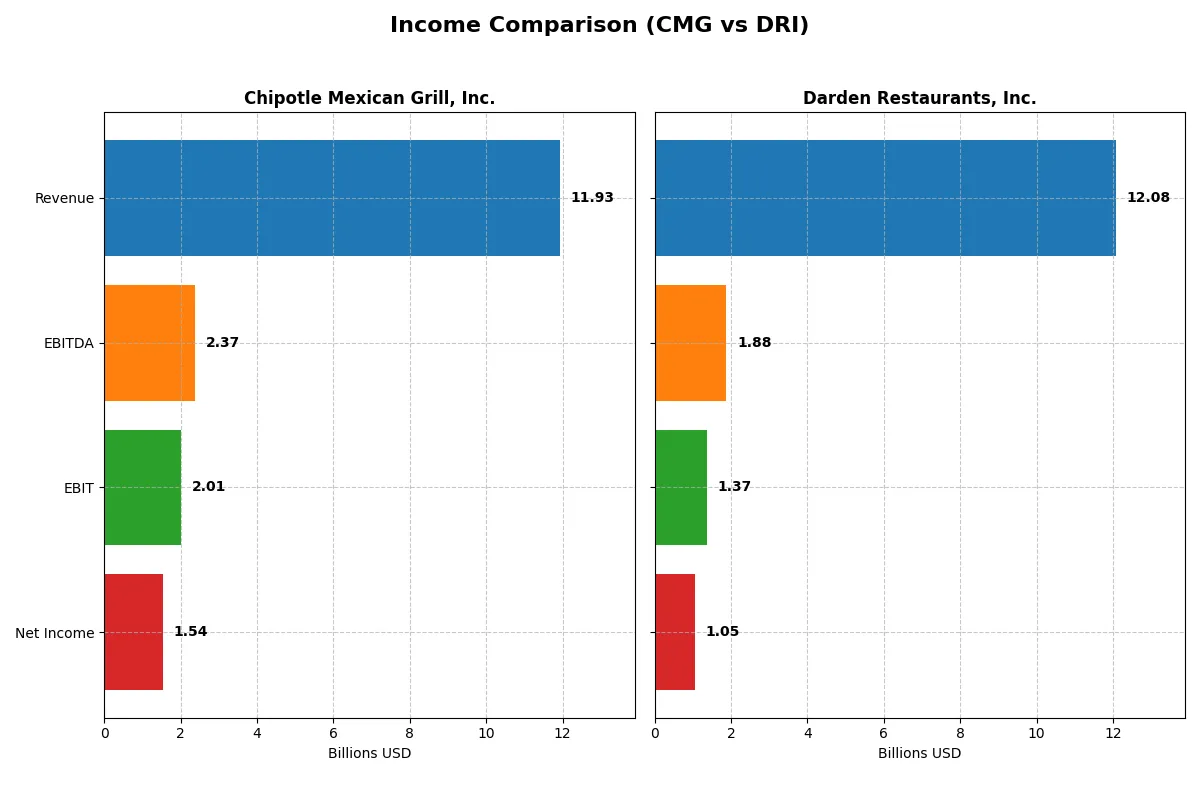
This data dissects the core profitability and scalability of both corporate engines to reveal who dominates the bottom line:
| Metric | Chipotle Mexican Grill, Inc. (CMG) | Darden Restaurants, Inc. (DRI) |
|---|---|---|
| Revenue | 11.93B | 12.08B |
| Cost of Revenue | 9.26B | 9.43B |
| Operating Expenses | 656M | 1.28B |
| Gross Profit | 2.66B | 2.64B |
| EBITDA | 2.37B | 1.88B |
| EBIT | 2.01B | 1.37B |
| Interest Expense | 0 | 180M |
| Net Income | 1.54B | 1.05B |
| EPS | 1.15 | 8.93 |
| Fiscal Year | 2025 | 2025 |
Income Statement Analysis: The Bottom-Line Duel
This income statement comparison reveals which company operates with superior efficiency and stronger profitability in a competitive restaurant sector.
Chipotle Mexican Grill, Inc. Analysis
Chipotle’s revenue rose steadily from 7.5B in 2021 to 11.9B in 2025, with net income soaring 135% over five years to 1.54B. Gross and net margins remain robust at 22.4% and 12.9%, respectively. Despite a slight gross profit dip in 2025, the company maintains strong operating margins and EPS growth, signaling resilient momentum.
Darden Restaurants, Inc. Analysis
Darden’s revenue expanded from 7.2B in 2021 to 12.1B in 2025, with net income climbing nearly 67% to 1.05B. Gross margin at 21.9% and net margin at 8.7% show solid profitability, though lower than Chipotle’s. Operating expenses grew faster than revenue, pressuring margin expansion despite steady EBIT and EPS growth, reflecting efficiency challenges.
Margin Strength vs. Revenue Expansion
Chipotle leads with higher margins and a stronger net income growth rate, reflecting superior cost control and capital efficiency. Darden delivers impressive revenue growth but faces margin compression due to rising expenses. For investors prioritizing profitability and margin resilience, Chipotle’s profile stands out as more compelling in the current market environment.
Financial Ratios Comparison
These vital ratios act as a diagnostic tool to expose the underlying fiscal health, valuation premiums, and capital efficiency of each company:
| Ratios | Chipotle Mexican Grill, Inc. (CMG) | Darden Restaurants, Inc. (DRI) |
|---|---|---|
| ROE | 54.3% | 45.4% |
| ROIC | 18.9% | 11.4% |
| P/E | 32.2 | 22.8 |
| P/B | 17.5 | 10.4 |
| Current Ratio | 1.23 | 0.42 |
| Quick Ratio | 1.19 | 0.28 |
| D/E (Debt-to-Equity) | 3.48 | 2.70 |
| Debt-to-Assets | 110%* | 49.5% |
| Interest Coverage | 0 | 7.55 |
| Asset Turnover | 1.33 | 0.96 |
| Fixed Asset Turnover | 1.67 | 1.46 |
| Payout Ratio | 0% | 63% |
| Dividend Yield | 0% | 2.75% |
| Fiscal Year | 2025 | 2025 |
*Note: Chipotle’s debt-to-assets ratio above 100% is unusual and signals potential classification or reporting issues; it merits cautious interpretation.
Efficiency & Valuation Duel: The Vital Signs
Ratios act as a company’s DNA, revealing hidden risks and operational excellence critical to investor decision-making.
Chipotle Mexican Grill, Inc.
Chipotle posts a stellar 54.3% ROE and strong 12.9% net margin, signaling exceptional profitability. However, its P/E at 32.2 and P/B at 17.5 mark the stock as expensive. The company pays no dividend, choosing instead to reinvest heavily into growth and operational efficiency, reflected in its high asset turnover and robust returns on invested capital.
Darden Restaurants, Inc.
Darden delivers a solid 45.4% ROE with an 8.7% net margin, demonstrating efficient capital use but lower profitability than Chipotle. Its P/E of 22.8 is more moderate, though the P/B ratio of 10.4 remains stretched. Darden offers a 2.75% dividend yield, balancing shareholder returns with moderate leverage and neutral liquidity ratios, suggesting a more conservative capital allocation approach.
Premium Valuation vs. Operational Safety
Chipotle commands a premium valuation backed by superior profitability and reinvestment strategy, but with elevated leverage risks. Darden offers a steadier profile with dividends and moderate valuation, though profitability lags. Growth-focused investors may prefer Chipotle’s aggressive model, while income-oriented investors might favor Darden’s balance of yield and risk.
Which one offers the Superior Shareholder Reward?
Chipotle Mexican Grill (CMG) pays no dividends but aggressively reinvests in growth and share buybacks, with free cash flow per share around 1.08 and strong operating margins near 16.8%. Darden Restaurants (DRI) offers a 2.7% dividend yield, payout ratio ~63%, and solid buybacks, supported by free cash flow per share of 8.8. CMG’s reinvestment fuels higher growth potential but with elevated leverage and valuation (P/E ~32). DRI’s balanced dividend and buyback approach provide reliable income and moderate growth, but weaker margins (~11.3%) and liquidity (current ratio 0.42) raise sustainability concerns. I find DRI’s shareholder rewards more attractive in 2026 due to steady income and capital return, despite CMG’s growth allure.
Comparative Score Analysis: The Strategic Profile
The radar chart reveals the fundamental DNA and trade-offs of both firms, highlighting their unique financial strengths and vulnerabilities:
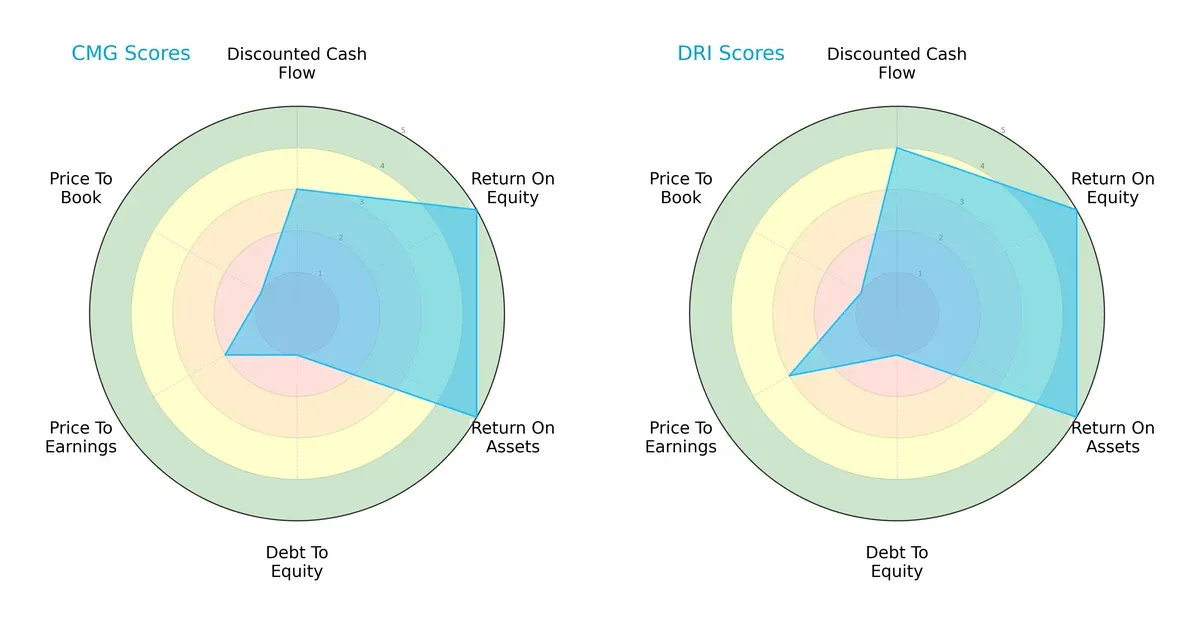
Chipotle Mexican Grill (CMG) and Darden Restaurants (DRI) both score very high on ROE and ROA, demonstrating operational efficiency. DRI edges CMG on discounted cash flow, signaling better valuation prospects. Both firms show weak debt-to-equity scores, indicating high leverage risk. DRI’s price-to-earnings score outperforms CMG’s, suggesting a more reasonable market valuation. Overall, DRI presents a more balanced and slightly more favorable financial profile, while CMG relies heavily on operational efficiency amid valuation and leverage challenges.
Bankruptcy Risk: Solvency Showdown
The Altman Z-Score delta indicates a stark difference in solvency risk between the two companies:
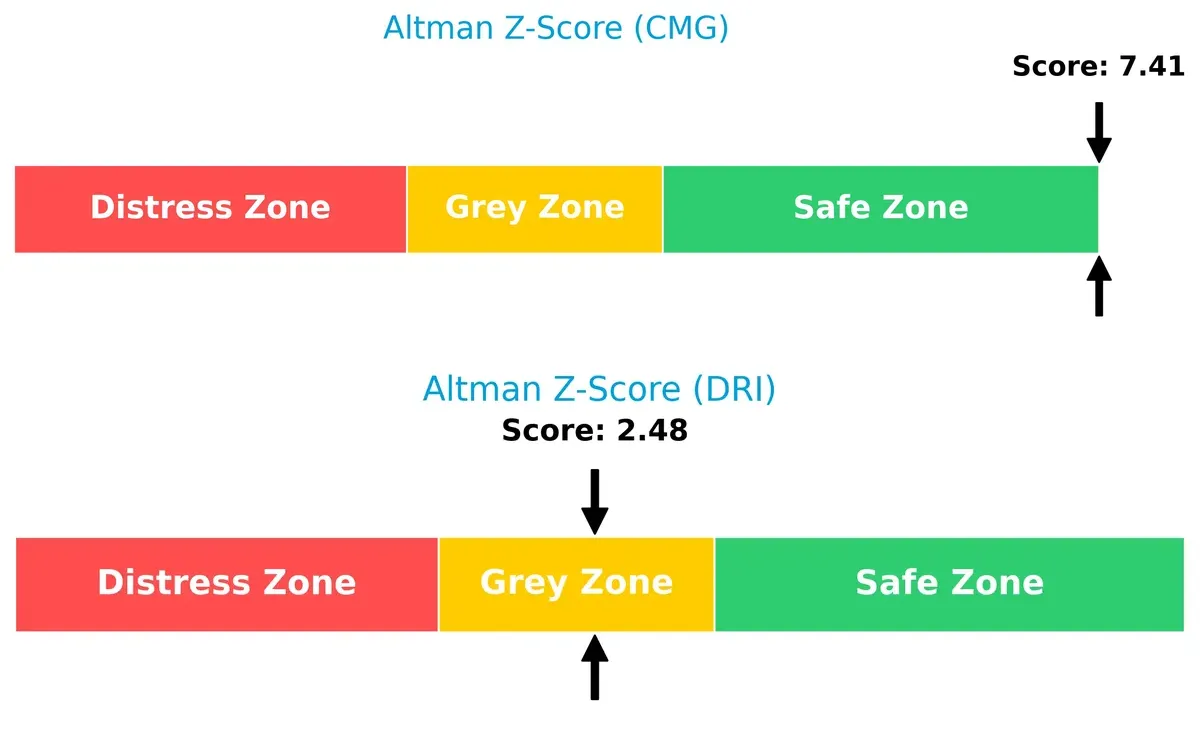
CMG’s score of 7.4 places it firmly in the safe zone, signaling strong long-term survival potential. DRI’s 2.5 falls into the grey zone, implying moderate bankruptcy risk and caution for investors in this economic cycle.
Financial Health: Quality of Operations
Piotroski F-Scores demonstrate internal financial robustness and operational quality differences:
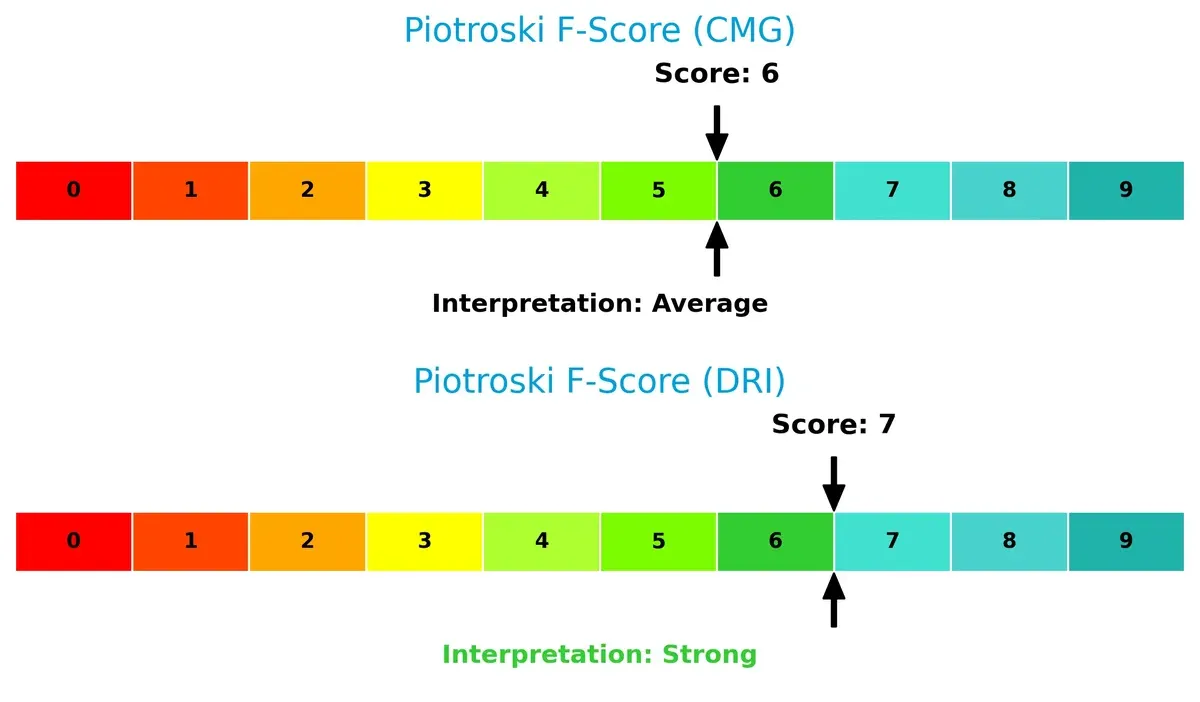
DRI’s score of 7 reflects strong financial health and efficient management, whereas CMG’s 6 is average, suggesting some operational red flags. DRI’s edge implies better internal controls and financial discipline, which is crucial during market volatility.
How are the two companies positioned?
This section dissects the operational DNA of Chipotle and Darden by comparing revenue distribution and their internal strengths and weaknesses. The goal is to confront their economic moats and determine which model offers the most resilient competitive advantage today.
Revenue Segmentation: The Strategic Mix
The following visual comparison dissects how Chipotle Mexican Grill and Darden Restaurants diversify their income streams and where their primary sector bets lie:
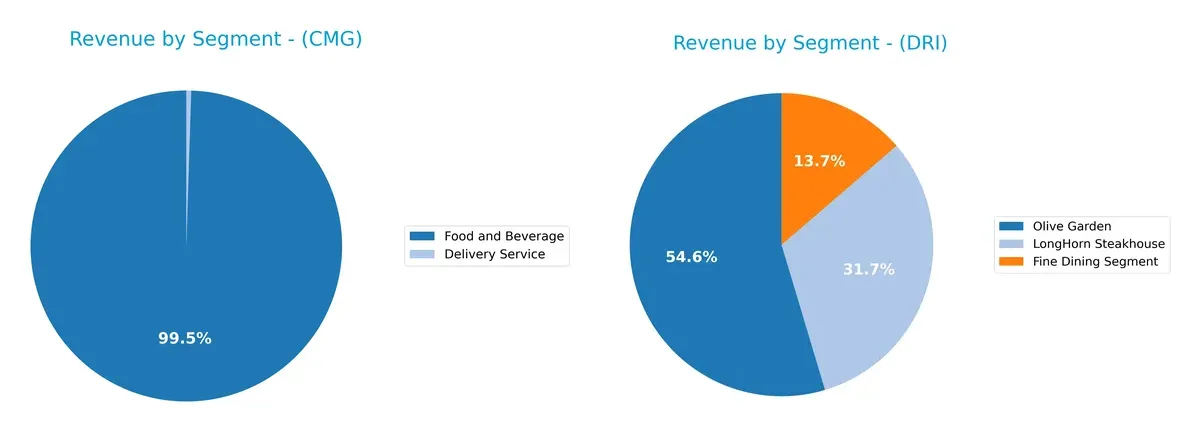
Chipotle anchors its revenue with $11.87B from Food and Beverage, while Delivery Service contributes a modest $59.5M, showing a concentrated but focused model. Darden, by contrast, spreads $9.54B across Olive Garden, LongHorn Steakhouse, and Fine Dining, reflecting a diversified portfolio. Chipotle’s reliance on a dominant segment risks volatility, whereas Darden leverages ecosystem lock-in through multiple dining brands.
Strengths and Weaknesses Comparison
This table compares the Strengths and Weaknesses of Chipotle Mexican Grill, Inc. and Darden Restaurants, Inc.:
Chipotle Mexican Grill, Inc. Strengths
- Strong profitability with 12.88% net margin and 54.26% ROE
- Favorable ROIC at 18.93% beating WACC at 7.59%
- Solid quick ratio of 1.19 indicates liquidity
- High asset turnover at 1.33 reflects efficient use of assets
- Large U.S. revenue base of $11.68B
Darden Restaurants, Inc. Strengths
- Favorable ROE at 45.41% and ROIC at 11.4% above WACC of 6.02%
- Positive interest coverage at 7.57 supports debt servicing
- Dividend yield of 2.75% offers shareholder income
- Diversified revenue streams including fine dining and casual segments
- Steady presence in multiple restaurant brands
Chipotle Mexican Grill, Inc. Weaknesses
- High debt to assets ratio at 109.5% signals financial risk
- Elevated debt to equity at 3.48 increases leverage concerns
- Unfavorable P/E of 32.22 and P/B of 17.48 imply expensive valuation
- Zero dividend yield could deter income-focused investors
- Moderate current ratio of 1.23 suggests tight short-term liquidity
Darden Restaurants, Inc. Weaknesses
- Low current ratio at 0.42 and quick ratio at 0.28 indicate liquidity strain
- Debt to equity at 2.7 remains high, raising solvency questions
- Neutral net margin at 8.69% lags industry leaders
- Unfavorable P/B at 10.37 suggests valuation pressure
- Asset turnover below 1.0 at 0.96 shows less efficient asset use
Chipotle demonstrates superior profitability and asset efficiency but carries heavy financial leverage and valuation risk. Darden shows diversified revenue and shareholder returns but faces liquidity challenges and lower operational efficiency. Both companies exhibit slightly favorable financial profiles with distinct strategic trade-offs.
The Moat Duel: Analyzing Competitive Defensibility
A structural moat is the only barrier that protects long-term profits from relentless competition erosion. Let’s dissect the moats of two restaurant giants:
Chipotle Mexican Grill, Inc.: Scalable Brand and Operational Efficiency
Chipotle’s moat stems from strong brand loyalty and cost advantages, reflected in an expanding ROIC exceeding WACC by 11.3%. Margin stability and operational scale support growth in new markets through digital innovation in 2026.
Darden Restaurants, Inc.: Diversified Brand Portfolio and Scale Advantage
Darden’s competitive edge lies in its diverse portfolio of full-service restaurant brands, delivering steady ROIC growth and value creation, though its margin expansion trails Chipotle’s. Expansion in premium dining segments offers fresh upside in 2026.
The Moat Battle: High-Return Brand Loyalty vs. Diversified Scale
Chipotle’s wider moat combines high ROIC and margin expansion, signaling stronger value creation than Darden’s steady but narrower moat. Chipotle stands better poised to defend and grow market share amid rising competition.
Which stock offers better returns?
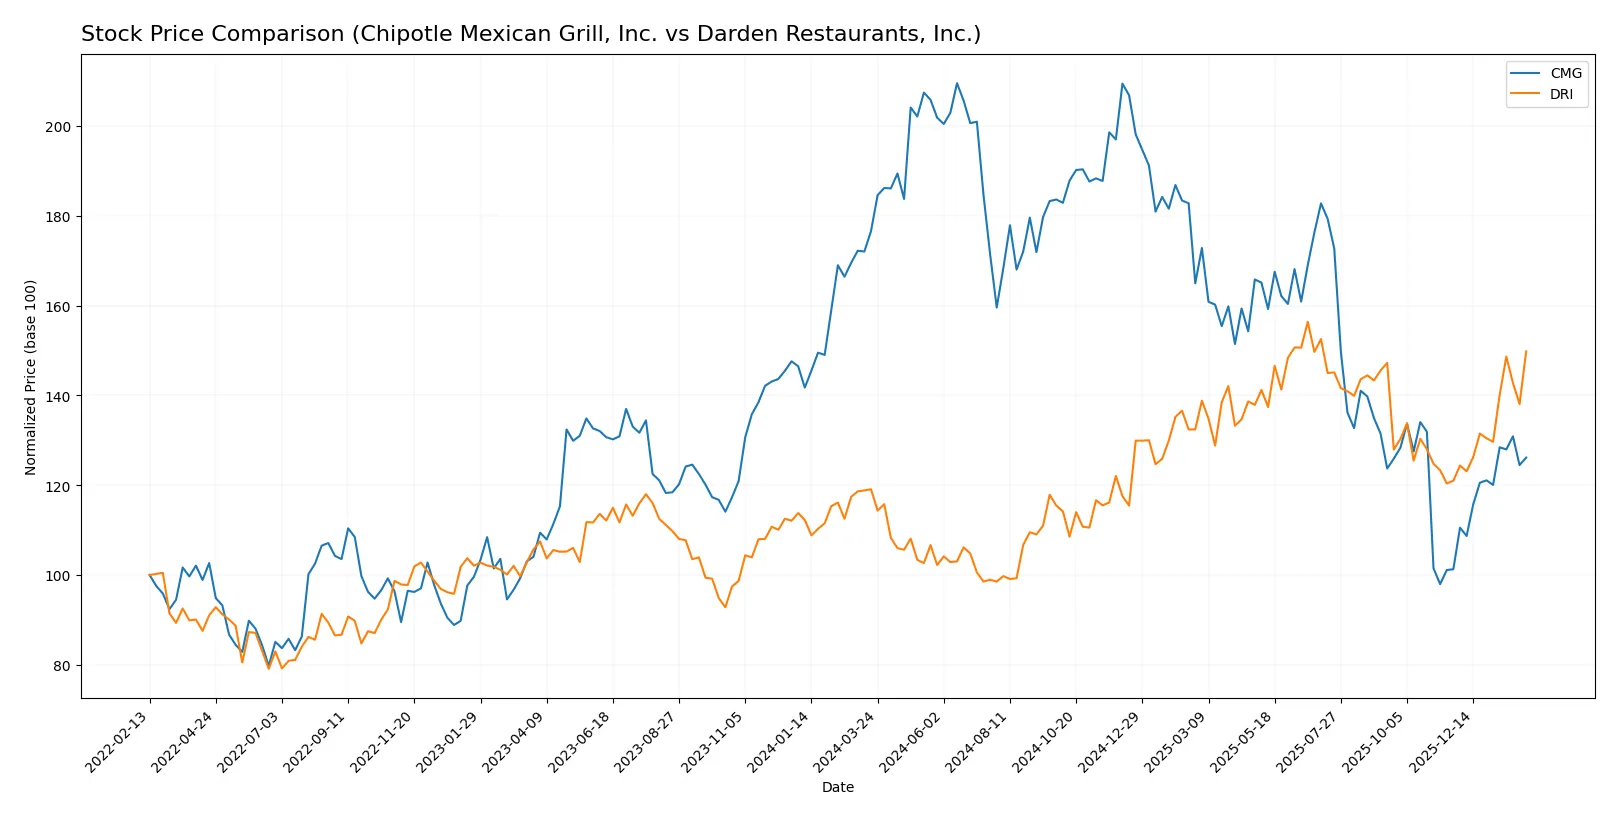
Over the past year, Chipotle Mexican Grill, Inc. and Darden Restaurants, Inc. displayed sharply contrasting price movements, revealing divergent trading dynamics and momentum shifts.
Trend Comparison
Chipotle Mexican Grill, Inc. experienced a bearish overall trend with a -28.55% price decline over 12 months, accelerating downward from a high of 65.43 to a low of 30.59. Recently, it saw a strong bullish reversal, gaining 24.53% over about two and a half months.
Darden Restaurants, Inc. exhibited a bullish trend with a 25.77% price increase over 12 months, showing acceleration and wide volatility between 142.27 and 225.78. Its recent trend sustained momentum with a 23.78% rise and a steeper slope.
Comparing these trends, Darden Restaurants delivered the highest market performance with consistent gains, while Chipotle suffered a steep annual loss despite recent recovery efforts.
Target Prices
Analysts present a clear target price range for both Chipotle Mexican Grill and Darden Restaurants, reflecting moderate upside potential.
| Company | Target Low | Target High | Consensus |
|---|---|---|---|
| Chipotle Mexican Grill, Inc. | 35 | 52 | 44.35 |
| Darden Restaurants, Inc. | 200 | 265 | 221.94 |
The consensus target for Chipotle at 44.35 implies about a 13% upside from the current 39.39 price. Darden’s 221.94 target suggests a modest 3% upside versus its 216.27 price. Both indicate cautious optimism from analysts.

Don’t Let Luck Decide Your Entry Point
Optimize your entry points with our advanced ProRealTime indicators. You’ll get efficient buy signals with precise price targets for maximum performance. Start outperforming now!
How do institutions grade them?
Chipotle Mexican Grill, Inc. Grades
The table below summarizes recent grade actions from key grading institutions for Chipotle Mexican Grill:
| Grading Company | Action | New Grade | Date |
|---|---|---|---|
| Argus Research | Maintain | Hold | 2026-02-05 |
| TD Cowen | Maintain | Buy | 2026-02-04 |
| Morgan Stanley | Maintain | Overweight | 2026-02-04 |
| Keybanc | Maintain | Overweight | 2026-02-04 |
| Piper Sandler | Maintain | Overweight | 2026-02-04 |
| Mizuho | Maintain | Neutral | 2026-02-04 |
| BTIG | Maintain | Buy | 2026-02-04 |
| Citigroup | Maintain | Buy | 2026-02-04 |
| Stifel | Maintain | Buy | 2026-02-04 |
| Barclays | Maintain | Equal Weight | 2026-02-04 |
Darden Restaurants, Inc. Grades
Below is a summary of recent institutional grade changes for Darden Restaurants:
| Grading Company | Action | New Grade | Date |
|---|---|---|---|
| Mizuho | Upgrade | Outperform | 2026-01-23 |
| Raymond James | Downgrade | Market Perform | 2026-01-21 |
| Truist Securities | Downgrade | Hold | 2026-01-08 |
| Barclays | Maintain | Overweight | 2026-01-07 |
| BMO Capital | Maintain | Market Perform | 2026-01-06 |
| Mizuho | Maintain | Neutral | 2025-12-22 |
| BTIG | Maintain | Buy | 2025-12-19 |
| Stephens & Co. | Maintain | Equal Weight | 2025-12-19 |
| Guggenheim | Maintain | Buy | 2025-12-17 |
| Jefferies | Maintain | Hold | 2025-12-15 |
Which company has the best grades?
Chipotle Mexican Grill consistently holds Buy and Overweight ratings from multiple top-tier firms, signaling broad institutional confidence. Darden Restaurants shows mixed trends with recent downgrades but retains some Buy and Outperform grades. Investors may interpret Chipotle’s steadier positive grades as a stronger institutional endorsement.
Risks specific to each company
The following categories identify the critical pressure points and systemic threats facing both firms in the 2026 market environment:
1. Market & Competition
Chipotle Mexican Grill, Inc. (CMG)
- Faces intense competition in fast-casual dining with high market saturation risks.
Darden Restaurants, Inc. (DRI)
- Competes in full-service dining, facing slower growth but with strong brand diversification.
2. Capital Structure & Debt
Chipotle Mexican Grill, Inc. (CMG)
- Very high debt-to-assets ratio at 109.5% signals aggressive leverage, raising financial risk.
Darden Restaurants, Inc. (DRI)
- Moderate leverage with debt-to-assets near 49.5%, but weak liquidity ratios raise solvency concerns.
3. Stock Volatility
Chipotle Mexican Grill, Inc. (CMG)
- Beta near 1.0 indicates stock moves roughly with the market, implying average volatility.
Darden Restaurants, Inc. (DRI)
- Lower beta at 0.61 suggests less sensitivity to market swings, offering relative stability.
4. Regulatory & Legal
Chipotle Mexican Grill, Inc. (CMG)
- Subject to food safety and labor regulations across multiple countries, increasing compliance complexity.
Darden Restaurants, Inc. (DRI)
- Faces U.S.-centric regulatory environment, reducing international legal exposure but still vulnerable to labor laws.
5. Supply Chain & Operations
Chipotle Mexican Grill, Inc. (CMG)
- Global supply chain exposes it to geopolitical risks and cost inflation in fresh food sourcing.
Darden Restaurants, Inc. (DRI)
- More localized supply chain mitigates some global risks but remains vulnerable to commodity price swings.
6. ESG & Climate Transition
Chipotle Mexican Grill, Inc. (CMG)
- Strong focus on sustainability and ethical sourcing supports brand but entails higher operational costs.
Darden Restaurants, Inc. (DRI)
- ESG efforts advancing but lag behind peers; climate transition costs may pressure margins.
7. Geopolitical Exposure
Chipotle Mexican Grill, Inc. (CMG)
- Significant international presence exposes CMG to currency volatility and trade tensions.
Darden Restaurants, Inc. (DRI)
- Primarily U.S. operations limit geopolitical risk but reduce growth avenues abroad.
Which company shows a better risk-adjusted profile?
Chipotle’s most pressing risk is its aggressive leverage, which could strain liquidity despite strong returns. Darden’s key vulnerability lies in weak liquidity ratios, signaling potential short-term financial stress. Despite these risks, Darden’s lower beta and more conservative debt-to-assets ratio indicate a better risk-adjusted profile in 2026, especially given its stable dividend yield and strong Piotroski score.
Final Verdict: Which stock to choose?
Chipotle Mexican Grill’s superpower lies in its unmatched capital efficiency and strong value creation, reflected in a soaring ROIC well above its cost of capital. Its aggressive growth profile demands vigilance on elevated leverage and valuation multiples. This stock fits well with portfolios seeking high-growth exposure tempered by operational excellence.
Darden Restaurants commands a strategic moat rooted in stable cash flows and consistent profitability, supported by a solid recurring revenue model. Its relative safety, reflected in more moderate valuation and dividend yield, makes it suitable for investors prioritizing Growth at a Reasonable Price (GARP) with a taste for income stability.
If you prioritize aggressive growth and capital efficiency, Chipotle outshines with superior ROIC and expanding profitability despite its leverage risk. However, if you seek better stability and income alongside growth, Darden offers a compelling profile with steady cash generation and dividend support, albeit at a more moderate growth pace.
Disclaimer: Investment carries a risk of loss of initial capital. The past performance is not a reliable indicator of future results. Be sure to understand risks before making an investment decision.
Go Further
I encourage you to read the complete analyses of Chipotle Mexican Grill, Inc. and Darden Restaurants, Inc. to enhance your investment decisions: