Home > Comparison > Energy > XOM vs CVX
The strategic rivalry between Exxon Mobil Corporation and Chevron Corporation shapes the energy sector’s evolution. Exxon Mobil, a capital-intensive integrated oil and gas giant, contrasts with Chevron’s diversified upstream and downstream operations, including renewable fuels. This duel highlights a contest between scale-driven efficiency and operational breadth. This analysis will identify which company’s approach offers a superior risk-adjusted return, guiding investors seeking durable exposure in the energy industry.
Table of contents
Companies Overview
Exxon Mobil and Chevron dominate the integrated oil and gas sector with substantial global footprints and diverse energy portfolios.
Exxon Mobil Corporation: Integrated Energy Giant
Exxon Mobil leads as a global oil and gas integrated powerhouse. It generates revenue through exploration, production, refining, and chemicals. In 2021, its strategic focus included expanding carbon capture, hydrogen, and biofuel technologies, signaling a commitment to energy transition while leveraging its vast asset base of over 20,000 operated wells.
Chevron Corporation: Diversified Energy Leader
Chevron operates as a major integrated energy and chemicals company. Its revenue stems from upstream exploration and production, plus downstream refining, marketing, and renewables. The 2021 strategy emphasized scaling liquefied natural gas, renewable fuels, and advancing gas-to-liquids technology to diversify beyond traditional hydrocarbons and enhance resilience.
Strategic Collision: Similarities & Divergences
Both companies pursue integrated models blending upstream and downstream operations but diverge in innovation focus. Exxon prioritizes carbon capture and biofuels, while Chevron advances LNG and gas-to-liquids. Their competitive battleground centers on energy transition technologies and market share in evolving fuels. Investment profiles differ: Exxon bets on scale and carbon tech, Chevron on diversified energy streams and chemical innovation.
Income Statement Comparison
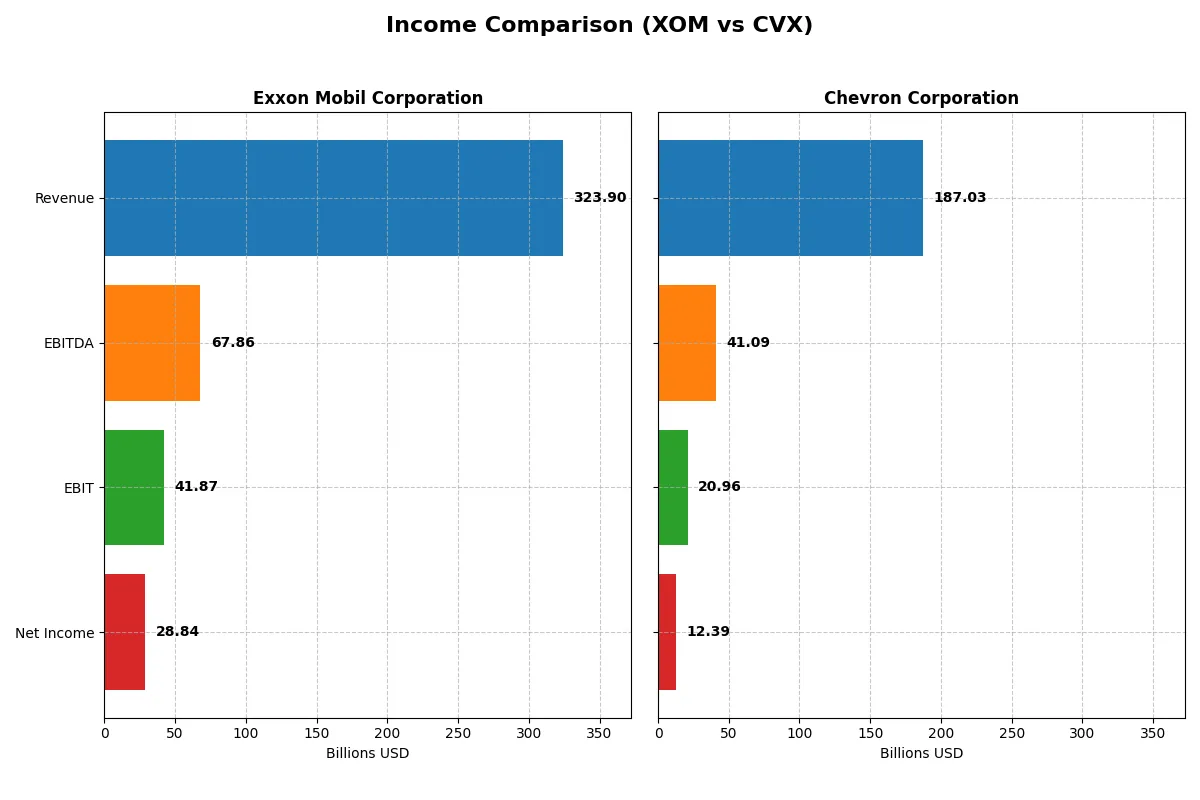
This data dissects the core profitability and scalability of both corporate engines to reveal who dominates the bottom line:
| Metric | Exxon Mobil Corporation (XOM) | Chevron Corporation (CVX) |
|---|---|---|
| Revenue | 324B | 187B |
| Cost of Revenue | 254B | 153B |
| Operating Expenses | 36.3B | 23.4B |
| Gross Profit | 70.2B | 34.4B |
| EBITDA | 67.9B | 41.1B |
| EBIT | 41.9B | 20.9B |
| Interest Expense | 603M | 1.22B |
| Net Income | 28.8B | 12.4B |
| EPS | 6.66 | 6.65 |
| Fiscal Year | 2025 | 2025 |
Income Statement Analysis: The Bottom-Line Duel
This income statement comparison reveals each company’s operational efficiency and profitability over recent years, highlighting financial resilience and momentum.
Exxon Mobil Corporation Analysis
Exxon Mobil shows a mixed trajectory with 2025 revenue at 324B, down 4.5% from 2024, yet net income remains strong at 28.8B. Its gross margin of 21.7% and net margin near 9% demonstrate robust profitability. Despite a slight decline in 2025, Exxon’s overall five-year revenue and net income grew by 17% and 25%, signaling solid long-term efficiency.
Chevron Corporation Analysis
Chevron’s revenue fell 3.3% to 187B in 2025, with net income dropping sharply to 12.4B. Its gross margin at 18.4% lags Exxon, though its EBIT margin of 11.2% remains favorable. Chevron’s net income and margins declined substantially over five years, shrinking net income by over 20%. This points to pressures on profitability despite steady revenue growth.
Margin Strength vs. Profitability Pressure
Exxon Mobil outperforms Chevron with higher margins and sustained net income growth, reflecting superior operational control and capital allocation. Chevron’s steeper net income decline and weaker margins reveal fundamental profitability challenges. For investors, Exxon’s profile offers stronger earnings durability and margin resilience in a competitive market environment.
Financial Ratios Comparison
These vital ratios act as a diagnostic tool to expose the underlying fiscal health, valuation premiums, and capital efficiency of the companies compared below:
| Ratios | Exxon Mobil Corporation (XOM) | Chevron Corporation (CVX) |
|---|---|---|
| ROE | 11.12% | 0% |
| ROIC | 6.34% | 0% |
| P/E | 13.73 | 24.49 |
| P/B | 1.75 | N/A |
| Current Ratio | 1.15 | N/A |
| Quick Ratio | 0.79 | N/A |
| D/E | 0.17 | N/A |
| Debt-to-Assets | 9.20% | N/A |
| Interest Coverage | 56.28 | 9.00 |
| Asset Turnover | 0.72 | N/A |
| Fixed Asset Turnover | 1.08 | N/A |
| Payout Ratio | 59.74% | 103.34% |
| Dividend Yield | 0% | 4.22% |
| Fiscal Year | 2025 | 2025 |
Efficiency & Valuation Duel: The Vital Signs
Ratios act as the company’s DNA, revealing hidden risks and operational excellence behind headline numbers and market sentiment.
Exxon Mobil Corporation
Exxon Mobil shows neutral core profitability with an 11.12% ROE and an 8.91% net margin, reflecting steady but unspectacular efficiency. Valuation metrics like P/E and P/B are favorable, suggesting the stock is not stretched. However, Exxon offers no dividend yield, indicating reinvestment into capital projects or growth initiatives rather than direct shareholder payouts.
Chevron Corporation
Chevron posts a neutral 6.62% net margin but lacks reported ROE and ROIC, weakening profitability insights. Its P/E ratio at 24.49 signals a fair valuation, neither cheap nor expensive. Chevron stands out with a 4.22% dividend yield, offering consistent shareholder returns, though several liquidity and asset turnover ratios remain unfavorable, hinting at operational risks.
Balanced Yield vs. Operational Clarity
Exxon delivers a more balanced risk profile with stable profitability and favorable valuation but no dividend income. Chevron provides attractive dividends but reveals operational weaknesses and less transparent profitability. Investors seeking income may prefer Chevron, while those favoring operational stability might lean toward Exxon.
Which one offers the Superior Shareholder Reward?
I contrast Exxon Mobil (XOM) and Chevron (CVX) based on dividends, payout ratios, and buybacks. XOM yields 3.6% with a 49.6% payout ratio, backed by strong FCF coverage (1.34x). CVX offers a higher yield at 4.2%, but its payout ratio exceeds 100%, signaling risk. Both deliver robust buybacks, yet XOM’s lower payout ratio and coverage ratio suggest a more sustainable model. CVX’s aggressive payout risks cash flow strain despite a solid dividend. For disciplined total return in 2026, I favor Exxon Mobil’s balanced distribution approach.
Comparative Score Analysis: The Strategic Profile
The radar chart reveals the fundamental DNA and trade-offs of Exxon Mobil and Chevron, highlighting their financial strengths and valuation challenges:
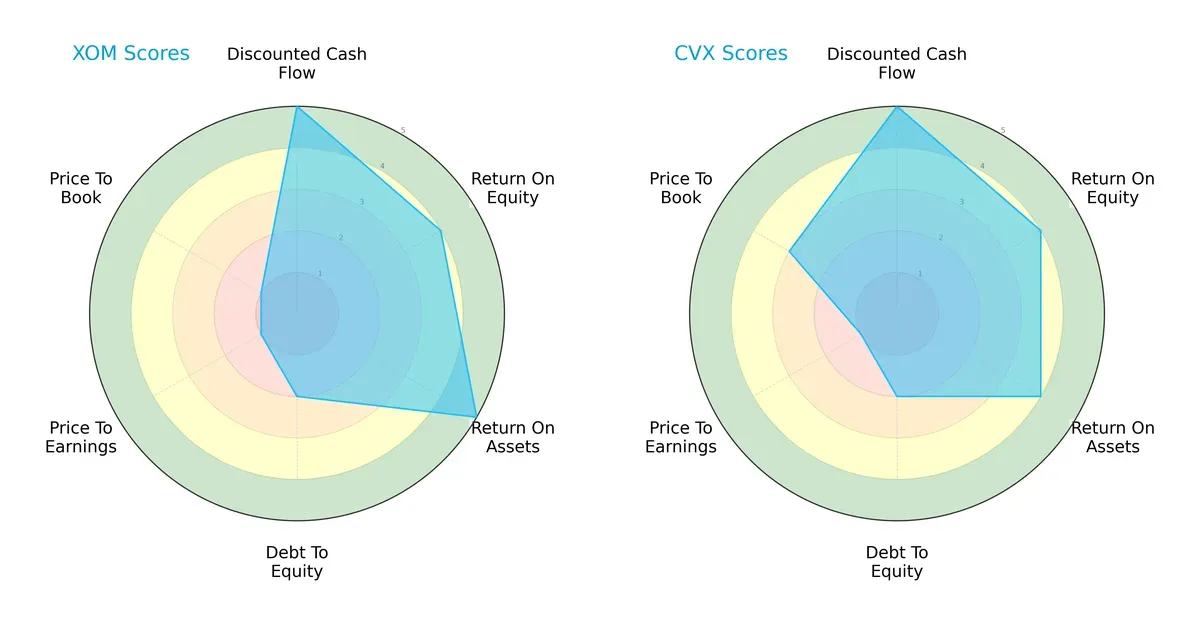
Exxon Mobil shows a more balanced operational efficiency with superior ROA (5) and ROE (4) scores compared to Chevron’s slightly lower ROA (4) but equal ROE (4). Both excel in discounted cash flow (5) and share moderate debt-to-equity risk (2). However, Chevron’s valuation looks more reasonable on price-to-book (3) versus Exxon’s weak scores in both P/E (1) and P/B (1), indicating Exxon faces valuation headwinds despite strong fundamentals.
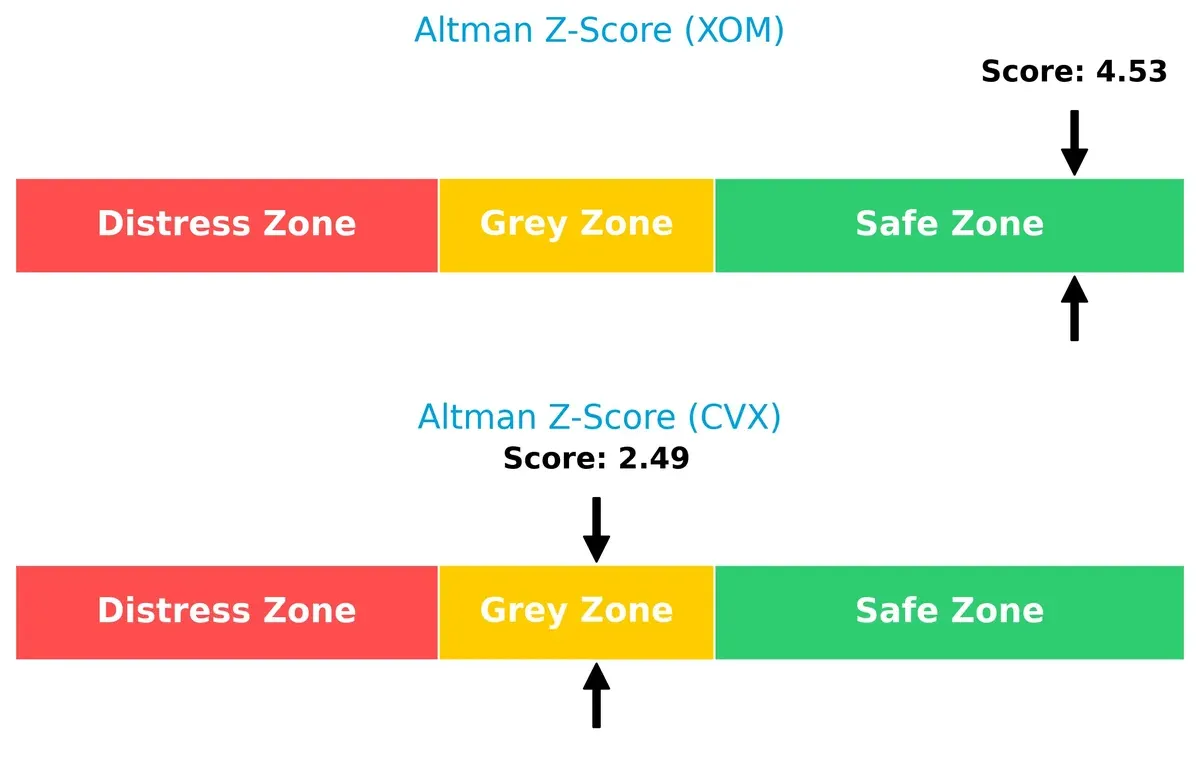
Bankruptcy Risk: Solvency Showdown
Exxon’s Altman Z-Score of 4.53 places it firmly in the safe zone, signaling robust solvency and low bankruptcy risk in this cycle; Chevron’s 2.49 falls into the grey zone, suggesting higher vulnerability:
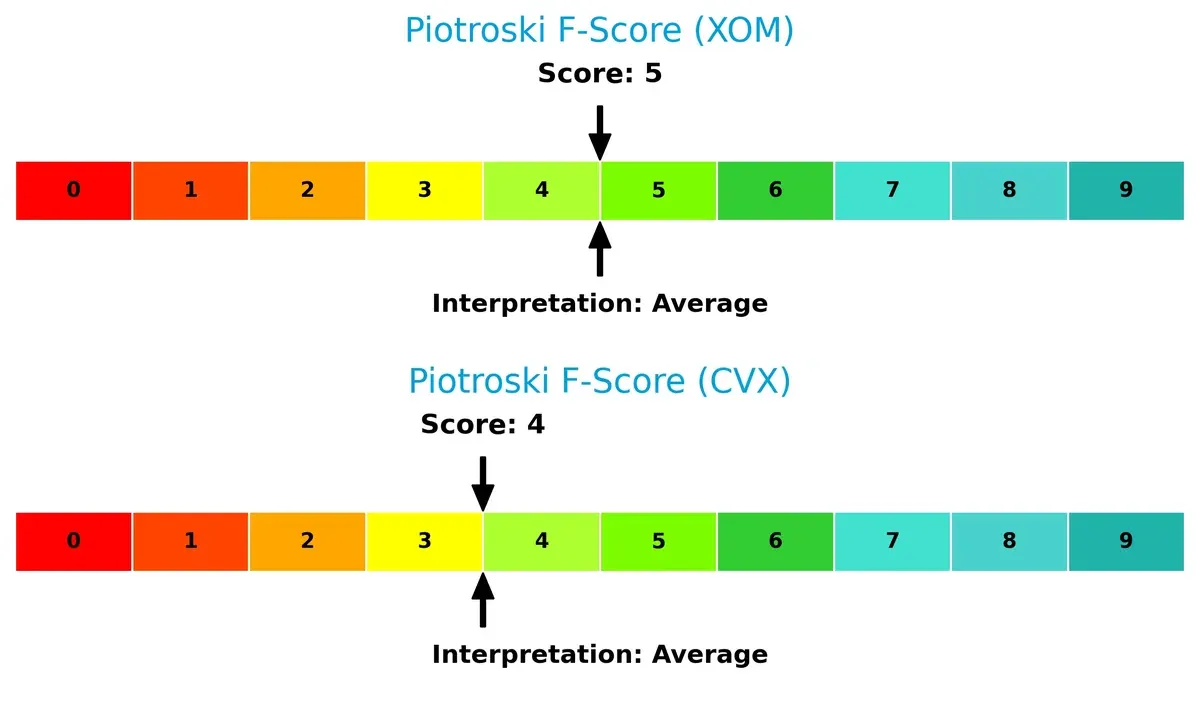
Financial Health: Quality of Operations
Both firms exhibit average Piotroski F-Scores—Exxon at 5 and Chevron at 4—indicating moderate financial health without glaring red flags, but neither displays peak operational quality:
How are the two companies positioned?
This section dissects Exxon Mobil and Chevron’s operational DNA by comparing revenue distribution and internal dynamics. The final objective is to confront their economic moats to identify the more resilient, sustainable advantage.
Revenue Segmentation: The Strategic Mix
The following visual comparison dissects how Exxon Mobil Corporation and Chevron Corporation diversify their income streams and pinpoints where their primary sector bets lie:
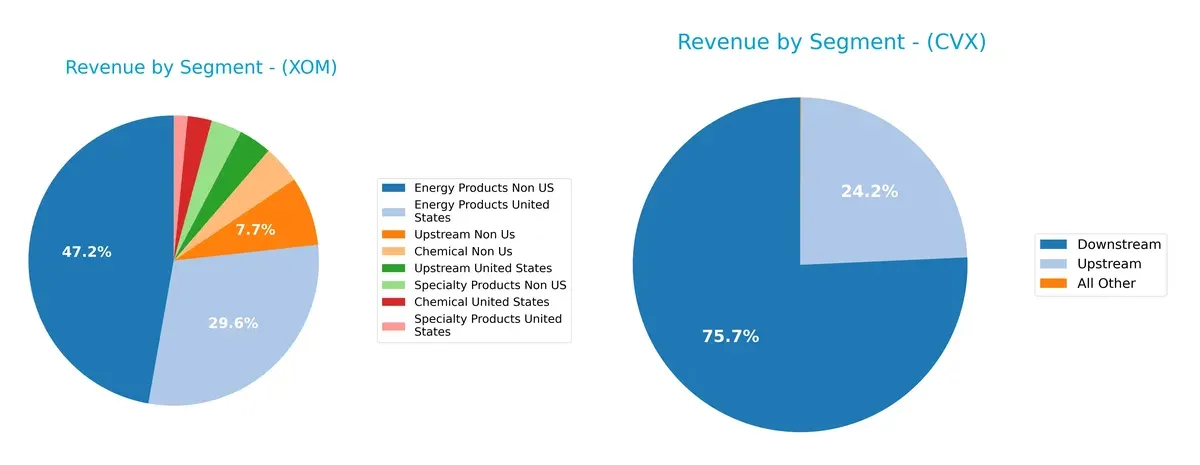
Exxon Mobil displays a highly diversified revenue mix across Chemicals, Energy Products, Specialty Products, and Upstream segments, with Energy Products dominating at $306B combined in 2022. Chevron pivots mainly on Downstream ($172B) and Upstream ($63B), showing less segment variety. Exxon’s broad portfolio mitigates concentration risk, while Chevron’s focus anchors it to oil and gas cycles, emphasizing its infrastructure and operational strengths but exposing it to commodity volatility.
Strengths and Weaknesses Comparison
This table compares the Strengths and Weaknesses of Exxon Mobil Corporation and Chevron Corporation:
Exxon Mobil Corporation Strengths
- Diversified revenue streams across Chemicals, Energy Products, Specialty Products, and Upstream segments
- Strong global presence with substantial Non-US and US revenues
- Favorable capital structure with low debt-to-assets and high interest coverage
- Neutral profitability ratios with ROIC above WACC signaling value creation
- Market share supported by large Downstream and Upstream operations
Chevron Corporation Strengths
- Solid dividend yield at 4.22% attracting income-focused investors
- Favorable debt metrics with low leverage and positive interest coverage
- Diversified operations primarily in Downstream and Upstream segments
- Presence in both US and International markets with balanced revenue exposure
- Neutral PE suggesting market values earnings moderately
Exxon Mobil Corporation Weaknesses
- Unfavorable quick ratio indicating potential liquidity strain
- Zero dividend yield reducing income appeal
- Neutral net margin and ROE reflecting moderate profitability
- Somewhat low asset turnover limiting asset efficiency
- PE and PB ratios at zero may indicate valuation concerns or data gaps
Chevron Corporation Weaknesses
- Unfavorable ROE and ROIC implying weak capital returns
- Unavailable WACC creates valuation uncertainty
- Unfavorable current and quick ratios highlight liquidity risks
- Zero asset turnover ratios may signal inefficiency or reporting issues
- Higher unfavorable ratio percentage than Exxon signals relative financial weakness
Exxon Mobil demonstrates strength in its global scale, diversified revenue base, and conservative financial leverage. Chevron shows strengths in shareholder returns and balanced geographic exposure but faces challenges in profitability and liquidity metrics. Both companies’ weaknesses suggest areas to monitor closely for operational and financial risks.
The Moat Duel: Analyzing Competitive Defensibility
A structural moat is the only reliable shield protecting long-term profits from relentless competition erosion. Let’s dissect the moats of two oil giants:
Exxon Mobil Corporation: Scale and Vertical Integration Moat
Exxon’s competitive edge stems from massive scale and integrated operations across upstream, downstream, and chemicals. This manifests in stable margins (~12.9% EBIT) and solid revenue growth over five years. Expansion in carbon capture and biofuels could strengthen this moat in 2026.
Chevron Corporation: Operational Efficiency and Asset Quality Moat
Chevron leverages operational efficiency and high-quality asset base, contrasting Exxon’s scale focus. Despite a strong EBIT margin (~11.2%), Chevron faces margin pressure and declining ROIC trends. Its investments in LNG and renewable fuels may offer moderate moat expansion if execution improves.
Scale Dominance vs. Efficiency Resilience
Exxon’s wider moat benefits from diversified global operations and margin stability, while Chevron’s moat faces erosion amid profitability challenges. I view Exxon as better positioned to defend market share, given its stronger financial durability and growth initiatives.
Which stock offers better returns?
Over the past year, both Exxon Mobil Corporation and Chevron Corporation showed strong price appreciation with accelerating bullish trends, reflecting robust investor demand and notable highs near year-end.
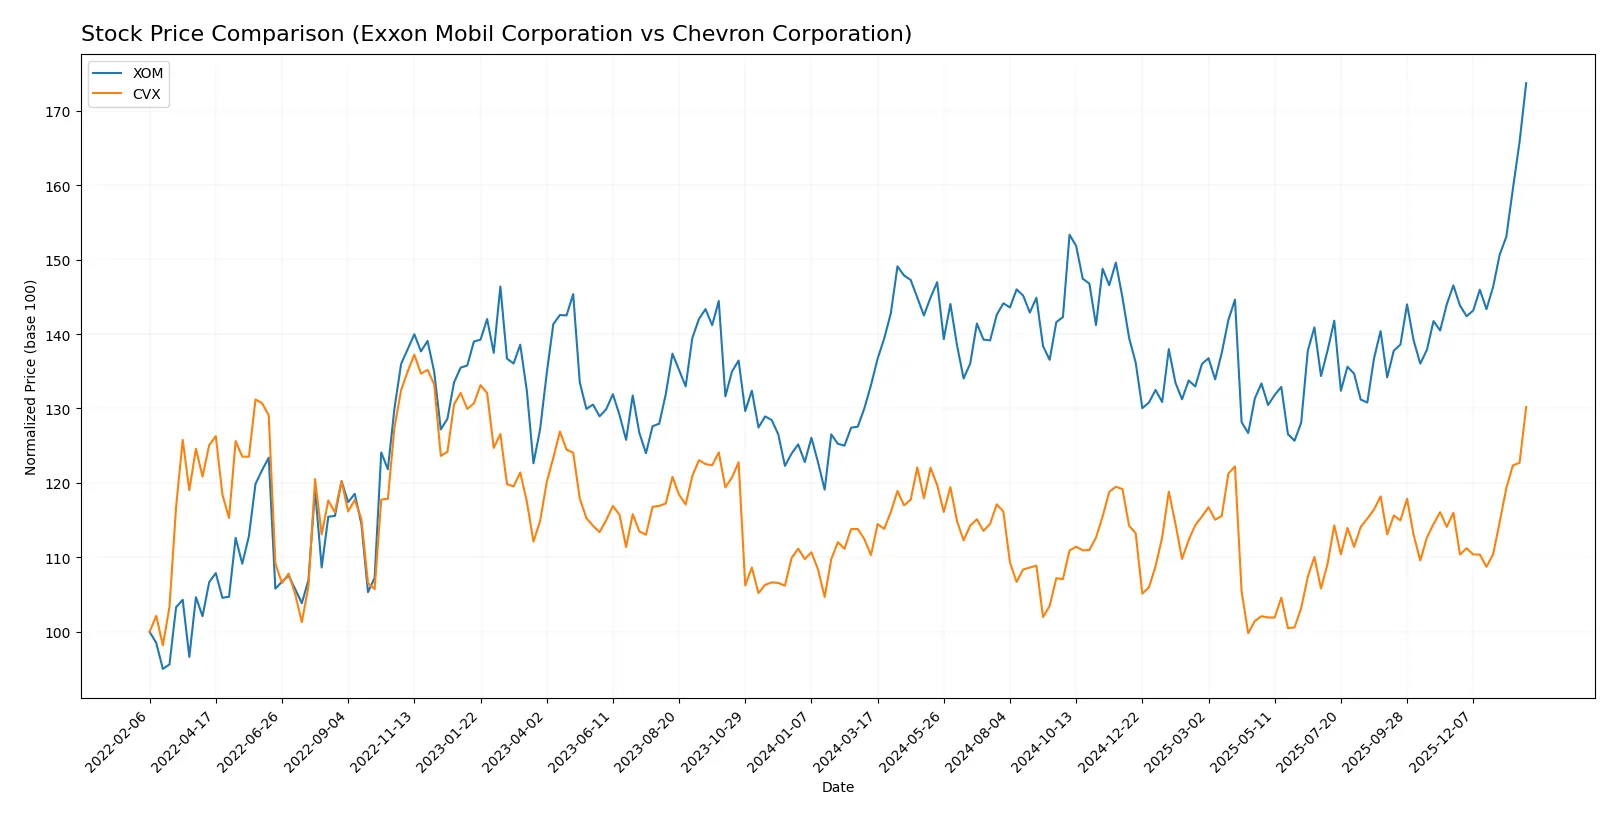
Trend Comparison
Exxon Mobil’s stock gained 30.47% over the past 12 months, marking a bullish trend with accelerating momentum and a high of 141.4. Volatility remains moderate at a 6.36 standard deviation.
Chevron’s stock rose 18.03% in the same period, also bullish and accelerating, with a peak price of 176.9. Volatility is slightly higher at 7.81 standard deviation.
Exxon Mobil outperformed Chevron, delivering the strongest market performance with a 12.44 percentage point lead in total price appreciation.
Target Prices
Analysts show a confident target price range indicating moderate upside potential for these energy giants.
| Company | Target Low | Target High | Consensus |
|---|---|---|---|
| Exxon Mobil Corporation | 132 | 158 | 143.44 |
| Chevron Corporation | 160 | 206 | 176.4 |
Exxon’s consensus target sits slightly above its current price of 141.63, signaling modest growth expectations. Chevron’s target consensus at 176.4 exceeds its present price of 177.01, suggesting a near-term valuation plateau or slight upside.

Don’t Let Luck Decide Your Entry Point
Optimize your entry points with our advanced ProRealTime indicators. You’ll get efficient buy signals with precise price targets for maximum performance. Start outperforming now!
How do institutions grade them?
Here is a summary of the latest institutional grades for Exxon Mobil Corporation and Chevron Corporation:
Exxon Mobil Corporation Grades
The following table lists recent grades assigned to Exxon Mobil by major firms.
| Grading Company | Action | New Grade | Date |
|---|---|---|---|
| B of A Securities | Maintain | Neutral | 2026-01-28 |
| Morgan Stanley | Maintain | Overweight | 2026-01-23 |
| Barclays | Maintain | Overweight | 2026-01-21 |
| Piper Sandler | Maintain | Overweight | 2026-01-08 |
| Freedom Capital Markets | Downgrade | Sell | 2026-01-06 |
| Bernstein | Maintain | Outperform | 2026-01-05 |
| TD Cowen | Maintain | Buy | 2025-12-12 |
| Mizuho | Maintain | Neutral | 2025-12-12 |
| Wells Fargo | Maintain | Overweight | 2025-12-11 |
| B of A Securities | Maintain | Neutral | 2025-12-11 |
Chevron Corporation Grades
This table shows recent institutional grades for Chevron from recognized analysts.
| Grading Company | Action | New Grade | Date |
|---|---|---|---|
| Morgan Stanley | Maintain | Overweight | 2026-01-23 |
| Barclays | Maintain | Equal Weight | 2026-01-21 |
| Jefferies | Maintain | Buy | 2026-01-14 |
| Piper Sandler | Maintain | Overweight | 2026-01-08 |
| Freedom Capital Markets | Downgrade | Sell | 2026-01-06 |
| Bernstein | Maintain | Market Perform | 2026-01-05 |
| Citigroup | Maintain | Buy | 2026-01-05 |
| Mizuho | Maintain | Outperform | 2025-12-12 |
| B of A Securities | Maintain | Buy | 2025-12-11 |
| HSBC | Upgrade | Buy | 2025-12-01 |
Which company has the best grades?
Both companies receive mostly positive grades, with multiple “Buy” and “Overweight” ratings. Chevron shows a slightly stronger consensus on buy-side opinions, while Exxon Mobil has a broader range from neutral to outperform. Investors might interpret Chevron’s steadier buy support as a signal of moderate confidence.
Risks specific to each company
The following categories identify the critical pressure points and systemic threats facing both Exxon Mobil Corporation and Chevron Corporation in the 2026 market environment:
1. Market & Competition
Exxon Mobil Corporation
- Faces intense competition but benefits from integrated operations and diversified energy segments.
Chevron Corporation
- Competes aggressively in integrated energy but shows weaker asset turnover and operational efficiency metrics.
2. Capital Structure & Debt
Exxon Mobil Corporation
- Maintains low debt-to-equity (0.17) and strong interest coverage (69.44), indicating solid financial stability.
Chevron Corporation
- Also shows low debt levels and decent interest coverage (17.22), but some liquidity ratios are unavailable or unfavorable.
3. Stock Volatility
Exxon Mobil Corporation
- Displays lower beta (0.365), implying less stock volatility relative to the market.
Chevron Corporation
- Exhibits higher beta (0.687), suggesting more sensitivity to market swings and higher volatility risk.
4. Regulatory & Legal
Exxon Mobil Corporation
- Faces regulatory risks typical in oil & gas, including environmental policies and carbon regulations.
Chevron Corporation
- Encounters similar regulatory challenges, with additional exposure due to broader chemical and LNG operations.
5. Supply Chain & Operations
Exxon Mobil Corporation
- Operates over 20,500 net operated wells, showing scale but exposure to operational disruptions.
Chevron Corporation
- Manages extensive upstream and downstream assets but reports weaker asset turnover ratios, hinting at operational efficiency concerns.
6. ESG & Climate Transition
Exxon Mobil Corporation
- Invests in carbon capture and biofuels but still faces pressure to accelerate climate transition.
Chevron Corporation
- Produces renewable fuels and is engaged in climate initiatives but lags in some financial health metrics critical for ESG investments.
7. Geopolitical Exposure
Exxon Mobil Corporation
- Global operations expose it to geopolitical risks, including sanctions and regional instability.
Chevron Corporation
- Similar global footprint with risks tied to energy markets and geopolitical tensions affecting supply chains.
Which company shows a better risk-adjusted profile?
Exxon Mobil’s strongest risk lies in operational scale and supply chain complexity, while Chevron’s key risk is weaker financial health and liquidity. Exxon Mobil’s lower stock volatility and stronger capital structure provide a better risk-adjusted profile. Its Altman Z-Score (4.53) firmly places it in the safe zone, contrasting Chevron’s grey zone score (2.49). This gap in financial stability amid volatile energy markets justifies caution on Chevron despite similar industry pressures.
Final Verdict: Which stock to choose?
Exxon Mobil’s superpower lies in its resilient cash generation and disciplined capital allocation amid volatile energy cycles. Its stable but unspectacular returns and slightly stretched liquidity ratios warrant caution. Exxon fits well in portfolios seeking steady income with moderate growth exposure.
Chevron’s strategic moat centers on its integrated operations and reliable dividend yield, offering a safer income anchor compared to Exxon. However, its declining return metrics and uneven profitability trends introduce uncertainty. Chevron suits investors favoring Growth at a Reasonable Price with a defensive tilt.
If you prioritize cash flow stability and operational resilience, Exxon Mobil outshines due to its stronger economic profitability and healthier financial metrics. However, if you seek a blend of income and growth with a slightly more conservative risk profile, Chevron offers better stability despite some weakening fundamentals. Both present analytical scenarios worth careful consideration.
Disclaimer: Investment carries a risk of loss of initial capital. The past performance is not a reliable indicator of future results. Be sure to understand risks before making an investment decision.
Go Further
I encourage you to read the complete analyses of Exxon Mobil Corporation and Chevron Corporation to enhance your investment decisions: