Home > Comparison > Communication Services > VZ vs CHTR
The strategic rivalry between Verizon Communications Inc. and Charter Communications, Inc. shapes the future of the telecommunications services sector. Verizon operates as a diversified communications conglomerate with extensive wireless and wireline assets. Charter focuses on broadband connectivity and cable services, leveraging subscription-based video and internet offerings. This analysis will evaluate which company’s operational model delivers superior risk-adjusted returns for a diversified portfolio amid evolving market dynamics.
Table of contents
Companies Overview
Verizon and Charter Communications dominate the US telecommunications landscape with distinct market approaches and scale.
Verizon Communications Inc.: Integrated Telecom Powerhouse
Verizon leads as a diversified communication services provider with over 115M wireless connections. Its core revenue stems from postpaid and prepaid wireless plans, fixed residential internet, and business network solutions. In 2021, Verizon focused strategically on expanding its IoT services and enhancing private cloud connectivity to capture enterprise demand.
Charter Communications, Inc.: Broadband and Cable Specialist
Charter commands a strong position in broadband and cable, serving 32M customers across 41 states. Its revenue engine relies heavily on subscription video, high-speed internet, and voice services using VoIP technology. The company’s 2021 strategy emphasized expanding WiFi solutions and regional sports network ownership to deepen customer engagement.
Strategic Collision: Similarities & Divergences
Both companies excel in telecommunications services, yet Verizon pursues a broad portfolio, including IoT and enterprise cloud, while Charter centers on broadband and cable video subscriptions. Their rivalry intensifies in broadband internet and video entertainment markets. Verizon’s scale and diversified services contrast with Charter’s focused regional dominance and content strategy, shaping distinct investment profiles.
Income Statement Comparison
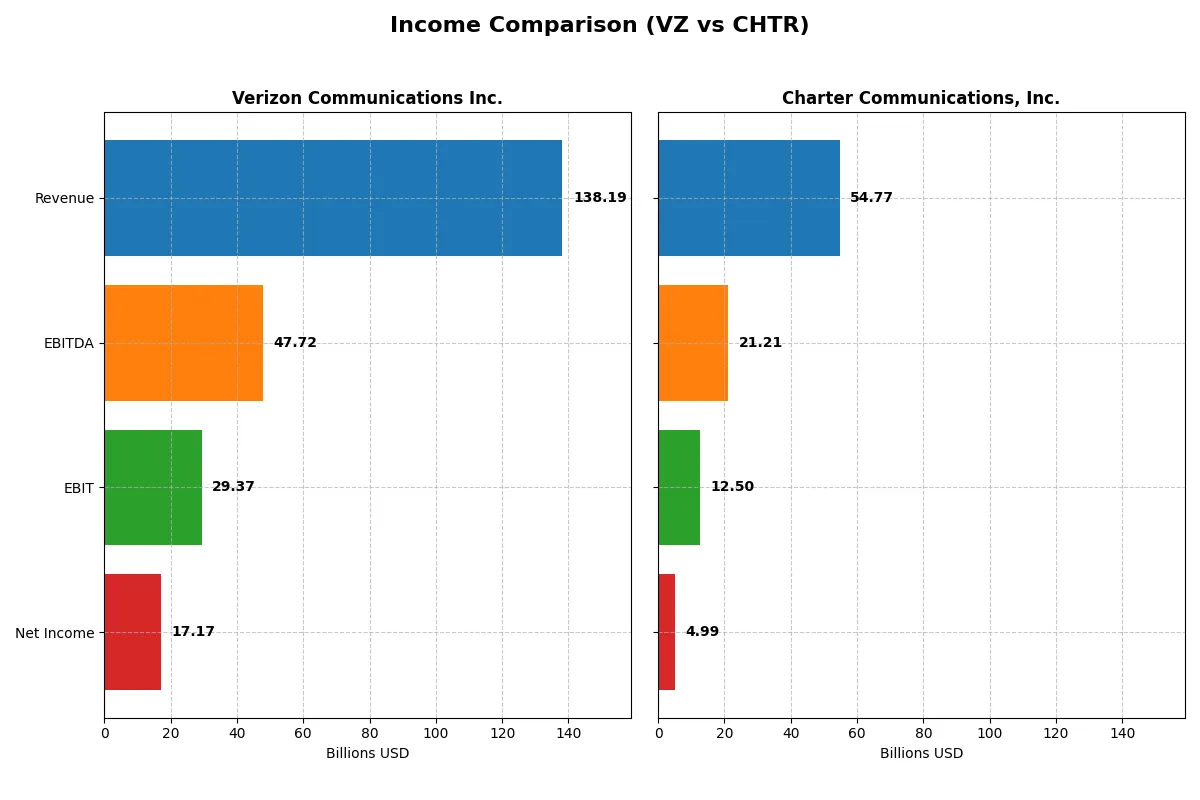
This data dissects the core profitability and scalability of both corporate engines to reveal who dominates the bottom line:
| Metric | Verizon Communications Inc. (VZ) | Charter Communications, Inc. (CHTR) |
|---|---|---|
| Revenue | 138.2B | 54.8B |
| Cost of Revenue | 75.1B | 29.4B |
| Operating Expenses | 33.8B | 12.0B |
| Gross Profit | 63.1B | 25.4B |
| EBITDA | 47.7B | 21.2B |
| EBIT | 29.4B | 12.5B |
| Interest Expense | 6.7B | 5.0B |
| Net Income | 17.2B | 5.0B |
| EPS | 4.06 | 36.9 |
| Fiscal Year | 2025 | 2025 |
Income Statement Analysis: The Bottom-Line Duel
The following income statement comparison reveals which company delivers superior operational efficiency and bottom-line strength in a challenging market environment.
Verizon Communications Inc. Analysis
Verizon’s revenue grew modestly to $138B in 2025, but net income declined to $17.2B, signaling pressure on profitability. Gross margin stays healthy at 45.6%, while net margin contracts to 12.4%. Despite stable revenues, Verizon faces declining EBIT and EPS momentum, reflecting rising expenses and margin erosion.
Charter Communications, Inc. Analysis
Charter’s revenue slightly decreased to $54.8B in 2025, yet net income rose to $5.0B, showing improved profitability. Its gross margin at 46.3% and net margin at 9.1% remain solid. Charter sustains positive EPS growth and net income expansion over the period, demonstrating operational leverage despite a slight revenue dip.
Margin Stability vs. Income Growth
Verizon leads in absolute scale and margin percentages but struggles with declining profitability and EPS. Charter, smaller in revenue but showing net income growth and EPS strength, manages expenses effectively. Investors seeking stable margin profiles may favor Verizon; growth-oriented investors might prefer Charter’s improving earnings trajectory.
Financial Ratios Comparison
These vital ratios act as a diagnostic tool to expose the underlying fiscal health, valuation premiums, and capital efficiency of the companies compared below:
| Ratios | Verizon Communications Inc. (VZ) | Charter Communications, Inc. (CHTR) |
|---|---|---|
| ROE | 16.44% | 31.06% |
| ROIC | 6.22% | 7.27% |
| P/E | 10.02 | 5.66 |
| P/B | 1.65 | 1.76 |
| Current Ratio | 0.91 | 0.39 |
| Quick Ratio | 0.87 | 0.39 |
| D/E | 1.92 | 5.90 |
| Debt-to-Assets | 49.62% | 61.45% |
| Interest Coverage | 4.37 | 2.64 |
| Asset Turnover | 0.34 | 0.36 |
| Fixed Asset Turnover | 1.04 | 1.18 |
| Payout Ratio | 66.85% | 0% |
| Dividend Yield | 6.67% | 0% |
| Fiscal Year | 2025 | 2025 |
Efficiency & Valuation Duel: The Vital Signs
Ratios act as a company’s DNA, revealing hidden risks and operational excellence that numbers alone cannot fully express.
Verizon Communications Inc.
Verizon delivers a solid 16.4% ROE and a favorable 12.4% net margin, indicating healthy profitability. Its P/E of 10.0 suggests the stock trades at a reasonable valuation. Verizon supports shareholders with a 6.7% dividend yield, balancing income with moderate reinvestment in operations. However, a low current ratio of 0.91 signals liquidity caution.
Charter Communications, Inc.
Charter posts a commanding 31.1% ROE but a more modest 9.1% net margin, reflecting high efficiency on equity but thinner profitability. Its P/E of 5.7 marks it as attractively valued or possibly undervalued. Charter offers no dividend, opting instead to reinvest aggressively for growth. The company’s liquidity appears stretched with a current ratio of 0.39 and elevated debt levels.
Premium Valuation vs. Operational Safety
Verizon presents a balanced profile with steady profitability, reasonable valuation, and shareholder income, though liquidity is a concern. Charter boasts higher ROE and cheaper valuation but carries more financial risk and no dividend. Investors seeking income and stability may prefer Verizon, while growth-oriented profiles might consider Charter’s aggressive reinvestment despite risks.
Which one offers the Superior Shareholder Reward?
I compare Verizon (VZ) and Charter Communications (CHTR) in their shareholder reward strategies. Verizon delivers a 6.67% dividend yield with a 66.9% payout ratio, supported by solid free cash flow coverage (~54%). Verizon also repurchases shares, enhancing total returns sustainably. Charter pays no dividend but reinvests heavily in growth and acquisitions, reflected by low free cash flow conversion (~27%) and high debt leverage. Its buybacks are modest compared to Verizon’s. Historically, Verizon’s balanced income and buyback approach offers more sustainable, attractive returns for 2026 investors, while Charter’s aggressive reinvestment carries higher risk without immediate shareholder payouts. I favor Verizon for superior total shareholder reward in 2026.
Comparative Score Analysis: The Strategic Profile
The radar chart reveals the fundamental DNA and trade-offs of Verizon Communications Inc. and Charter Communications, Inc.:
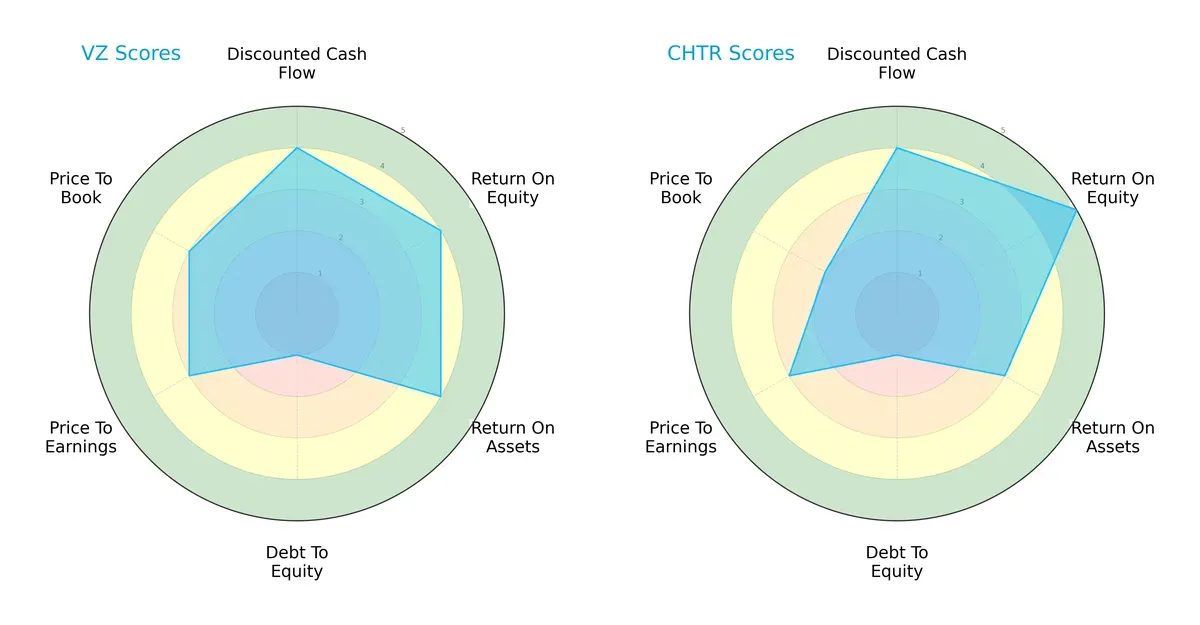
Verizon and Charter share a balanced overall score of 3, reflecting moderate performance. Verizon excels in return on assets (4) and equity (4), while Charter leads in return on equity (5) but lags slightly in asset efficiency (3). Both suffer from a very unfavorable debt-to-equity score (1), signaling high leverage risk. Verizon shows more consistency across valuation metrics (PE/PB scores of 3), whereas Charter’s lower price-to-book score (2) suggests a potential bargain but also valuation risk.
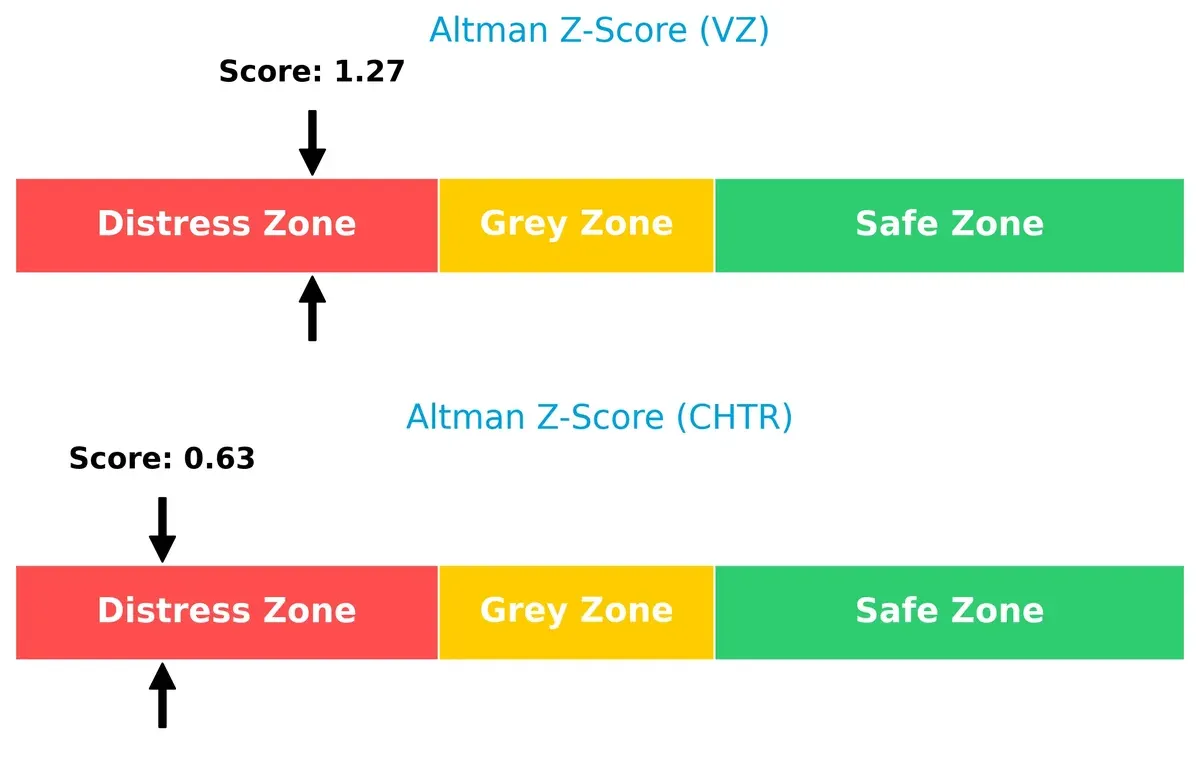
Bankruptcy Risk: Solvency Showdown
Verizon’s Altman Z-Score of 1.27 slightly outperforms Charter’s 0.63, but both fall into the distress zone, implying significant long-term solvency risks under current market conditions:
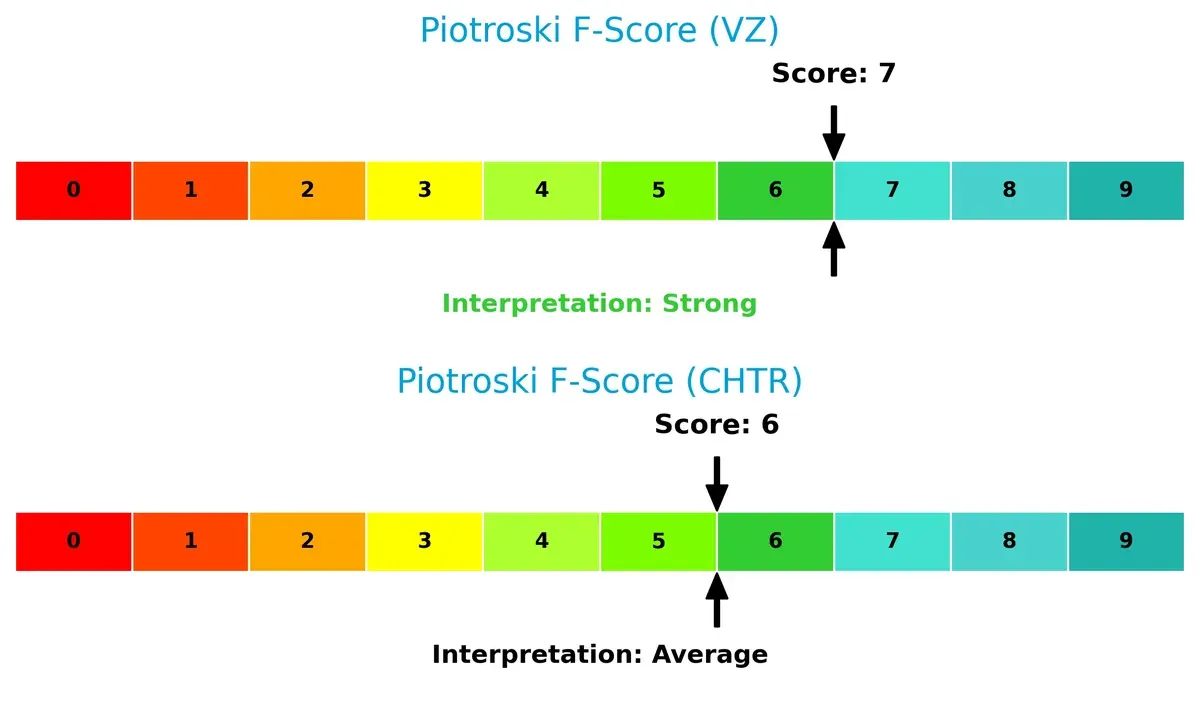
Financial Health: Quality of Operations
Verizon’s Piotroski F-Score of 7 indicates strong financial health, outperforming Charter’s average score of 6. This suggests Verizon maintains superior operational quality and fewer internal red flags:
How are the two companies positioned?
This section dissects the operational DNA of Verizon and Charter by comparing their revenue distribution and internal dynamics. The goal is to confront their economic moats to reveal which model offers the most resilient competitive advantage today.
Revenue Segmentation: The Strategic Mix
This visual comparison dissects how Verizon Communications Inc. and Charter Communications, Inc. diversify their income streams and where their primary sector bets lie:
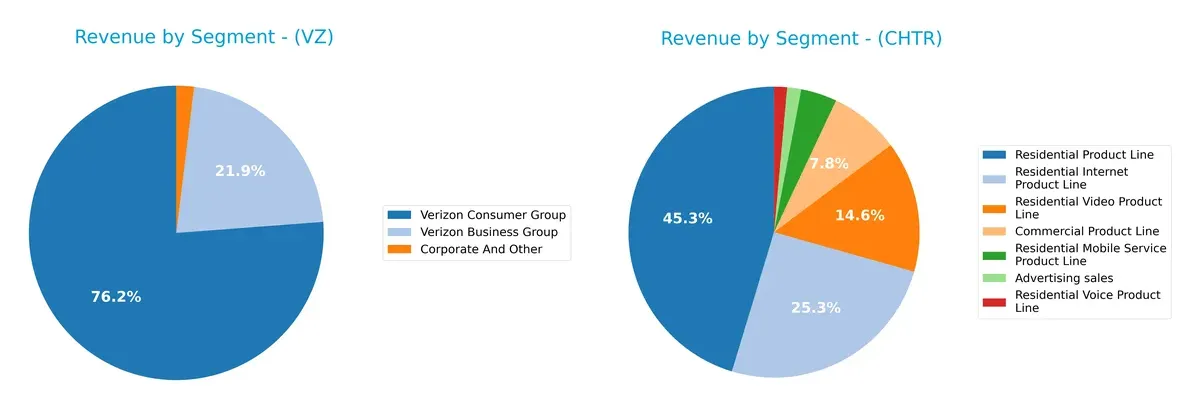
Verizon anchors revenue with its Consumer Group at $103B, dwarfing its Business Group’s $29.5B, signaling concentration in consumer wireless services. Charter shows a more diversified mix: its Residential Product Line leads at $43B, supported by strong Video ($15.1B) and Internet ($23.4B) segments. Verizon’s focus on consumer wireless creates ecosystem lock-in but risks exposure to market shifts. Charter’s broader segmentation spreads risk across multiple residential services, enhancing resilience.
Strengths and Weaknesses Comparison
This table compares the strengths and weaknesses of Verizon Communications Inc. and Charter Communications, Inc.:
Verizon Strengths
- Strong net margin at 12.43%
- Favorable ROE at 16.44%
- Lower WACC at 4.03%
- Diverse revenue streams from business and consumer groups
- Favorable P/E ratio at 10.02
Charter Strengths
- Very high ROE at 31.06%
- Favorable WACC at 4.82%
- Lower P/E ratio at 5.66 indicating potential value
- Broad residential product line revenue
- Growth in residential video and internet segments
Verizon Weaknesses
- Current ratio below 1 at 0.91 raising liquidity concerns
- High debt-to-equity at 1.92
- Unfavorable asset turnover at 0.34
- Neutral ROIC at 6.22%
- Dividend yield moderate at 6.67%
Charter Weaknesses
- Very low current and quick ratios at 0.39 indicating liquidity pressure
- Very high debt-to-equity at 5.9
- High debt-to-assets ratio at 61.44%
- Unfavorable dividend yield at 0%
- Lower net margin at 9.1%
- Neutral interest coverage at 2.48
Both companies exhibit financial leverage challenges and liquidity constraints. Verizon’s strength lies in steady profitability and diversified consumer-business revenue. Charter shows superior ROE and value metrics but faces greater financial risk and zero dividend yield. These differences shape their strategic priorities around capital structure and market focus.
The Moat Duel: Analyzing Competitive Defensibility
A structural moat shields long-term profits from relentless competitive pressure. Let’s dissect how Verizon and Charter defend their turf:
Verizon Communications Inc.: Intangible Assets and Network Scale
Verizon leverages an extensive network and strong brand to maintain switching costs. Its high ROIC above WACC signals value creation, despite a declining profitability trend in 2026. Emerging 5G services could deepen this moat but face stiff competition.
Charter Communications, Inc.: Cost Advantage and Operational Efficiency
Charter’s moat stems from a cost-efficient broadband infrastructure distinct from Verizon’s brand leverage. It sustains a rising ROIC above WACC with improving margins. Expansion in fiber and bundled services points to a strengthening competitive position in 2026.
Network Strength vs. Cost Efficiency: The Moat Showdown
Charter’s growing ROIC and operational momentum grant it a deeper moat than Verizon’s fading profitability edge. I see Charter better poised to defend and expand market share amid evolving telecom dynamics.
Which stock offers better returns?
The past year shows Verizon gaining 12.7%, decelerating after steady growth, while Charter dropped 27.4%, accelerating its decline amid high volatility.
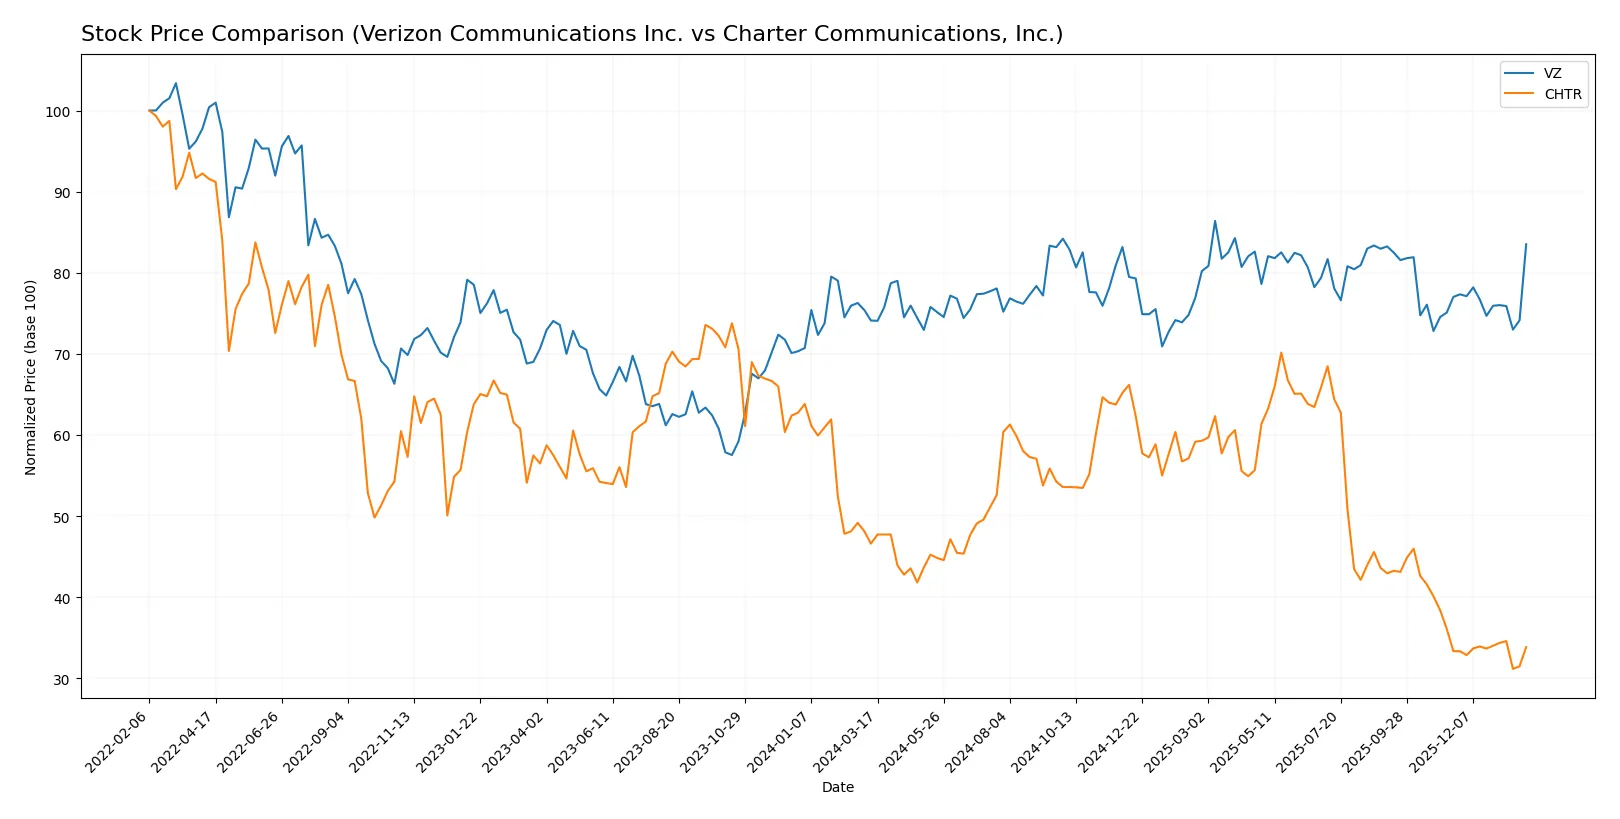
Trend Comparison
Verizon’s stock rose 12.7% over 12 months, marking a bullish trend with decelerating momentum and moderate volatility (1.81 std deviation). It peaked at 46.06 and troughed at 37.81.
Charter’s stock fell 27.4% over the same period, signaling a bearish trend with accelerating losses and extreme volatility (63.15 std deviation), hitting a high of 427.25 and a low of 189.76.
Verizon outperformed Charter substantially, delivering positive returns versus Charter’s steep decline, despite Charter’s slight buyer dominance in recent trading.
Target Prices
Analysts present a wide range of target prices, reflecting mixed expectations but a generally positive outlook.
| Company | Target Low | Target High | Consensus |
|---|---|---|---|
| Verizon Communications Inc. | 41 | 49 | 45.5 |
| Charter Communications, Inc. | 160 | 500 | 287.5 |
Verizon’s target consensus of 45.5 slightly exceeds its current 44.52 price, signaling modest upside. Charter’s consensus of 287.5 is substantially above its 206.12 price, indicating strong growth expectations despite the wide target range.

Don’t Let Luck Decide Your Entry Point
Optimize your entry points with our advanced ProRealTime indicators. You’ll get efficient buy signals with precise price targets for maximum performance. Start outperforming now!
How do institutions grade them?
The following tables summarize recent institutional grades for Verizon Communications Inc. and Charter Communications, Inc.:
Verizon Communications Inc. Grades
This table lists recent grades from reputable institutions for Verizon Communications Inc.:
| Grading Company | Action | New Grade | Date |
|---|---|---|---|
| Wells Fargo | Maintain | Equal Weight | 2026-01-26 |
| Bernstein | Maintain | Market Perform | 2026-01-16 |
| Morgan Stanley | Maintain | Equal Weight | 2025-12-10 |
| Scotiabank | Maintain | Sector Perform | 2025-10-30 |
| JP Morgan | Maintain | Neutral | 2025-10-30 |
| RBC Capital | Maintain | Sector Perform | 2025-10-30 |
| TD Cowen | Maintain | Buy | 2025-10-30 |
| Scotiabank | Maintain | Sector Perform | 2025-10-06 |
| RBC Capital | Maintain | Sector Perform | 2025-07-22 |
| B of A Securities | Maintain | Neutral | 2025-07-22 |
Charter Communications, Inc. Grades
This table shows recent institutional grades for Charter Communications, Inc.:
| Grading Company | Action | New Grade | Date |
|---|---|---|---|
| Bernstein | Maintain | Market Perform | 2026-01-16 |
| Wells Fargo | Downgrade | Underweight | 2026-01-13 |
| UBS | Maintain | Neutral | 2025-12-22 |
| Wells Fargo | Maintain | Equal Weight | 2025-11-03 |
| Bernstein | Downgrade | Market Perform | 2025-11-03 |
| RBC Capital | Maintain | Sector Perform | 2025-11-03 |
| Keybanc | Downgrade | Sector Weight | 2025-11-03 |
| Benchmark | Maintain | Buy | 2025-11-03 |
| Citigroup | Maintain | Buy | 2025-11-03 |
| Barclays | Maintain | Underweight | 2025-11-03 |
Which company has the best grades?
Verizon maintains mostly stable grades around “Equal Weight” and “Market Perform,” with one “Buy” from TD Cowen. Charter shows more downgrades, including a recent “Underweight” from Wells Fargo. Investors might view Verizon as the more consistently favored stock by analysts.
Risks specific to each company
The following categories identify the critical pressure points and systemic threats facing both firms in the 2026 market environment:
1. Market & Competition
Verizon Communications Inc.
- Established market leader with strong consumer and business segments; faces intense competition from wireless and fiber providers.
Charter Communications, Inc.
- Aggressive growth in broadband and video markets but challenged by larger incumbents and evolving streaming trends.
2. Capital Structure & Debt
Verizon Communications Inc.
- Moderate leverage with debt-to-equity near 1.92; interest coverage at 4.39 shows manageable debt costs but warrants caution.
Charter Communications, Inc.
- High leverage with debt-to-equity at 5.9 and weak current ratio of 0.39 raises significant financial risk.
3. Stock Volatility
Verizon Communications Inc.
- Low beta of 0.33 indicates defensive stock with limited price swings, suitable for conservative investors.
Charter Communications, Inc.
- Beta above 1.05 signals higher volatility, reflecting riskier market sentiment and potential price swings.
4. Regulatory & Legal
Verizon Communications Inc.
- Subject to stringent telecom regulations and spectrum licensing with moderate compliance risk.
Charter Communications, Inc.
- Faces regulatory scrutiny on broadband competition and content licensing, increasing operational uncertainty.
5. Supply Chain & Operations
Verizon Communications Inc.
- Robust network infrastructure but asset turnover is low at 0.34, showing potential operational inefficiencies.
Charter Communications, Inc.
- Slightly better asset turnover (0.36) but supply chain exposed to cable equipment and hardware cost fluctuations.
6. ESG & Climate Transition
Verizon Communications Inc.
- Growing focus on sustainability initiatives; however, large infrastructure footprint challenges rapid climate transition.
Charter Communications, Inc.
- ESG efforts are evolving but lag behind peers; energy-intensive operations pose transition risks.
7. Geopolitical Exposure
Verizon Communications Inc.
- Primarily US-focused with limited international exposure, reducing geopolitical risk.
Charter Communications, Inc.
- Also US-centric but with regional sports networks potentially sensitive to local regulatory changes.
Which company shows a better risk-adjusted profile?
Verizon’s strongest risk is its moderate leverage and operational efficiency challenges, yet its stable market position and low volatility provide a more balanced risk profile. Charter’s excessive leverage and weak liquidity create pronounced financial distress risk despite higher operational returns. Notably, Verizon’s beta of 0.33 contrasts sharply with Charter’s 1.05, underscoring Verizon’s defensive stance. Thus, Verizon shows a better risk-adjusted profile in 2026.
Final Verdict: Which stock to choose?
Verizon Communications Inc. (VZ) stands out for its robust cash-generating ability and steady dividend yield, reflecting a reliable income source. Its main point of vigilance remains a somewhat weakening profitability trend and moderate leverage, which could pressure returns. VZ suits portfolios focused on income and moderate growth stability.
Charter Communications, Inc. (CHTR) boasts a strategic moat in its growing return on invested capital, signaling expanding competitive advantage. It offers a more aggressive growth profile but carries higher financial risk, notably elevated debt levels and liquidity constraints. CHTR fits well in growth-at-a-reasonable-price (GARP) portfolios willing to accept volatility for upside.
If you prioritize income stability and value preservation, Verizon’s steady cash flow and favorable valuation metrics make it the compelling choice despite its challenges. However, if you seek growth with a durable competitive edge and can tolerate higher financial risk, Charter’s improving profitability and expansion potential outshine Verizon’s steady-state profile. Each presents a distinct analytical scenario aligned with different investor appetites.
Disclaimer: Investment carries a risk of loss of initial capital. The past performance is not a reliable indicator of future results. Be sure to understand risks before making an investment decision.
Go Further
I encourage you to read the complete analyses of Verizon Communications Inc. and Charter Communications, Inc. to enhance your investment decisions: