Home > Comparison > Communication Services > TMUS vs CHTR
The strategic rivalry between T-Mobile US, Inc. and Charter Communications, Inc. shapes the future of the Communication Services sector. T-Mobile operates as a mobile communications leader with a vast wireless subscriber base, while Charter focuses on broadband connectivity and cable services across 41 states. This analysis contrasts their operational models and growth trajectories to identify which company offers a superior risk-adjusted return for diversified portfolios amidst evolving market dynamics.
Table of contents
Companies Overview
T-Mobile US and Charter Communications hold pivotal roles in the U.S. telecommunications landscape, shaping connectivity for millions.
T-Mobile US, Inc.: Leading Mobile Network Operator
T-Mobile US dominates the mobile communications sector, serving 108.7M customers with voice, data, and messaging services. Its core revenue stems from postpaid, prepaid, and wholesale mobile subscriptions. In 2026, the company focuses on expanding 5G coverage and enhancing customer experience through device offerings and retail innovation.
Charter Communications, Inc.: Broadband and Cable Powerhouse
Charter Communications excels as a broadband and cable operator, catering to 32M customers with video, internet, and voice services. Its primary revenue driver is subscription-based broadband and video services across residential and commercial markets. The firm prioritizes upgrading fiber networks and expanding digital offerings to improve connectivity and content delivery.
Strategic Collision: Similarities & Divergences
Both companies champion connectivity, yet T-Mobile emphasizes mobile wireless infrastructure while Charter prioritizes broadband cable and fiber. Their competition centers on capturing consumer data usage and content consumption. T-Mobile’s wireless dominance contrasts with Charter’s fixed-line breadth, defining distinct investment profiles driven by network scale and service diversity.
Income Statement Comparison
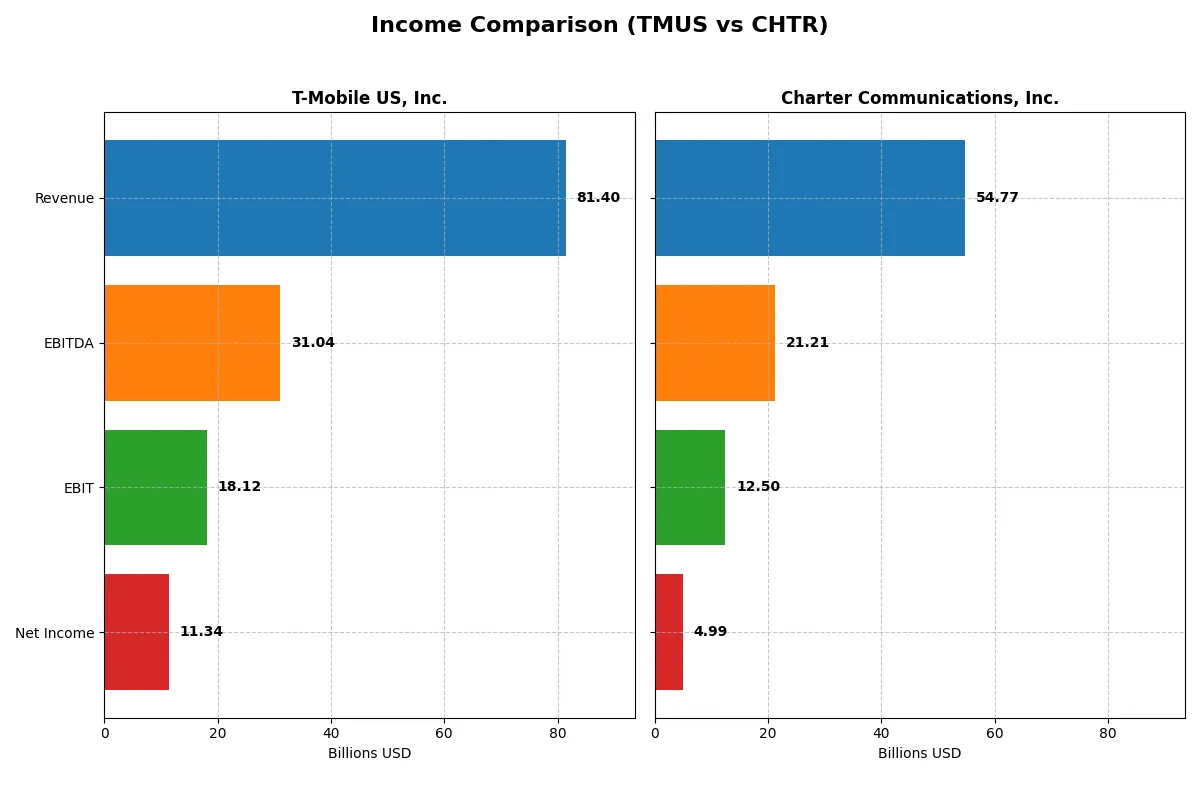
The following data dissects the core profitability and scalability of both corporate engines to reveal who dominates the bottom line:
| Metric | T-Mobile US, Inc. (TMUS) | Charter Communications, Inc. (CHTR) |
|---|---|---|
| Revenue | 81.4B | 55.1B |
| Cost of Revenue | 29.7B | 29.8B |
| Operating Expenses | 33.7B | 12.1B |
| Gross Profit | 51.7B | 25.3B |
| EBITDA | 31.0B | 21.4B |
| EBIT | 18.1B | 12.7B |
| Interest Expense | 3.4B | 5.2B |
| Net Income | 11.3B | 5.1B |
| EPS | 9.7 | 35.5 |
| Fiscal Year | 2024 | 2024 |
Income Statement Analysis: The Bottom-Line Duel
The following income statement comparison uncovers the operational efficiency and profitability momentum driving each company’s financial engine.
T-Mobile US, Inc. Analysis
T-Mobile’s revenue rose steadily by 3.6% in 2024, reaching $81.4B, while net income soared 36% to $11.3B. Its gross margin expanded to 63.6%, reflecting strong cost control, and net margin improved to 13.9%. The company’s EBIT surged 26%, signaling robust operational leverage and efficiency gains.
Charter Communications, Inc. Analysis
Charter’s revenue declined slightly by 0.6% to $54.8B in 2025, with net income falling 2% to $5B. Despite a solid EBIT margin near 22.8%, gross margin held at 46.3%, indicating tighter cost pressures. The company’s interest expense at 9.2% weighs on profitability, dampening net margin growth to 9.1%.
Margin Power vs. Revenue Scale
T-Mobile leads with superior margin expansion and faster net income growth, fueled by efficient operating leverage and strong cost management. Charter maintains respectable EBIT margins but struggles with revenue stagnation and higher interest burdens. For investors prioritizing profitability and growth momentum, T-Mobile’s profile offers a clearer fundamental advantage.
Financial Ratios Comparison
These vital ratios act as a diagnostic tool to expose the underlying fiscal health, valuation premiums, and capital efficiency of the companies analyzed:
| Ratios | T-Mobile US, Inc. (TMUS) | Charter Communications, Inc. (CHTR) |
|---|---|---|
| ROE | 18.37% | 31.06% |
| ROIC | 7.05% | 7.27% |
| P/E | 22.76 | 5.66 |
| P/B | 4.18 | 1.76 |
| Current Ratio | 0.91 | 0.39 |
| Quick Ratio | 0.83 | 0.39 |
| D/E | 1.85 | 5.90 |
| Debt-to-Assets | 54.99% | 61.44% |
| Interest Coverage | 5.28 | 2.64 |
| Asset Turnover | 0.39 | 0.36 |
| Fixed Asset Turnover | 1.21 | 1.18 |
| Payout ratio | 29.10% | 0% |
| Dividend yield | 1.28% | 0% |
| Fiscal Year | 2024 | 2025 |
Efficiency & Valuation Duel: The Vital Signs
Financial ratios act as a company’s DNA, exposing hidden risks and operational strength through profitability, valuation, and liquidity metrics.
T-Mobile US, Inc.
T-Mobile posts a strong 18.4% ROE and solid 13.9% net margin, signaling robust profitability. Its P/E of 22.8 suggests a fairly priced stock, though a high P/B ratio at 4.18 flags valuation risk. The company distributes modest dividends, balancing shareholder returns with reinvestment in growth.
Charter Communications, Inc.
Charter commands a stellar 31.1% ROE but a lower 9.1% net margin, reflecting focused profitability. Its P/E at 5.7 indicates an attractively valued stock. However, zero dividend yield and high debt ratios highlight risk, relying on internal cash for capital needs and growth initiatives.
Valuation Appeal vs. Profitability Strength
Both firms show slightly unfavorable overall ratios, but Charter offers more aggressive returns at a cheaper valuation, while T-Mobile delivers steadier profits and dividends. Risk-tolerant investors may prefer Charter’s high ROE and value; conservative profiles might lean toward T-Mobile’s balanced returns and payout.
Which one offers the Superior Shareholder Reward?
T-Mobile US, Inc. (TMUS) pays a modest dividend yield of 1.28% with a conservative payout ratio near 29%. Its buyback intensity is moderate, supporting shareholder rewards sustainably through steady free cash flow of 8.5B. Charter Communications, Inc. (CHTR) forgoes dividends, reinvesting aggressively in growth while delivering substantial buybacks fueled by robust free cash flow of 32.7B. Historically, I’ve observed that reinvestment combined with buybacks can generate superior value in this sector, but Charter’s heavy leverage and lower liquidity pose risks. I judge TMUS’s balanced distribution approach more sustainable and attractive for total return in 2026, especially amid economic uncertainty.
Comparative Score Analysis: The Strategic Profile
The radar chart reveals the fundamental DNA and trade-offs of both T-Mobile US, Inc. and Charter Communications, Inc.:
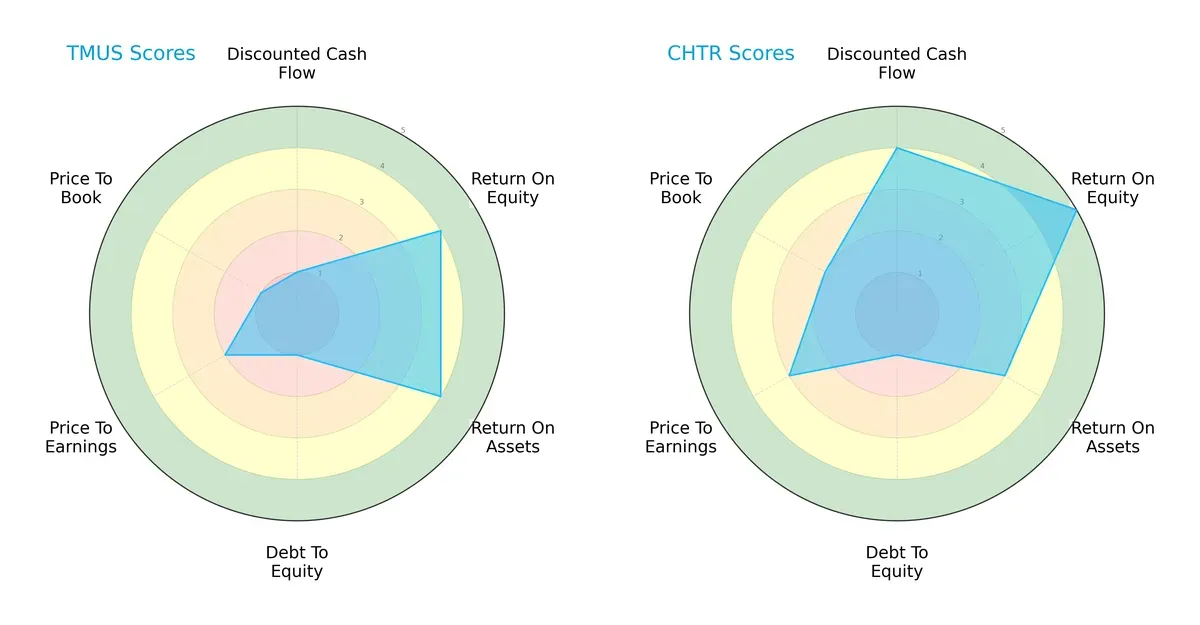
Charter leads with a stronger DCF (4 vs. 1) and ROE (5 vs. 4), indicating superior cash flow valuation and shareholder returns. T-Mobile matches Charter on ROA (4 vs. 3) but lags with very weak debt management (1 each) and valuation metrics (P/E 2 vs. 3, P/B 1 vs. 2). Charter presents a more balanced profile; T-Mobile relies heavily on operational efficiency but struggles on leverage and valuation fronts.
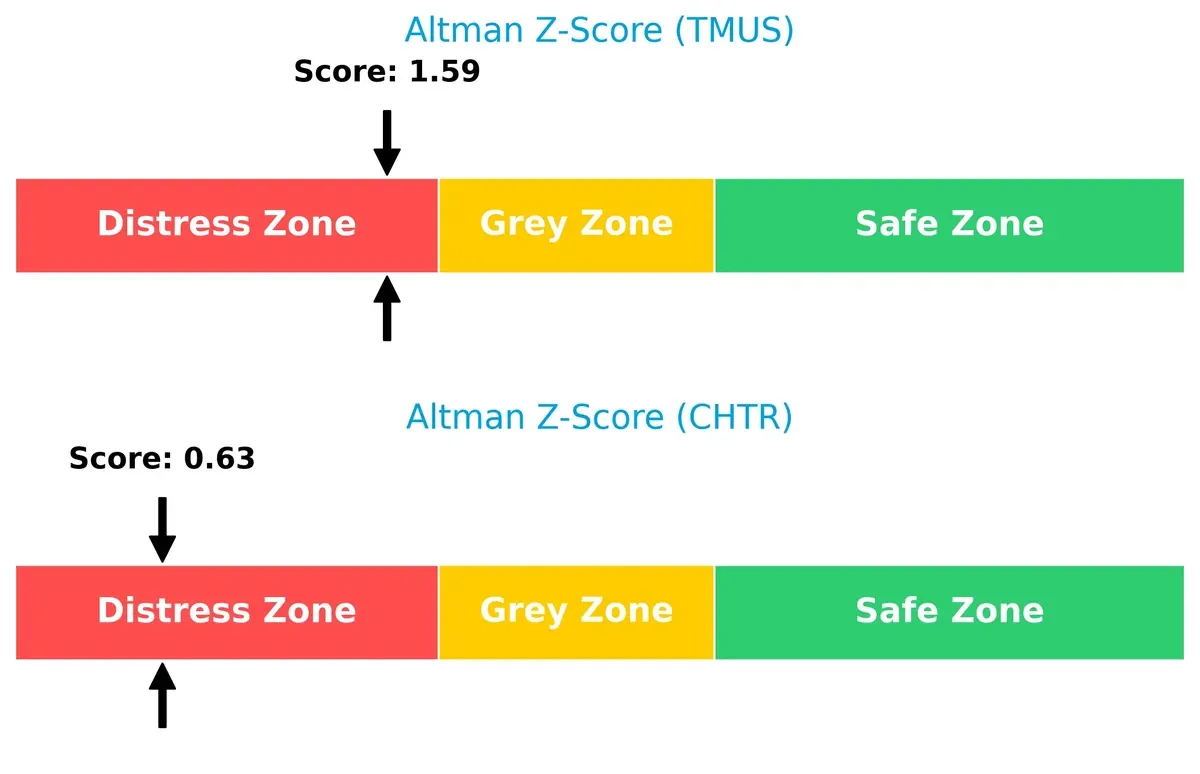
Bankruptcy Risk: Solvency Showdown
Both firms fall in the Altman Z-Score distress zone, but Charter’s score (0.63) is significantly weaker than T-Mobile’s (1.59), signaling higher bankruptcy risk for Charter in this cycle:
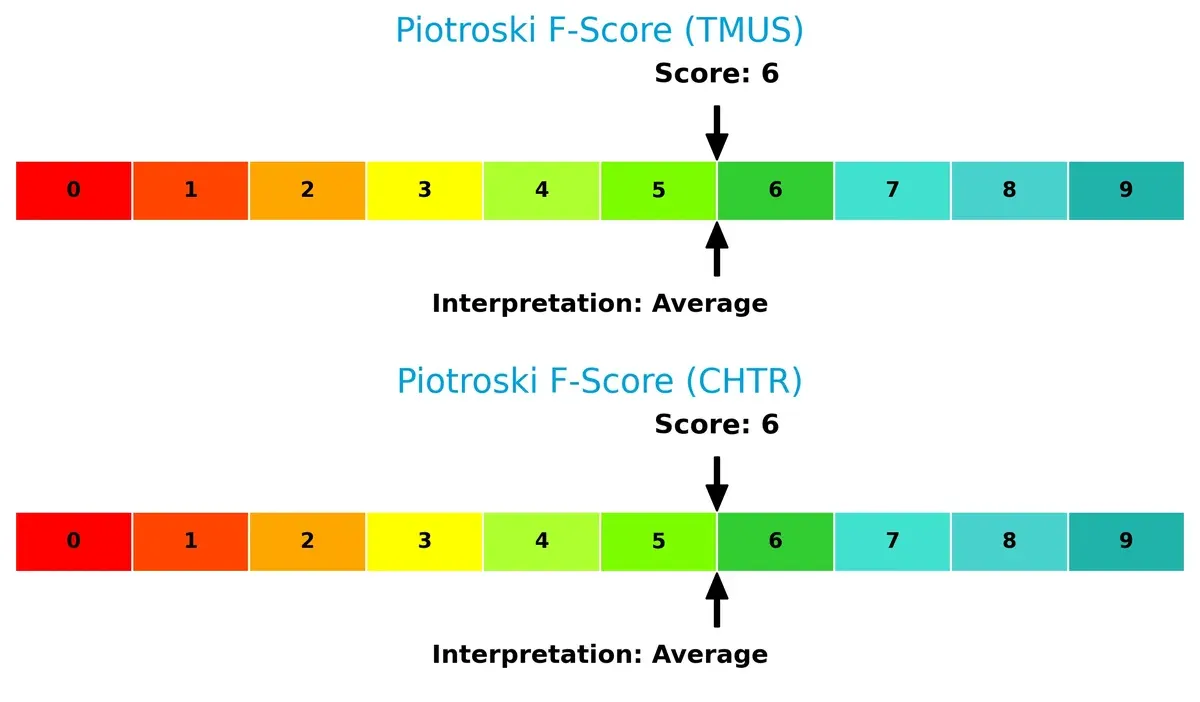
Financial Health: Quality of Operations
T-Mobile and Charter both hold Piotroski F-Scores of 6, reflecting average financial health. Neither shows red flags, but neither excels in internal operational strength either, suggesting moderate quality of earnings and asset management:
How are the two companies positioned?
This section dissects TMUS and CHTR’s operational DNA by comparing revenue distribution and internal dynamics. The goal is to confront their economic moats to identify the more resilient competitive advantage today.
Revenue Segmentation: The Strategic Mix
This comparison dissects how T-Mobile US and Charter Communications diversify their income streams and reveals where their primary sector bets lie:
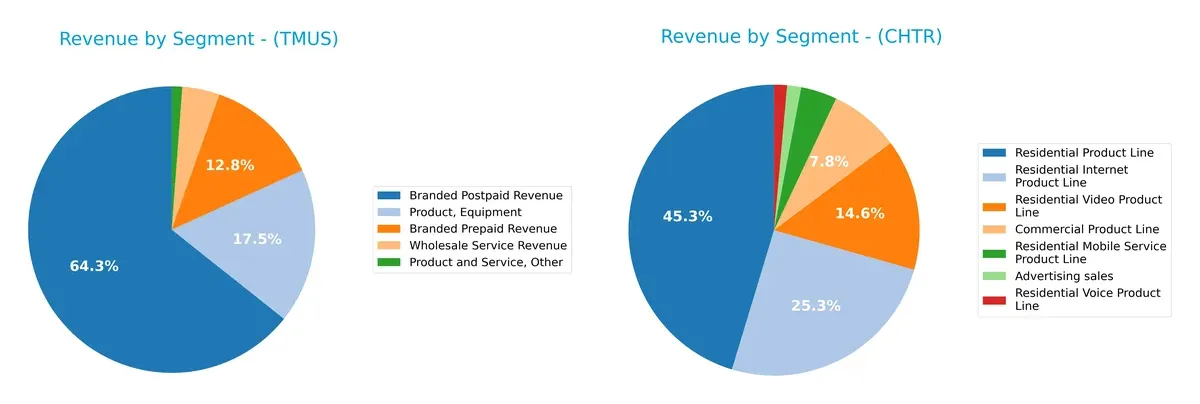
T-Mobile US anchors its revenue in Branded Postpaid ($52.3B) and Product Equipment ($14.3B), showing moderate diversification with prepaid and wholesale streams. Charter Communications pivots around Residential Products ($43.0B), heavily weighted by Internet ($23.4B) and Video ($15.1B) segments, reflecting a focused but broad residential ecosystem. T-Mobile’s mix balances wireless infrastructure and device sales, while Charter’s concentration in residential services hints at concentration risk but also strong ecosystem lock-in.
Strengths and Weaknesses Comparison
This table compares the strengths and weaknesses of T-Mobile US, Inc. and Charter Communications, Inc.:
T-Mobile US Strengths
- Strong net margin at 13.93%
- ROE favorable at 18.37%
- WACC lower than ROIC indicating value creation
- Interest coverage solid at 5.31
- Diverse revenue streams including prepaid, postpaid, equipment
Charter Communications Strengths
- High ROE at 31.06%
- Favorable WACC at 4.82%
- Low P/E ratio of 5.66 suggesting valuation appeal
- Strong residential internet revenue of $23.8B
- Large residential product line at $42.6B
T-Mobile US Weaknesses
- Current ratio below 1 at 0.91 signals liquidity risk
- High debt to assets at 54.99%
- Debt to equity of 1.85 is elevated
- Asset turnover weak at 0.39
- Price to book ratio unfavorable at 4.18
Charter Communications Weaknesses
- Very low liquidity ratios with current and quick ratios at 0.39
- Debt to equity extremely high at 5.9
- Debt to assets at 61.44% indicates leverage risk
- Interest coverage moderate at 2.48
- No dividend yield, possibly limiting income investors
Both companies show strengths in profitability and cost of capital management but face significant leverage and liquidity challenges. This underscores the importance of prudent capital allocation and risk management in their strategic planning.
The Moat Duel: Analyzing Competitive Defensibility
A structural moat shields long-term profits from relentless competitive pressures. It is the essential barrier separating winners from also-rans:
T-Mobile US, Inc.: Network Effects and Scale Advantage
T-Mobile’s moat springs from massive network scale and customer base, driving superior ROIC above WACC by 2.1%. Margin stability and 157% ROIC growth show durable value creation. New 5G rollouts and market expansions in 2026 should deepen this advantage.
Charter Communications, Inc.: Infrastructure-Driven Cost Advantage
Charter’s moat relies on extensive broadband infrastructure and regional dominance, delivering ROIC comfortably above WACC by 2.45%. Unlike T-Mobile’s rapid growth, Charter’s ROIC growth is modest at 7%, but steady profitability supports its durable position. Fiber upgrades and bundled services may enhance competitiveness in 2026.
Verdict: Network Effects vs. Infrastructure Scale
T-Mobile’s rapidly growing ROIC and expansive network create a wider, more durable moat than Charter’s steady but slower infrastructure advantage. T-Mobile is better positioned to defend market share amid evolving technology and consumer demands.
Which stock offers better returns?
Over the past 12 months, T-Mobile US, Inc. showed notable price appreciation with some deceleration, while Charter Communications, Inc. experienced a significant decline despite recent slight positive momentum.
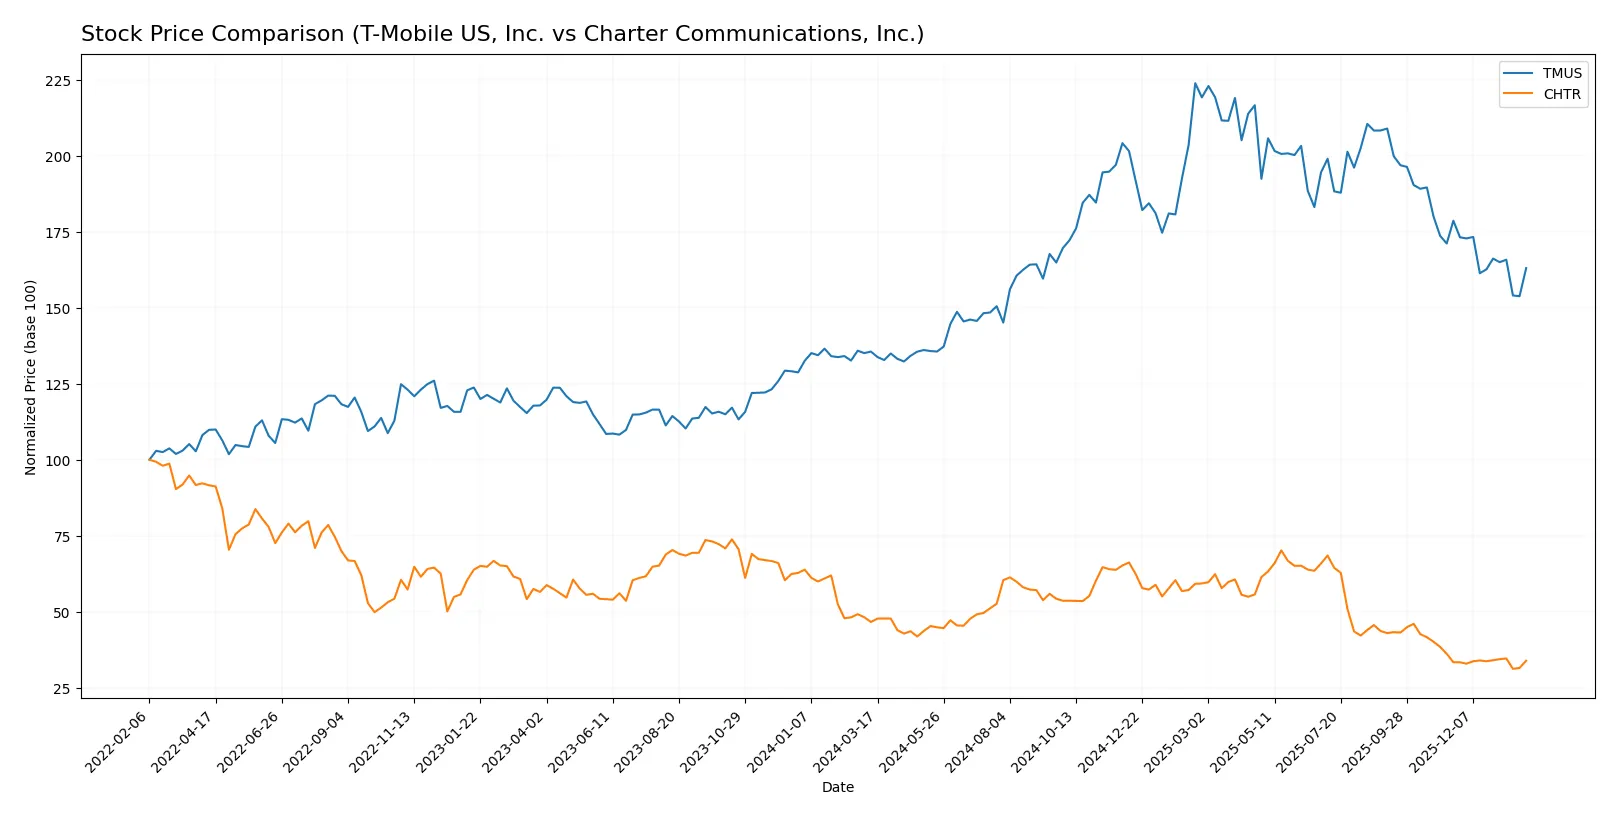
Trend Comparison
T-Mobile US, Inc. recorded a 20.26% price increase over the past year with a decelerating bullish trend and a high price volatility measured by a 31.05 standard deviation.
Charter Communications, Inc. faced a 27.37% price decline during the same period, reflecting an accelerating bearish trend and higher volatility of 63.15 standard deviation.
T-Mobile US outperformed Charter Communications with a strong positive return versus Charter’s steep negative trend over the last 12 months.
Target Prices
Analysts present a mixed but generally optimistic target price consensus for T-Mobile US and Charter Communications.
| Company | Target Low | Target High | Consensus |
|---|---|---|---|
| T-Mobile US, Inc. | 225 | 310 | 260.75 |
| Charter Communications, Inc. | 160 | 500 | 287.5 |
T-Mobile’s target consensus sits about 32% above its current price, signaling confidence in growth. Charter’s wide target range reflects higher uncertainty, but the consensus price implies modest upside from 206.12.

Don’t Let Luck Decide Your Entry Point
Optimize your entry points with our advanced ProRealTime indicators. You’ll get efficient buy signals with precise price targets for maximum performance. Start outperforming now!
How do institutions grade them?
The latest institutional grades for T-Mobile US, Inc. and Charter Communications, Inc. are as follows:
T-Mobile US, Inc. Grades
The following table summarizes recent grades from reputable institutions for T-Mobile US, Inc.:
| Grading Company | Action | New Grade | Date |
|---|---|---|---|
| Wells Fargo | Maintain | Overweight | 2026-01-26 |
| Bernstein | Maintain | Market Perform | 2026-01-16 |
| Citigroup | Maintain | Neutral | 2025-12-19 |
| Goldman Sachs | Maintain | Buy | 2025-12-12 |
| Morgan Stanley | Maintain | Overweight | 2025-12-10 |
| Argus Research | Maintain | Buy | 2025-12-09 |
| Keybanc | Upgrade | Sector Weight | 2025-12-02 |
| Oppenheimer | Downgrade | Perform | 2025-11-21 |
| Tigress Financial | Maintain | Buy | 2025-11-11 |
| Morgan Stanley | Maintain | Overweight | 2025-10-27 |
Charter Communications, Inc. Grades
The following table summarizes recent grades from reputable institutions for Charter Communications, Inc.:
| Grading Company | Action | New Grade | Date |
|---|---|---|---|
| Bernstein | Maintain | Market Perform | 2026-01-16 |
| Wells Fargo | Downgrade | Underweight | 2026-01-13 |
| UBS | Maintain | Neutral | 2025-12-22 |
| Wells Fargo | Maintain | Equal Weight | 2025-11-03 |
| Bernstein | Downgrade | Market Perform | 2025-11-03 |
| RBC Capital | Maintain | Sector Perform | 2025-11-03 |
| Keybanc | Downgrade | Sector Weight | 2025-11-03 |
| Benchmark | Maintain | Buy | 2025-11-03 |
| Citigroup | Maintain | Buy | 2025-11-03 |
| Barclays | Maintain | Underweight | 2025-11-03 |
Which company has the best grades?
T-Mobile US, Inc. consistently holds higher grades like Overweight and Buy from multiple firms, indicating stronger institutional confidence. Charter Communications, Inc. has more neutral or downgraded ratings, reflecting greater uncertainty. Investors may perceive T-Mobile as the more favorably viewed stock.
Risks specific to each company
The following categories identify critical pressure points and systemic threats facing both firms in the 2026 market environment:
1. Market & Competition
T-Mobile US, Inc.
- Strong postpaid customer base with 108.7M users, but faces intense wireless sector competition.
Charter Communications, Inc.
- Serves 32M customers with broadband focus; faces fierce cable and streaming service rivalry.
2. Capital Structure & Debt
T-Mobile US, Inc.
- Debt-to-equity ratio of 1.85 signals high leverage; interest coverage remains favorable at 5.31x.
Charter Communications, Inc.
- Debt-to-equity at 5.9 is very high; interest coverage weaker at 2.48x, increasing financial risk.
3. Stock Volatility
T-Mobile US, Inc.
- Beta of 0.44 shows defensive stock behavior, less sensitive to market swings.
Charter Communications, Inc.
- Beta of 1.06 implies higher volatility, more vulnerable to market fluctuations.
4. Regulatory & Legal
T-Mobile US, Inc.
- Subject to telecom regulations and spectrum licensing; regulatory risks moderate but persistent.
Charter Communications, Inc.
- Cable and broadband services face evolving FCC rules and antitrust scrutiny, posing regulatory challenges.
5. Supply Chain & Operations
T-Mobile US, Inc.
- Operates 143,000 cell sites; network expansion demands significant capital and supply chain reliability.
Charter Communications, Inc.
- Relies on extensive fiber and equipment supply; network upgrades critical amid rising data demand.
6. ESG & Climate Transition
T-Mobile US, Inc.
- Moderate ESG focus with growing pressure to reduce carbon footprint in network operations.
Charter Communications, Inc.
- ESG efforts less visible; climate transition risks include energy-intensive infrastructure and regulatory pressure.
7. Geopolitical Exposure
T-Mobile US, Inc.
- Primarily U.S. focused; geopolitical risks minimal but supply chain disruptions possible.
Charter Communications, Inc.
- Also U.S.-centric; less exposed internationally but vulnerable to domestic policy shifts.
Which company shows a better risk-adjusted profile?
T-Mobile’s most impactful risk is its elevated leverage despite strong interest coverage. Charter’s greatest risk lies in its excessive debt and weaker coverage ratio. Despite both showing “slightly unfavorable” financial ratios, T-Mobile’s lower beta and stronger coverage suggest a comparatively better risk-adjusted profile. Notably, Charter’s debt-to-equity ratio near 6 sharply elevates its financial vulnerability.
Final Verdict: Which stock to choose?
T-Mobile US, Inc. wields unmatched efficiency as its strategic superpower, consistently creating value with a growing ROIC well above its cost of capital. Its main point of vigilance lies in a leveraged balance sheet and weak liquidity metrics. This stock suits aggressive growth portfolios willing to tolerate financial leverage for superior earnings growth.
Charter Communications, Inc. boasts a strategic moat rooted in strong recurring revenue and an impressive return on equity that outshines peers. Relative to T-Mobile, it offers better valuation metrics and a more moderate income growth profile, albeit with equally stretched liquidity. Charter fits well in GARP portfolios seeking stable cash flows at a reasonable price.
If you prioritize rapid earnings expansion and durable competitive advantage, T-Mobile is the compelling choice due to superior income growth and operational efficiency. However, if you seek valuation discipline combined with steady recurring revenues, Charter offers better stability and a more attractive price point despite its financial leverage. Both present analytical scenarios contingent on investor risk tolerance and growth preferences.
Disclaimer: Investment carries a risk of loss of initial capital. The past performance is not a reliable indicator of future results. Be sure to understand risks before making an investment decision.
Go Further
I encourage you to read the complete analyses of T-Mobile US, Inc. and Charter Communications, Inc. to enhance your investment decisions: