In the dynamic healthcare sector, Waters Corporation (WAT) and Charles River Laboratories International, Inc. (CRL) stand out as key players specializing in medical diagnostics and research. Both companies offer innovative solutions that support drug discovery, development, and safety testing, making them direct competitors with overlapping markets. This comparison will help investors understand which company presents the most compelling opportunity in this evolving industry landscape. Let’s explore which stock deserves a place in your portfolio.
Table of contents
Companies Overview
I will begin the comparison between Waters Corporation and Charles River Laboratories by providing an overview of these two companies and their main differences.
Waters Corporation Overview
Waters Corporation is a specialty measurement company focused on providing analytical workflow solutions globally. It designs, manufactures, and services high and ultra-performance liquid chromatography and mass spectrometry systems, along with thermal analysis, rheometry, and calorimetry instruments. Its products serve life science, pharmaceutical, biochemical, and environmental research markets. Waters employs 7,600 people and is headquartered in Milford, Massachusetts.
Charles River Laboratories Overview
Charles River Laboratories International, Inc. is a non-clinical contract research organization offering drug discovery, non-clinical development, and safety testing services worldwide. It operates through three segments: research models and services, discovery and safety assessment, and manufacturing solutions. The company supports pharmaceutical and biotechnology clients with research models, safety assessments, and specialized testing. Charles River employs 18,700 people and is based in Wilmington, Massachusetts.
Key similarities and differences
Both companies operate in the healthcare sector, focusing on supporting pharmaceutical research and development. Waters specializes in analytical instruments and software solutions, while Charles River provides contract research services, animal models, and safety testing. Waters has a smaller workforce and higher market capitalization (23.6B vs. 10.9B), reflecting their different business models in diagnostics and research services.
Income Statement Comparison
The table below compares the key income statement metrics of Waters Corporation and Charles River Laboratories International, Inc. for the fiscal year 2024.

| Metric | Waters Corporation | Charles River Laboratories |
|---|---|---|
| Market Cap | 23.6B | 10.9B |
| Revenue | 2.96B | 4.05B |
| EBITDA | 1.04B | 581M |
| EBIT | 845M | 219M |
| Net Income | 638M | 10.3M |
| EPS | 10.75 | 0.20 |
| Fiscal Year | 2024 | 2024 |
Income Statement Interpretations
Waters Corporation
Waters Corporation saw overall revenue growth of 25.07% from 2020 to 2024, with net income rising by 22.29%. Margins remained largely stable and favorable, with a gross margin of 59.43% and net margin of 21.56%. In 2024, revenue growth slowed to 0.07%, and net margin slightly declined, reflecting some pressure despite continued operational efficiency.
Charles River Laboratories International, Inc.
Charles River Laboratories experienced a 38.51% revenue increase over five years but faced a dramatic net income decline of 97.17%. Gross margin held at a favorable 32.88%, but net margin was minimal at 0.25%. The latest year showed a 1.92% revenue drop and a steep fall in profitability, with margins deteriorating significantly and earnings per share collapsing.
Which one has the stronger fundamentals?
Waters Corporation demonstrates stronger fundamentals with consistent profitability and favorable margins despite recent growth slowing. In contrast, Charles River Laboratories shows troubling net income and margin declines, signaling weaker financial health. Waters’ stable margins and positive net income trends provide a more resilient income statement profile compared to Charles River’s deteriorating earnings.
Financial Ratios Comparison
The table below presents a side-by-side comparison of key financial ratios for Waters Corporation (WAT) and Charles River Laboratories International, Inc. (CRL), based on their most recent fiscal year 2024 data.
| Ratios | Waters Corporation (WAT) | Charles River Laboratories (CRL) |
|---|---|---|
| ROE | 34.88% | 0.30% |
| ROIC | 18.43% | 0.95% |
| P/E | 34.51 | 921.12 |
| P/B | 12.04 | 2.74 |
| Current Ratio | 2.11 | 1.41 |
| Quick Ratio | 1.51 | 1.13 |
| D/E (Debt-to-Equity) | 0.93 | 0.79 |
| Debt-to-Assets | 37.38% | 36.18% |
| Interest Coverage | 9.21 | 1.80 |
| Asset Turnover | 0.65 | 0.54 |
| Fixed Asset Turnover | 4.08 | 2.01 |
| Payout Ratio | 0 | 0 |
| Dividend Yield | 0% | 0% |
Interpretation of the Ratios
Waters Corporation
Waters Corporation displays strong profitability with a net margin of 21.56% and a robust return on equity at 34.88%, both marked as favorable. Liquidity ratios such as the current ratio of 2.11 and quick ratio of 1.51 are also favorable, supporting financial stability. However, valuation multiples like a PE of 34.51 and PB of 12.04 appear high and unfavorable. The company does not pay dividends, possibly reflecting a reinvestment strategy or prioritization of growth and R&D.
Charles River Laboratories International, Inc.
Charles River Laboratories shows weak profitability with a net margin of 0.25% and a low return on equity of 0.3%, both unfavorable. Liquidity is moderate with a current ratio of 1.41 (neutral) but a favorable quick ratio of 1.13. Its interest coverage ratio is low at 1.74, indicating potential financial risk. The firm does not pay dividends, which may be due to reinvestment needs or a focus on acquisitions and development activities.
Which one has the best ratios?
Waters Corporation holds a clear edge with half of its key ratios favorable, including strong profitability and liquidity, despite some overvaluation concerns. In contrast, Charles River Laboratories faces numerous unfavorable ratios, especially in profitability and interest coverage, with only a small portion favorable. Overall, Waters Corporation’s financial ratios appear more solid and balanced compared to Charles River Laboratories.
Strategic Positioning
This section compares the strategic positioning of Waters Corporation and Charles River Laboratories, focusing on market position, key segments, and exposure to technological disruption:
Waters Corporation
- Established market leader with moderate competitive pressure in medical diagnostics and research.
- Diverse product portfolio including chromatography, mass spectrometry, thermal analysis, and software solutions.
- Exposure to technological advances in analytical workflow solutions and lab instrumentation.
Charles River Laboratories
- Mid-sized player facing higher competitive pressure in contract research and testing services.
- Focused on drug discovery, non-clinical development, safety testing, and manufacturing support.
- Exposure to innovation in non-clinical drug discovery, genetically engineered models, and biologics testing.
Waters Corporation vs Charles River Laboratories Positioning
Waters has a diversified product range across analytical instruments and services, providing balanced revenue streams. Charles River concentrates on research models and safety testing, which may intensify dependence on pharmaceutical R&D cycles, impacting stability and growth potential.
Which has the best competitive advantage?
Waters Corporation shows a slightly favorable moat, creating value despite declining profitability. Charles River Laboratories has a very unfavorable moat, destroying value with a steep decline in profitability, indicating weaker competitive advantage.
Stock Comparison
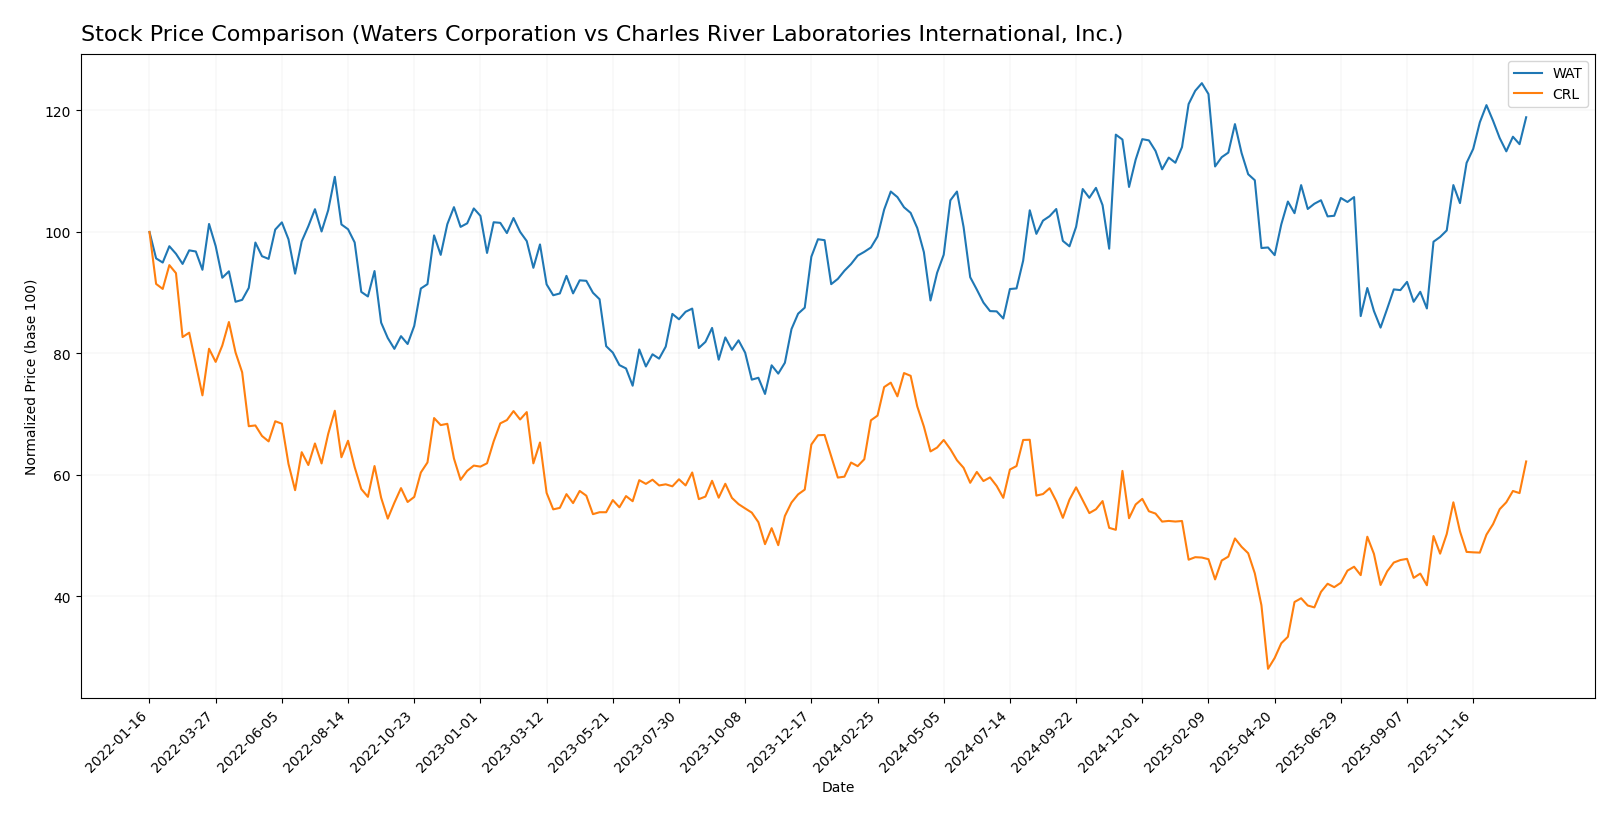
The stock price movements of Waters Corporation and Charles River Laboratories International, Inc. over the past year reveal distinct trends, with Waters showing a strong upward momentum while Charles River demonstrates a downward trajectory despite recent gains.
Trend Analysis
Analyzing Waters Corporation’s stock over the past 12 months, the price increased by 22.0%, indicating a bullish trend with acceleration. The price ranged from a low of 281.2 to a high of 415.48, reflecting significant volatility (std dev 33.33).
Charles River Laboratories’ stock experienced a 9.82% price decline over the past year, a bearish trend with acceleration. The price fluctuated between 99.75 and 272.57, also showing notable volatility (std dev 36.13).
Comparing both, Waters Corporation delivered the highest market performance with a clear bullish trend, while Charles River Laboratories faced a bearish trend despite recent positive momentum.
Target Prices
Analysts present a clear consensus on target prices for Waters Corporation and Charles River Laboratories International, Inc.
| Company | Target High | Target Low | Consensus |
|---|---|---|---|
| Waters Corporation | 480 | 315 | 406.86 |
| Charles River Laboratories, Inc. | 224 | 185 | 204.86 |
The target consensus for Waters Corporation suggests moderate upside potential from the current price of 396.75 USD, while Charles River Laboratories’ targets imply a slight pullback from its current 220.91 USD stock price. Analysts expect Waters to outperform slightly compared to Charles River.
Analyst Opinions Comparison
This section compares analysts’ ratings and grades for Waters Corporation and Charles River Laboratories International, Inc.:
Rating Comparison
Waters Corporation Rating
- Rating: B+, evaluated as Very Favorable.
- Discounted Cash Flow Score: 4, indicates a Favorable value.
- ROE Score: 5, reflects a Very Favorable profitability metric.
- ROA Score: 5, shows a Very Favorable asset utilization.
- Debt To Equity Score: 1, considered Very Unfavorable risk.
- Overall Score: 3, rated as Moderate overall financial health.
Charles River Laboratories Rating
- Rating: C, evaluated as Very Favorable.
- Discounted Cash Flow Score: 4, indicates a Favorable value.
- ROE Score: 1, reflects a Very Unfavorable profitability metric.
- ROA Score: 1, shows a Very Unfavorable asset utilization.
- Debt To Equity Score: 1, considered Very Unfavorable risk.
- Overall Score: 2, rated as Moderate overall financial health.
Which one is the best rated?
Waters Corporation holds a higher overall rating (B+) and outperforms Charles River Laboratories in return on equity and assets scores. Both share identical discounted cash flow and debt-to-equity scores, but Waters shows stronger profitability metrics.
Scores Comparison
Below is the comparison of Waters Corporation and Charles River Laboratories scores:
WAT Scores
- Altman Z-Score: 9.73, indicating a safe zone.
- Piotroski Score: 6, reflecting average strength.
CRL Scores
- Altman Z-Score: 2.27, indicating a grey zone.
- Piotroski Score: 6, reflecting average strength.
Which company has the best scores?
Waters Corporation has a significantly higher Altman Z-Score, placing it in the safe zone, while Charles River Laboratories remains in the grey zone. Both companies have the same Piotroski Score of 6, indicating average financial strength.
Grades Comparison
The following section presents a comparison of recent grades for Waters Corporation and Charles River Laboratories International, Inc.:
Waters Corporation Grades
This table summarizes recent grades and rating actions from recognized grading companies for Waters Corporation.
| Grading Company | Action | New Grade | Date |
|---|---|---|---|
| Wells Fargo | Maintain | Equal Weight | 2025-12-15 |
| Wolfe Research | Upgrade | Outperform | 2025-12-10 |
| Wells Fargo | Maintain | Equal Weight | 2025-11-05 |
| TD Cowen | Maintain | Hold | 2025-11-05 |
| JP Morgan | Maintain | Neutral | 2025-10-09 |
| Wells Fargo | Maintain | Equal Weight | 2025-08-05 |
| Deutsche Bank | Maintain | Hold | 2025-08-05 |
| Jefferies | Maintain | Buy | 2025-08-04 |
| Baird | Maintain | Outperform | 2025-07-16 |
| Wells Fargo | Downgrade | Equal Weight | 2025-07-15 |
Overall, Waters Corporation’s grades mostly cluster around Hold to Equal Weight, with occasional upgrades to Outperform and Buy, showing a generally cautious outlook from analysts.
Charles River Laboratories International, Inc. Grades
This table lists recent grades and rating actions from credible grading companies for Charles River Laboratories.
| Grading Company | Action | New Grade | Date |
|---|---|---|---|
| Mizuho | Maintain | Neutral | 2025-12-18 |
| JP Morgan | Maintain | Neutral | 2025-12-15 |
| Barclays | Maintain | Overweight | 2025-12-15 |
| Morgan Stanley | Maintain | Equal Weight | 2025-11-11 |
| TD Cowen | Maintain | Buy | 2025-11-10 |
| Baird | Upgrade | Outperform | 2025-11-06 |
| Barclays | Maintain | Overweight | 2025-11-06 |
| JP Morgan | Maintain | Neutral | 2025-11-06 |
| Mizuho | Maintain | Neutral | 2025-10-17 |
| William Blair | Upgrade | Outperform | 2025-10-06 |
Charles River Laboratories has consistently received favorable grades ranging from Neutral to Overweight and Outperform, indicating a generally positive analyst sentiment.
Which company has the best grades?
Charles River Laboratories holds a stronger overall consensus with more Buy and Outperform ratings, while Waters Corporation’s grades lean toward Hold and Equal Weight. This suggests analysts may view Charles River as having better growth or value potential, influencing investor confidence accordingly.
Strengths and Weaknesses
Below is a comparison of key strengths and weaknesses of Waters Corporation (WAT) and Charles River Laboratories International, Inc. (CRL) based on their latest financial and operational data.
| Criterion | Waters Corporation (WAT) | Charles River Laboratories (CRL) |
|---|---|---|
| Diversification | Diverse product segments including instruments and services, with balanced revenue streams (e.g., Waters Instrument Systems $1.03B, Waters Service $1.01B in 2024) | Focused on three main segments: Discovery and Safety Assessment ($2.45B), Manufacturing Support ($769M), Research Models and Services ($829M) |
| Profitability | Strong profitability with net margin 21.56%, ROIC 18.43%, ROE 34.88% (2024) | Weak profitability with net margin 0.25%, ROIC 0.95%, ROE 0.3% (2024) |
| Innovation | Maintains innovation in analytical instruments and consumables, supporting stable revenue growth | Innovation challenged, reflected in declining ROIC and high PE ratio (921.12) indicating overvaluation risk |
| Global presence | Established global footprint with steady service and instrument sales growth | Global presence with large revenues but profitability and operational efficiency issues |
| Market Share | Strong market player in analytical instruments with consistent value creation | Facing difficulties maintaining market share profitably, evidenced by value destruction and declining ROIC |
Key takeaways: Waters Corporation exhibits a stronger financial position and diversified revenue base, creating value despite some profitability erosion. Charles River Laboratories struggles with profitability and value creation, highlighting higher investment risk. Caution is advised when considering CRL for portfolios seeking stable returns.
Risk Analysis
Below is a comparative risk table for Waters Corporation (WAT) and Charles River Laboratories International, Inc. (CRL) based on the latest 2024 data:
| Metric | Waters Corporation (WAT) | Charles River Laboratories (CRL) |
|---|---|---|
| Market Risk | Moderate (Beta 1.16) | Higher (Beta 1.62) |
| Debt level | Moderate (Debt-to-Equity ~0.93) | Moderate (Debt-to-Equity ~0.79) |
| Regulatory Risk | Moderate (Healthcare sector) | Moderate (Healthcare sector) |
| Operational Risk | Low (Strong margin & ROE) | Higher (Very low margin & ROE) |
| Environmental Risk | Low | Low |
| Geopolitical Risk | Low (Primarily US operations) | Low (Primarily US operations) |
Waters Corporation shows moderate market and debt risks but benefits from strong profitability and financial stability, reducing operational risks. Charles River Laboratories faces higher market risk and operational challenges due to very low profitability and debt coverage concerns, making it more vulnerable. Investors should weigh Waters’ stronger financial health against Charles River’s elevated operational and financial risks.
Which Stock to Choose?
Waters Corporation (WAT) shows a favorable income statement with a 21.56% net margin and strong profitability ratios including a 34.88% ROE and 18.43% ROIC. Its debt level is moderate with a net debt to EBITDA of 1.33, and it holds a very favorable B+ rating supported by solid cash flow and a safe Altman Z-score of 9.73.
Charles River Laboratories International, Inc. (CRL) exhibits an unfavorable income evolution with a very low 0.25% net margin and weak profitability ratios such as 0.3% ROE and 0.95% ROIC. The company carries higher leverage with a net debt to EBITDA of 4.35 and a very unfavorable rating C, while its Altman Z-score of 2.27 places it in a grey zone.
Based on ratings and financial metrics, Waters Corporation might appear more favorable for investors seeking quality and profitability, whereas Charles River Laboratories could be considered by those with a risk-tolerant profile interested in potential turnaround opportunities despite current weak fundamentals.
Disclaimer: Investment carries a risk of loss of initial capital. The past performance is not a reliable indicator of future results. Be sure to understand risks before making an investment decision.
Go Further
I encourage you to read the complete analyses of Waters Corporation and Charles River Laboratories International, Inc. to enhance your investment decisions: