Home > Comparison > Healthcare > TMO vs CRL
The strategic rivalry between Thermo Fisher Scientific Inc. and Charles River Laboratories International defines the current trajectory of the healthcare diagnostics and research sector. Thermo Fisher operates as a capital-intensive life sciences solutions provider with broad product lines, while Charles River focuses on specialized contract research and safety testing services. This analysis examines their divergent growth models and operational moats to identify which company offers the superior risk-adjusted return for a diversified portfolio.
Table of contents
Companies Overview
Thermo Fisher Scientific and Charles River Laboratories shape critical segments of the global life sciences research market.
Thermo Fisher Scientific Inc.: Global Life Sciences Powerhouse
Thermo Fisher dominates the Medical – Diagnostics & Research sector with a diverse portfolio spanning reagents, instruments, and biopharma services. Its core revenue derives from Life Sciences Solutions and Analytical Instruments sold worldwide. In 2026, the company emphasizes expanding integrated solutions that streamline drug discovery and diagnostics for pharmaceutical, biotech, and academic clients.
Charles River Laboratories International, Inc.: Specialized Contract Research Leader
Charles River excels as a non-clinical contract research organization, supporting drug discovery and safety testing globally. Its revenue hinges on Research Models, Safety Assessment, and Manufacturing services tailored for pharmaceutical and biotech firms. In 2026, the firm focuses on enhancing early-stage drug candidate development and specialized biologics testing to deepen client partnerships.
Strategic Collision: Similarities & Divergences
Both companies serve the life sciences industry but with distinct approaches: Thermo Fisher offers a broad integrated product and service ecosystem, while Charles River specializes in contract research and testing services. They compete primarily in drug discovery support but target different phases and client needs. This creates divergent investment profiles—Thermo Fisher as a diversified industrial leader, Charles River as a focused service innovator.
Income Statement Comparison
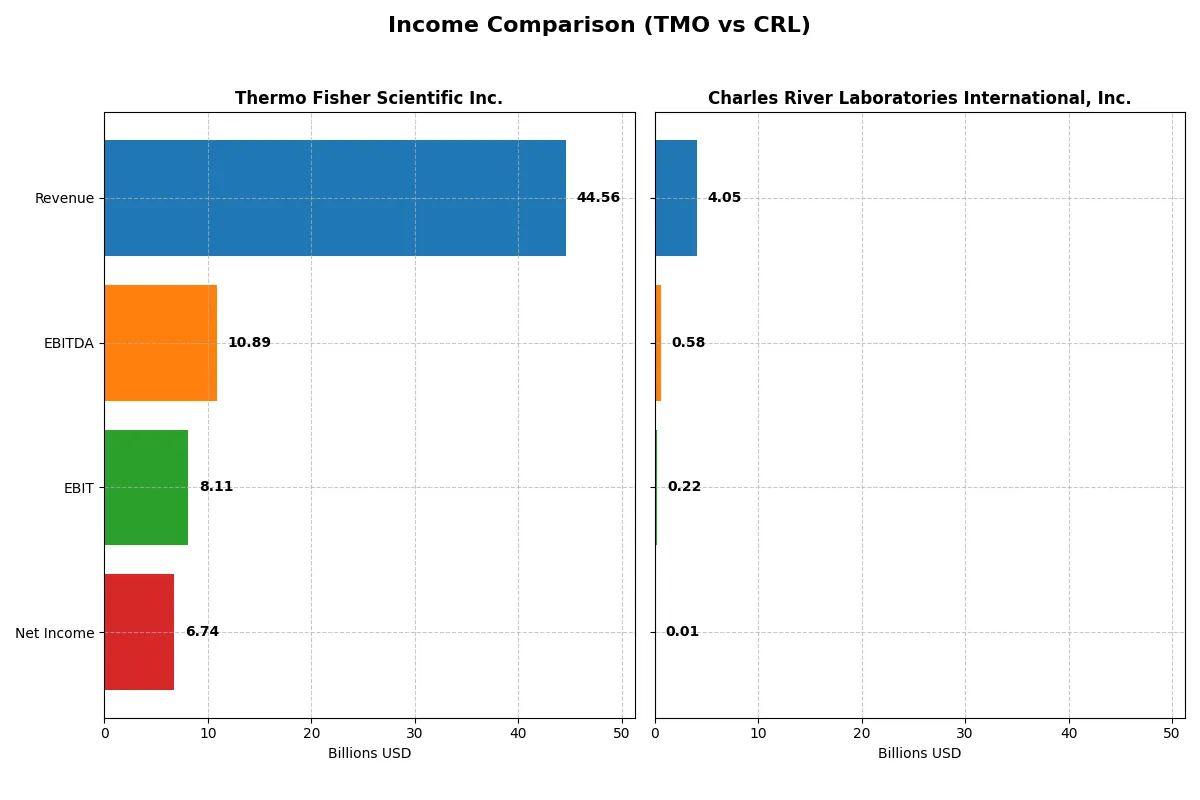
This data dissects the core profitability and scalability of both corporate engines to reveal who dominates the bottom line:
| Metric | Thermo Fisher Scientific Inc. (TMO) | Charles River Laboratories International, Inc. (CRL) |
|---|---|---|
| Revenue | 44.6B | 4.05B |
| Cost of Revenue | 27.8B | 2.72B |
| Operating Expenses | 8.67B | 1.10B |
| Gross Profit | 16.8B | 1.33B |
| EBITDA | 10.9B | 581M |
| EBIT | 8.11B | 219M |
| Interest Expense | 1.42B | 126M |
| Net Income | 6.74B | 10.3M |
| EPS | 17.77 | 0.20 |
| Fiscal Year | 2025 | 2024 |
Income Statement Analysis: The Bottom-Line Duel
This income statement comparison reveals which company operates more efficiently and delivers stronger profitability under prevailing market conditions.
Thermo Fisher Scientific Inc. Analysis
Thermo Fisher’s revenue climbed steadily from 39.2B in 2021 to 44.6B in 2025, though net income declined from 7.7B to 6.7B over the same period. Its gross margin remains robust at 37.7%, while net margin holds a favorable 15.1%, signaling effective cost control. Despite a slight dip in gross profit and EBIT in 2025, EPS grew 7.3%, highlighting operational resilience.
Charles River Laboratories International, Inc. Analysis
Charles River’s revenue rose from 2.9B in 2020 to 4.0B in 2024, but net income collapsed dramatically from 364M to just 10M. Gross margin stands at a decent 32.9%, yet net margin plummeted to a neutral 0.25%. The latest year showed a sharp 69% EBIT decline and a near-total wipeout of net margin and EPS, signaling severe profitability challenges despite top-line growth.
Margin Strength vs. Profitability Collapse
Thermo Fisher demonstrates superior margin health and consistent profitability despite minor setbacks in profit growth. Charles River shows strong revenue gains but suffers a catastrophic profit erosion, reflected in near-zero net margins. For investors, Thermo Fisher’s profile offers more stable earnings and operational efficiency, while Charles River’s recent earnings volatility warrants caution.
Financial Ratios Comparison
These vital ratios act as a diagnostic tool to expose the underlying fiscal health, valuation premiums, and capital efficiency of each company:
| Ratios | Thermo Fisher Scientific Inc. (TMO) | Charles River Laboratories International, Inc. (CRL) |
|---|---|---|
| ROE | 12.6% | 0.3% |
| ROIC | 7.6% | 0.9% |
| P/E | 32.3 | 928.9 |
| P/B | 4.1 | 2.8 |
| Current Ratio | 1.89 | 1.41 |
| Quick Ratio | 1.53 | 1.13 |
| D/E (Debt-to-Equity) | 0.74 | 0.79 |
| Debt-to-Assets | 35.7% | 36.2% |
| Interest Coverage | 5.7 | 1.8 |
| Asset Turnover | 0.40 | 0.54 |
| Fixed Asset Turnover | 4.22 | 2.01 |
| Payout Ratio | 9.4% | 0% |
| Dividend Yield | 0.29% | 0% |
| Fiscal Year | 2025 | 2024 |
Efficiency & Valuation Duel: The Vital Signs
Financial ratios serve as a company’s DNA, exposing hidden risks and operational efficiency that raw numbers often conceal.
Thermo Fisher Scientific Inc.
Thermo Fisher displays solid profitability with a 12.6% ROE and a favorable 15.1% net margin, reflecting operational strength. Its valuation appears stretched, with a high P/E of 32.3 and P/B of 4.08. Dividend yield is minimal at 0.29%, signaling a focus on reinvesting for growth and innovation through R&D.
Charles River Laboratories International, Inc.
Charles River shows weak profitability, with a 0.3% ROE and a negligible 0.25% net margin, indicating operational challenges. The P/E ratio is extremely elevated at 928.9, marking the stock as highly expensive. The company pays no dividends, likely prioritizing internal capital allocation amid financial constraints.
Premium Valuation vs. Operational Safety
Thermo Fisher balances higher profitability and modest growth reinvestment despite a premium valuation. Charles River suffers from profitability and valuation risks, signaling caution. Investors seeking operational safety may favor Thermo Fisher, while those chasing speculative upside could consider Charles River’s profile.
Which one offers the Superior Shareholder Reward?
Thermo Fisher Scientific Inc. (TMO) pays a modest 0.29% dividend yield with a low 9.4% payout ratio, well-covered by strong free cash flow (FCF) at 80%. Its robust buyback program further enhances shareholder value. Charles River Laboratories (CRL) pays no dividend, reinvesting heavily in growth and acquisitions but with weaker net margin (0.25%) and less efficient capital returns. TMO’s balanced distribution, combining dividends and aggressive buybacks, offers a more sustainable and attractive total return profile for 2026 investors.
Comparative Score Analysis: The Strategic Profile
The radar chart reveals the fundamental DNA and trade-offs of Thermo Fisher Scientific Inc. and Charles River Laboratories International, Inc.:

Thermo Fisher shows a balanced strength in DCF, ROE, and ROA with moderate valuation scores, but a very unfavorable debt-to-equity position. Charles River matches Thermo Fisher’s DCF score but lags significantly in profitability metrics and valuation, while sharing the weak debt profile. Thermo Fisher’s diversified edge contrasts with Charles River’s reliance on few favorable metrics.
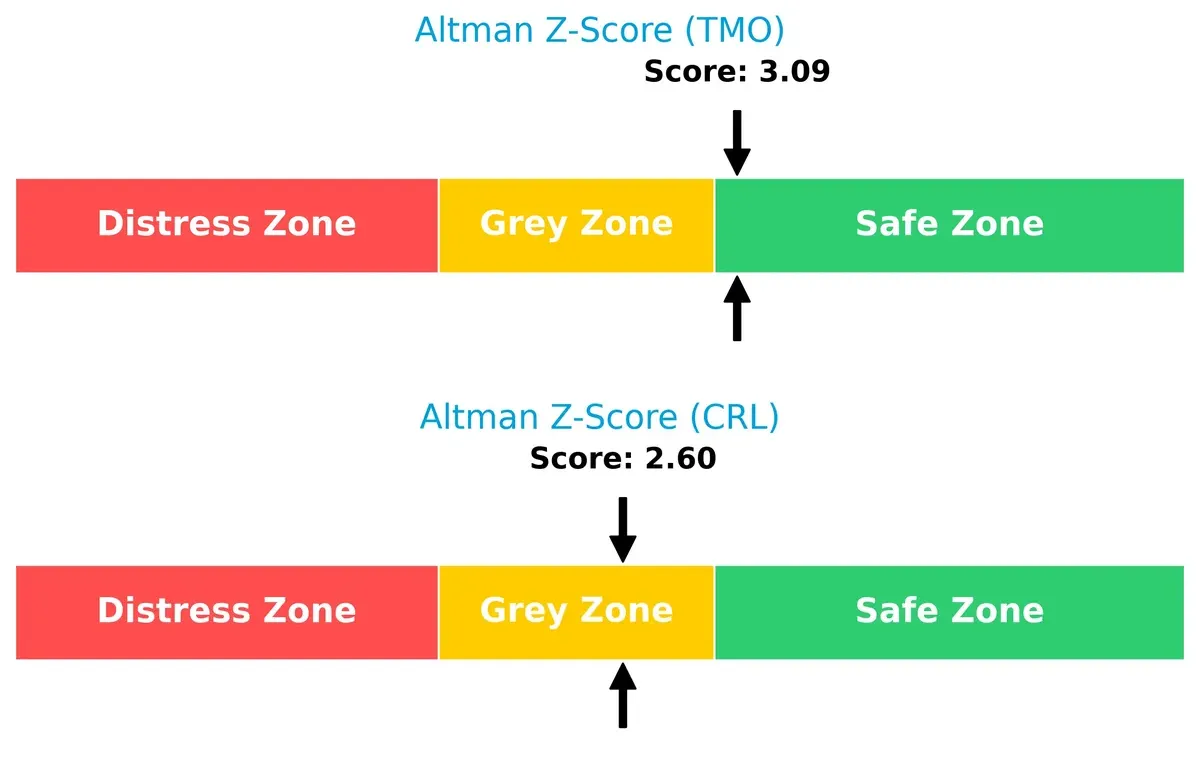
Bankruptcy Risk: Solvency Showdown
Thermo Fisher’s Altman Z-Score comfortably sits in the safe zone at 3.09, indicating strong solvency. Charles River’s 2.60 places it in the grey zone, signaling moderate bankruptcy risk amid current market pressures:
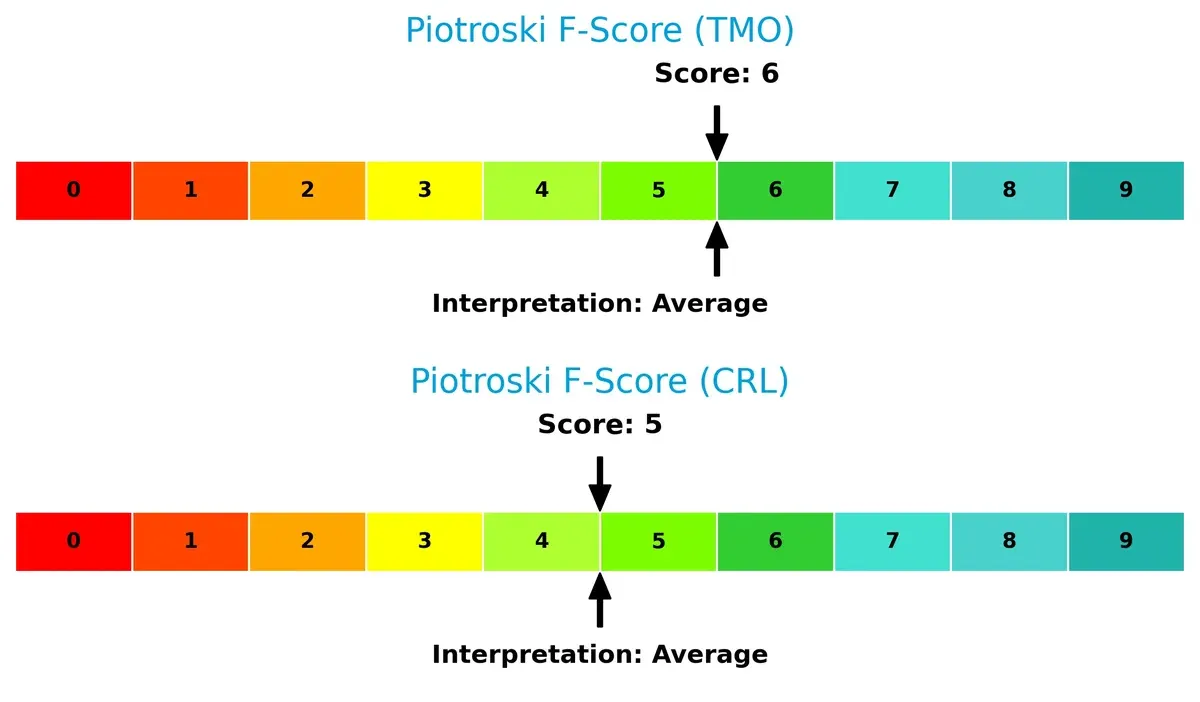
Financial Health: Quality of Operations
Thermo Fisher’s Piotroski F-Score of 6 slightly outperforms Charles River’s 5, suggesting marginally better operational quality and fewer financial red flags amid complex sector dynamics:
How are the two companies positioned?
This section dissects the operational DNA of Thermo Fisher Scientific and Charles River by comparing their revenue distribution by segment and internal dynamics. The goal is to confront their economic moats and identify which business model delivers the most resilient and sustainable competitive advantage today.
Revenue Segmentation: The Strategic Mix
This visual comparison dissects how Thermo Fisher Scientific and Charles River Laboratories diversify their income streams and where their primary sector bets lie:
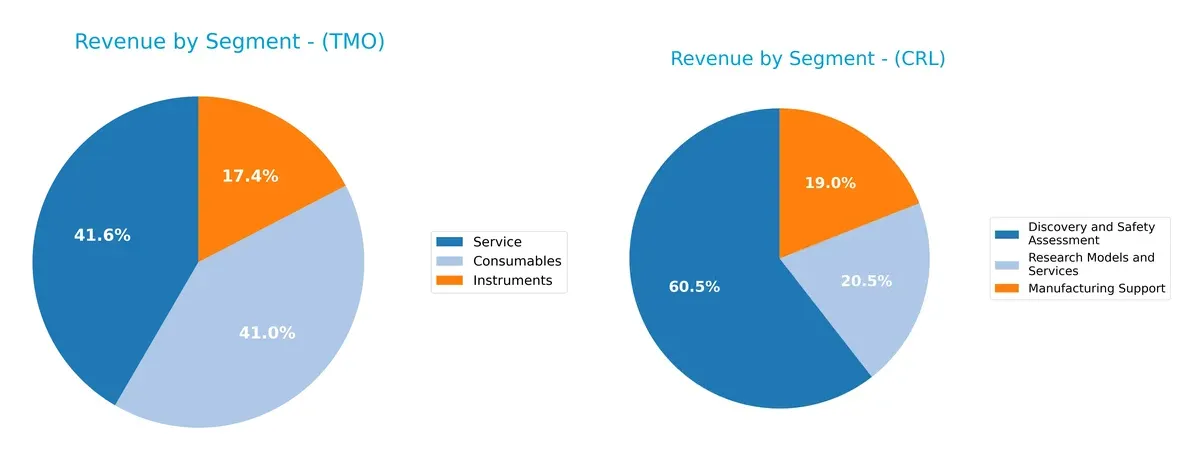
Thermo Fisher Scientific anchors its revenue in three robust segments: Consumables ($17.6B), Services ($17.8B), and Instruments ($7.4B), showcasing a balanced ecosystem lock-in. Charles River leans heavily on Discovery and Safety Assessment ($2.45B), dwarfing its Manufacturing Support ($770M) and Research Models ($830M). Thermo Fisher’s diversified mix mitigates concentration risk, while Charles River’s focus signals dependency on a core market niche, exposing it to sector-specific volatility.
Strengths and Weaknesses Comparison
This table compares the strengths and weaknesses of Thermo Fisher Scientific Inc. and Charles River Laboratories International, Inc.:
Thermo Fisher Scientific Inc. Strengths
- Strong diversification across consumables, instruments, and services
- Favorable net margin at 15.12%
- Solid liquidity with current ratio 1.89 and quick ratio 1.53
- Global presence with significant revenue in US, Europe, Asia Pacific
- Favorable fixed asset turnover at 4.22
Charles River Laboratories International, Inc. Strengths
- Diversified revenue from discovery, manufacturing support, research models
- Favorable quick ratio at 1.13
- Neutral price-to-book ratio at 2.76
- Established US and European market presence
- Neutral asset turnover at 0.54
Thermo Fisher Scientific Inc. Weaknesses
- High valuation multiples with P/E at 32.34 and P/B at 4.08
- Unfavorable asset turnover at 0.4 indicating lower operational efficiency
- Low dividend yield at 0.29%
- Neutral ROE and ROIC near WACC suggest limited value creation
Charles River Laboratories International, Inc. Weaknesses
- Unfavorable profitability with net margin at 0.25% and ROE at 0.3%
- High P/E ratio at 928.9 signals overvaluation or low earnings
- Low interest coverage ratio at 1.74 raises solvency concerns
- Zero dividend yield
- Slightly unfavorable global ratios with 42.86% unfavorable metrics
Thermo Fisher’s strengths lie in diversified revenues, profitability, and liquidity, though valuation and asset efficiency raise questions. Charles River shows moderate diversification and liquidity but faces significant profitability and solvency challenges, affecting its financial stability narrative.
The Moat Duel: Analyzing Competitive Defensibility
A structural moat is the only reliable barrier preserving long-term profits against relentless competitive erosion. Let’s dissect the moats of two healthcare leaders:
Thermo Fisher Scientific Inc.: Intangible Assets and Scale Moat
Thermo Fisher’s moat stems from vast intangible assets and unmatched scale, reflected in its stable 18.2% EBIT margin. Yet, a 28.9% ROIC decline signals pressure, though expansion into biopharma services may bolster defenses in 2026.
Charles River Laboratories International, Inc.: Specialized Service Moat
Charles River’s moat relies on specialized drug discovery services, contrasting Thermo Fisher’s breadth. However, its very unfavorable ROIC trend and sharp margin erosion highlight vulnerability. New safety assessment innovations could offer a growth lifeline.
Scale and Intangibles vs. Specialized Expertise: The Moat Battle
Thermo Fisher wields a wider, more durable moat, anchored by scale and intangible assets. Charles River’s narrow moat faces steep profitability declines, leaving Thermo Fisher better positioned to shield market share amid intensifying competition.
Which stock offers better returns?
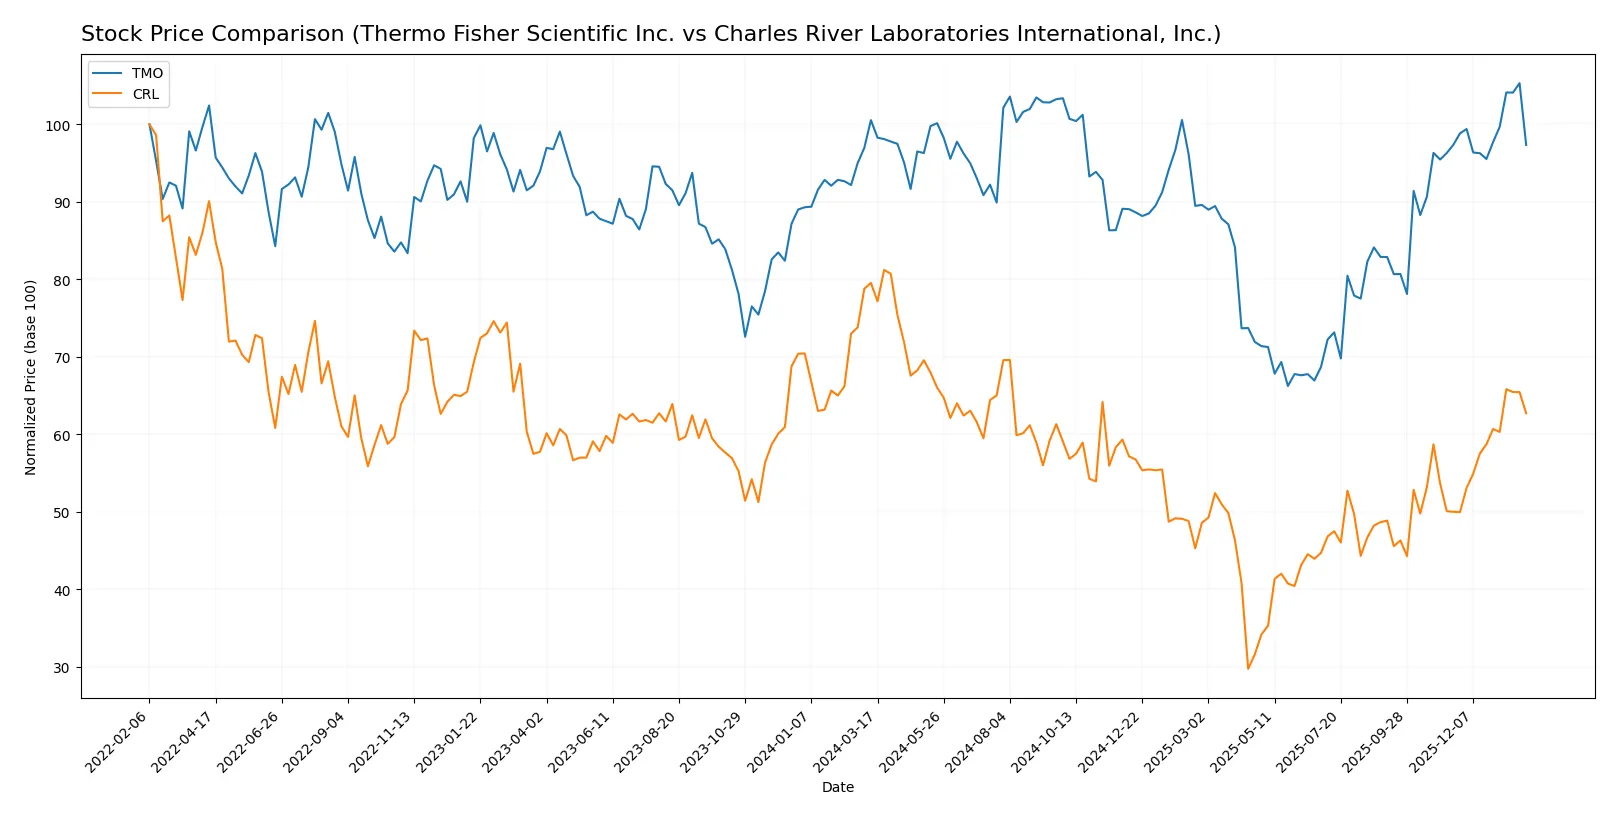
The past year shows contrasting stock dynamics: Thermo Fisher Scientific Inc. endured a mild overall decline with recent stabilization, while Charles River Laboratories International, Inc. faced a steep drop followed by a sharp rebound.
Trend Comparison
Thermo Fisher Scientific’s stock declined by 3.18% over the past 12 months, marking a bearish trend with accelerating losses. The price ranged from a high of 625.98 to a low of 393.66, reflecting substantial volatility.
Charles River Laboratories’ stock registered a 21.16% decline over the same period, a clear bearish trend with accelerating downside. However, the recent months show a strong 25.43% price surge, indicating a sharp recovery phase.
Comparing both, Thermo Fisher’s loss was less severe than Charles River’s overall drop, but Charles River’s recent rebound outperforms, delivering higher market momentum in the latest months.
Target Prices
Analysts present a bullish consensus for both Thermo Fisher Scientific Inc. and Charles River Laboratories International, Inc.
| Company | Target Low | Target High | Consensus |
|---|---|---|---|
| Thermo Fisher Scientific Inc. | 561 | 750 | 643.69 |
| Charles River Laboratories International, Inc. | 185 | 260 | 214.43 |
Thermo Fisher’s target consensus of 644 suggests a 11% upside from the current 579 price. Charles River’s consensus at 214 implies a slight 2% upside from 210.48.

Don’t Let Luck Decide Your Entry Point
Optimize your entry points with our advanced ProRealTime indicators. You’ll get efficient buy signals with precise price targets for maximum performance. Start outperforming now!
How do institutions grade them?
Thermo Fisher Scientific Inc. Grades
Here are recent grades and rating actions from major financial institutions for Thermo Fisher Scientific Inc.:
| Grading Company | Action | New Grade | Date |
|---|---|---|---|
| TD Cowen | Maintain | Buy | 2026-01-30 |
| Barclays | Maintain | Overweight | 2026-01-30 |
| Citigroup | Maintain | Buy | 2026-01-30 |
| Stifel | Maintain | Buy | 2026-01-09 |
| TD Cowen | Maintain | Buy | 2026-01-07 |
| Wells Fargo | Maintain | Overweight | 2025-12-15 |
| Citigroup | Upgrade | Buy | 2025-12-11 |
| Keybanc | Upgrade | Overweight | 2025-12-08 |
| Morgan Stanley | Maintain | Overweight | 2025-12-02 |
| HSBC | Upgrade | Buy | 2025-12-01 |
Charles River Laboratories International, Inc. Grades
Below are recent grades and rating actions from recognized institutions for Charles River Laboratories International, Inc.:
| Grading Company | Action | New Grade | Date |
|---|---|---|---|
| Citigroup | Maintain | Buy | 2026-01-16 |
| Evercore ISI Group | Maintain | Outperform | 2026-01-13 |
| Mizuho | Maintain | Neutral | 2025-12-18 |
| Barclays | Maintain | Overweight | 2025-12-15 |
| JP Morgan | Maintain | Neutral | 2025-12-15 |
| Morgan Stanley | Maintain | Equal Weight | 2025-11-11 |
| TD Cowen | Maintain | Buy | 2025-11-10 |
| Baird | Upgrade | Outperform | 2025-11-06 |
| Barclays | Maintain | Overweight | 2025-11-06 |
| JP Morgan | Maintain | Neutral | 2025-11-06 |
Which company has the best grades?
Thermo Fisher Scientific consistently receives Buy and Overweight ratings from top firms, reflecting stronger confidence. Charles River Laboratories has more mixed Neutral and Equal Weight grades, indicating a more cautious stance. Better grades may attract more investor interest in Thermo Fisher.
Risks specific to each company
The following categories identify the critical pressure points and systemic threats facing both firms in the 2026 market environment:
1. Market & Competition
Thermo Fisher Scientific Inc.
- Dominates with broad life sciences solutions and strong brand moats in diagnostics and research.
Charles River Laboratories International, Inc.
- Focuses on niche contract research and testing services, facing intense competition and smaller scale.
2. Capital Structure & Debt
Thermo Fisher Scientific Inc.
- Maintains moderate leverage (D/E 0.74) with favorable interest coverage (5.71x), indicating solid debt management.
Charles River Laboratories International, Inc.
- Similar leverage (D/E 0.79) but weaker interest coverage (1.74x) raises concerns about servicing debt comfortably.
3. Stock Volatility
Thermo Fisher Scientific Inc.
- Beta at 0.91 signals lower volatility than the market, appealing for risk-averse investors.
Charles River Laboratories International, Inc.
- High beta of 1.62 indicates elevated price swings and higher market risk exposure.
4. Regulatory & Legal
Thermo Fisher Scientific Inc.
- Operates globally with complex compliance demands but benefits from diversified regulatory risk.
Charles River Laboratories International, Inc.
- Faces regulatory scrutiny in drug discovery and safety testing, with less diversification to absorb shocks.
5. Supply Chain & Operations
Thermo Fisher Scientific Inc.
- Large scale and integrated supply chain offer resilience but require constant efficiency improvements.
Charles River Laboratories International, Inc.
- Smaller scale and dependence on specialized biological materials increase operational risks.
6. ESG & Climate Transition
Thermo Fisher Scientific Inc.
- Increasing ESG initiatives align with industry trends to reduce carbon footprint and enhance sustainability.
Charles River Laboratories International, Inc.
- ESG efforts less publicized, potentially lagging peers in climate transition and social governance.
7. Geopolitical Exposure
Thermo Fisher Scientific Inc.
- Global footprint exposes it to geopolitical risks but also diversifies regional dependencies.
Charles River Laboratories International, Inc.
- International presence is narrower, concentrating risks but potentially easier to manage.
Which company shows a better risk-adjusted profile?
Thermo Fisher faces significant competition and operational complexity, but its superior debt coverage, lower stock volatility, and safer Altman Z-score position it as the safer bet. Charles River grapples with high leverage risk and volatile stock price, raising caution. The key risk for Thermo Fisher is managing its valuation premium under market pressure. For Charles River, weak profitability and financial distress signals dominate. Thermo Fisher’s Altman Z-score in the safe zone (3.09) versus Charles River’s grey zone (2.60) confirms a stronger risk-adjusted standing in 2026.
Final Verdict: Which stock to choose?
Thermo Fisher Scientific Inc. (TMO) impresses with its superpower in operational efficiency and scale, consistently generating strong cash flows despite some margin pressures. Its point of vigilance lies in a declining economic moat, signaling caution for long-term value creation. TMO suits portfolios seeking steady growth with moderate risk tolerance.
Charles River Laboratories International, Inc. (CRL) offers a strategic moat anchored in specialized lab services, providing niche market exposure and potential for recurring revenue. However, it carries a weaker financial profile and more pronounced profitability challenges compared to TMO, fitting investors targeting higher-risk, early-stage growth opportunities.
If you prioritize operational resilience and scale, Thermo Fisher outshines with better stability and cash flow generation. However, if you seek niche exposure and can tolerate volatility, Charles River could offer superior upside potential amid a turnaround. Both scenarios require careful risk management given their respective challenges.
Disclaimer: Investment carries a risk of loss of initial capital. The past performance is not a reliable indicator of future results. Be sure to understand risks before making an investment decision.
Go Further
I encourage you to read the complete analyses of Thermo Fisher Scientific Inc. and Charles River Laboratories International, Inc. to enhance your investment decisions: