Home > Comparison > Healthcare > RVTY vs CRL
The strategic rivalry between Revvity, Inc. and Charles River Laboratories defines the trajectory of the global healthcare diagnostics and research sector. Revvity operates as a diversified provider of analytical instruments and diagnostic solutions, while Charles River specializes in non-clinical contract research and drug discovery services. This analysis examines their contrasting operational models to identify which company offers a superior risk-adjusted profile for a diversified portfolio seeking exposure to healthcare innovation.
Table of contents
Companies Overview
Revvity and Charles River Laboratories lead innovation in the medical diagnostics and research sector.
Revvity, Inc.: Precision Tools for Life Sciences Breakthroughs
Revvity dominates the diagnostics and life sciences research market with instruments, reagents, and software. Its core revenue stems from Discovery & Analytical Solutions and Diagnostics segments that serve pharmaceutical firms and public health organizations. In 2026, Revvity sharpened its focus on genomic workflows and early genetic disorder detection, reinforcing its competitive edge in advanced diagnostic technology.
Charles River Laboratories International, Inc.: Global Contract Research Powerhouse
Charles River specializes in non-clinical contract research services, providing drug discovery, safety testing, and manufacturing solutions worldwide. Its revenue comes from research models, safety assessment, and manufacturing services that support biopharma development pipelines. For 2026, the company emphasized expanding in vivo discovery and specialized biologics testing, strengthening its role in accelerating drug development.
Strategic Collision: Similarities & Divergences
Both companies operate in medical diagnostics and research but diverge in business philosophy: Revvity offers an integrated product-service ecosystem, while Charles River operates as a broad-service CRO. Their primary battleground is life sciences innovation, targeting pharmaceutical clients. Investors face distinct profiles—Revvity leans on product innovation and diagnostics, Charles River on service breadth and contract research scale.
Income Statement Comparison
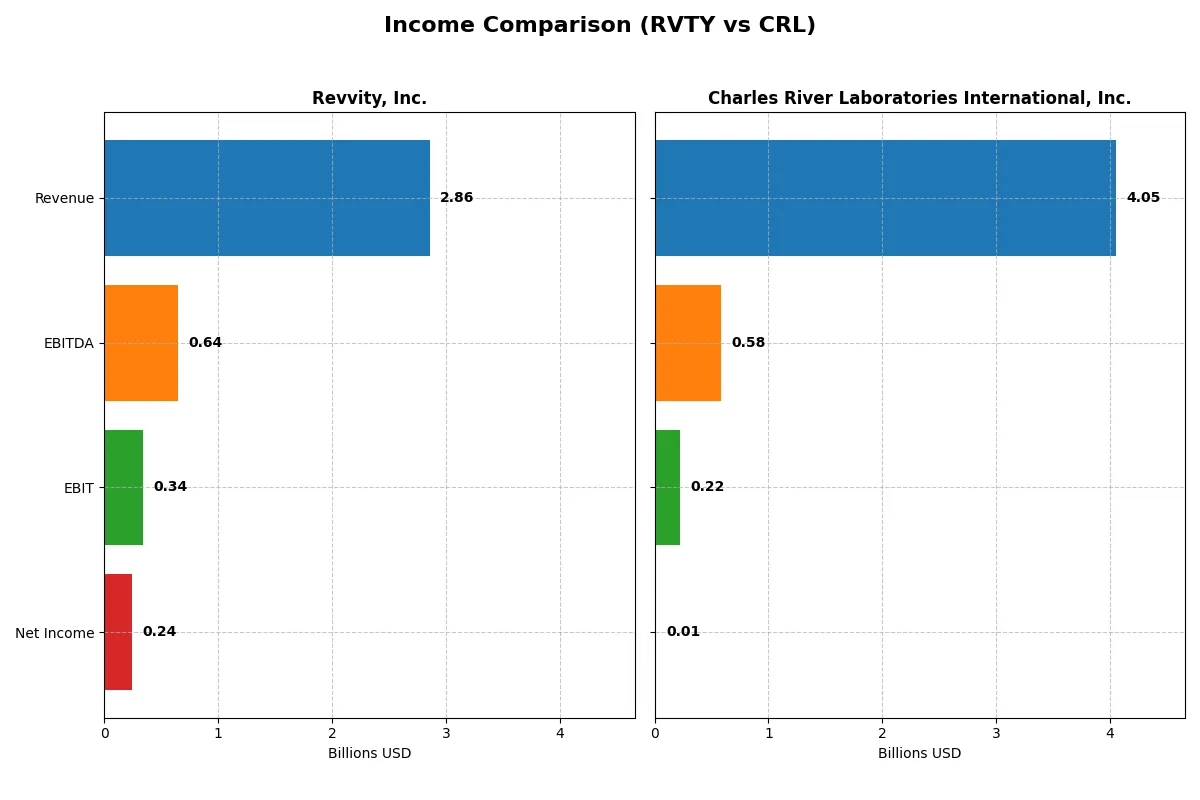
This data dissects the core profitability and scalability of both corporate engines to reveal who dominates the bottom line:
| Metric | Revvity, Inc. (RVTY) | Charles River Laboratories International, Inc. (CRL) |
|---|---|---|
| Revenue | 2.86B | 4.05B |
| Cost of Revenue | 1.34B | 2.72B |
| Operating Expenses | 1.16B | 1.10B |
| Gross Profit | 1.52B | 1.33B |
| EBITDA | 644M | 581M |
| EBIT | 341M | 219M |
| Interest Expense | 92M | 126M |
| Net Income | 242M | 10M |
| EPS | 2.08 | 0.20 |
| Fiscal Year | 2025 | 2024 |
Income Statement Analysis: The Bottom-Line Duel
This income statement comparison exposes the true efficiency and profitability dynamics of Revvity, Inc. and Charles River Laboratories International, Inc.
Revvity, Inc. Analysis
Revvity’s revenue shows a slight recovery to $2.86B in 2025 after a dip from $3.83B in 2021, with net income shrinking sharply to $242M. Its gross margin remains robust above 53%, but net margin declined to 8.46%, reflecting rising operating expenses. The firm’s profitability momentum weakens, with EBIT falling 17.2% year-over-year.
Charles River Laboratories International, Inc. Analysis
Charles River’s revenue slightly decreased to $4.05B in 2024 from $4.13B in 2023, while net income plunged dramatically to just $10M. Gross margin hovers near 33%, but net margin has collapsed to 0.25%. EBIT also tumbled 69.4% year-over-year, signaling significant efficiency deterioration and margin pressure.
Margin Strength vs. Earnings Collapse
Revvity maintains stronger margins and a more stable revenue base despite earnings decline, while Charles River suffers a severe earnings collapse despite higher revenue. Revvity’s profile shows more resilience and operational leverage. Investors seeking margin quality and relative stability might find Revvity’s profile more compelling.
Financial Ratios Comparison
These vital ratios act as a diagnostic tool to expose the underlying fiscal health, valuation premiums, and capital efficiency of the companies compared below:
| Ratios | Revvity, Inc. (RVTY) | Charles River Labs (CRL) |
|---|---|---|
| ROE | 3.33% | 0.30% |
| ROIC | 2.82% | 0.95% |
| P/E | 45.3x | 928.9x |
| P/B | 1.51x | 2.76x |
| Current Ratio | 1.68 | 1.41 |
| Quick Ratio | 1.40 | 1.13 |
| D/E (Debt-to-Equity) | 0.46 | 0.79 |
| Debt-to-Assets | 27.7% | 36.2% |
| Interest Coverage | 3.87x | 1.80x |
| Asset Turnover | 0.23 | 0.54 |
| Fixed Asset Turnover | 4.43 | 2.01 |
| Payout Ratio | 13.6% | 0% |
| Dividend Yield | 0.30% | 0% |
| Fiscal Year | 2025 | 2024 |
Efficiency & Valuation Duel: The Vital Signs
Financial ratios serve as the company’s DNA, exposing hidden risks and operational strengths that influence long-term investment prospects.
Revvity, Inc.
RVTY shows modest profitability with a 3.33% ROE and an 8.46% net margin, but its P/E of 45.32 signals an expensive valuation. The company maintains a solid current ratio of 1.68, indicating good liquidity. Shareholders receive a minimal 0.3% dividend yield, reflecting a reinvestment focus on R&D and growth.
Charles River Laboratories International, Inc.
CRL struggles with a 0.3% ROE and near breakeven net margin at 0.25%, reflecting operational challenges. Its P/E ratio is extremely stretched at 928.9, suggesting overvaluation risk. Liquidity ratios are moderate with a current ratio of 1.41. The company pays no dividends, likely prioritizing reinvestment over shareholder payouts.
Valuation Stretch vs. Operational Fragility
RVTY balances its high valuation with better profitability and liquidity, while CRL shows weaker returns and a dangerously high P/E. Investors seeking operational resilience may prefer RVTY’s profile, while those accepting higher valuation risk face CRL’s uncertain returns.
Which one offers the Superior Shareholder Reward?
I compare Revvity, Inc. (RVTY) and Charles River Laboratories International, Inc. (CRL) on their shareholder return strategies. RVTY pays a modest dividend yield near 0.3% with a sustainable payout ratio around 13.6%, supported by strong free cash flow coverage above 5x. RVTY also executes steady buybacks, enhancing total return. CRL pays no dividends, instead reinvesting all free cash flow into growth and acquisitions. Its free cash flow yield is higher, but capital allocation favors expansion over immediate shareholder return. RVTY’s balanced distribution with dividends plus buybacks offers more reliable and sustainable returns in 2026. I conclude RVTY provides superior total shareholder reward given its prudent payout and buyback intensity versus CRL’s all-in growth reinvestment.
Comparative Score Analysis: The Strategic Profile
The radar chart reveals the fundamental DNA and trade-offs of Revvity, Inc. and Charles River Laboratories International, Inc.:
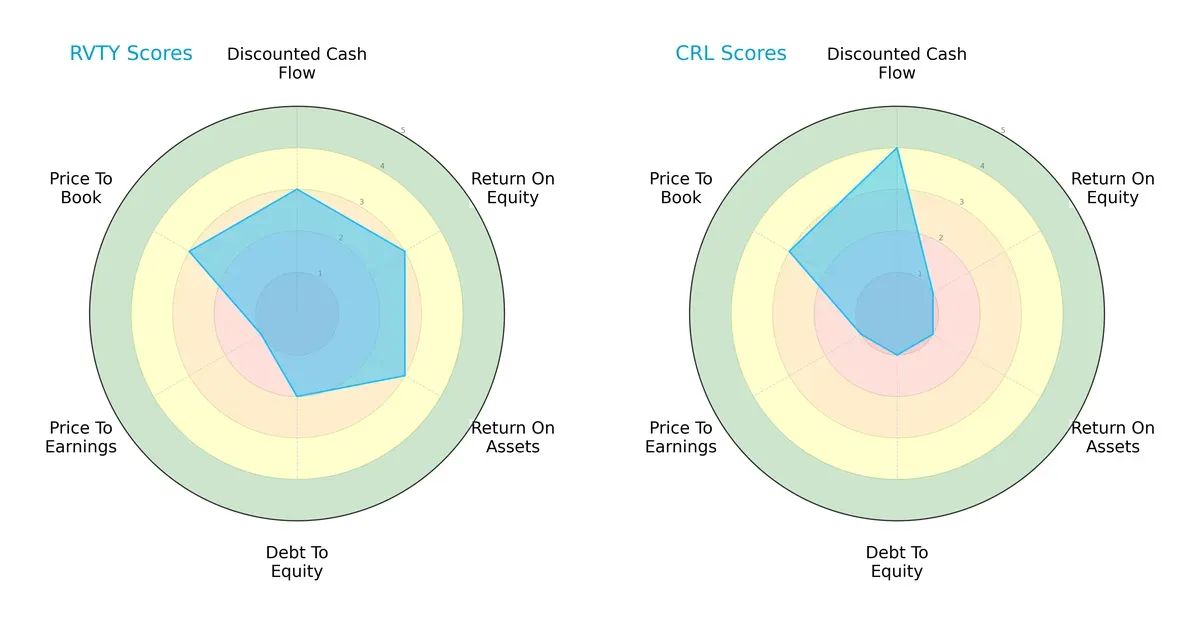
Revvity shows a balanced profile with moderate scores across DCF, ROE, and ROA, but its debt-to-equity and P/E scores flag risks. Charles River excels in discounted cash flow but suffers from weak profitability and leverage metrics. Revvity’s approach is steadier; Charles River relies heavily on cash flow strength.
Bankruptcy Risk: Solvency Showdown
Revvity and Charles River both sit in the Altman Z-Score grey zone, indicating moderate bankruptcy risk in this cycle:
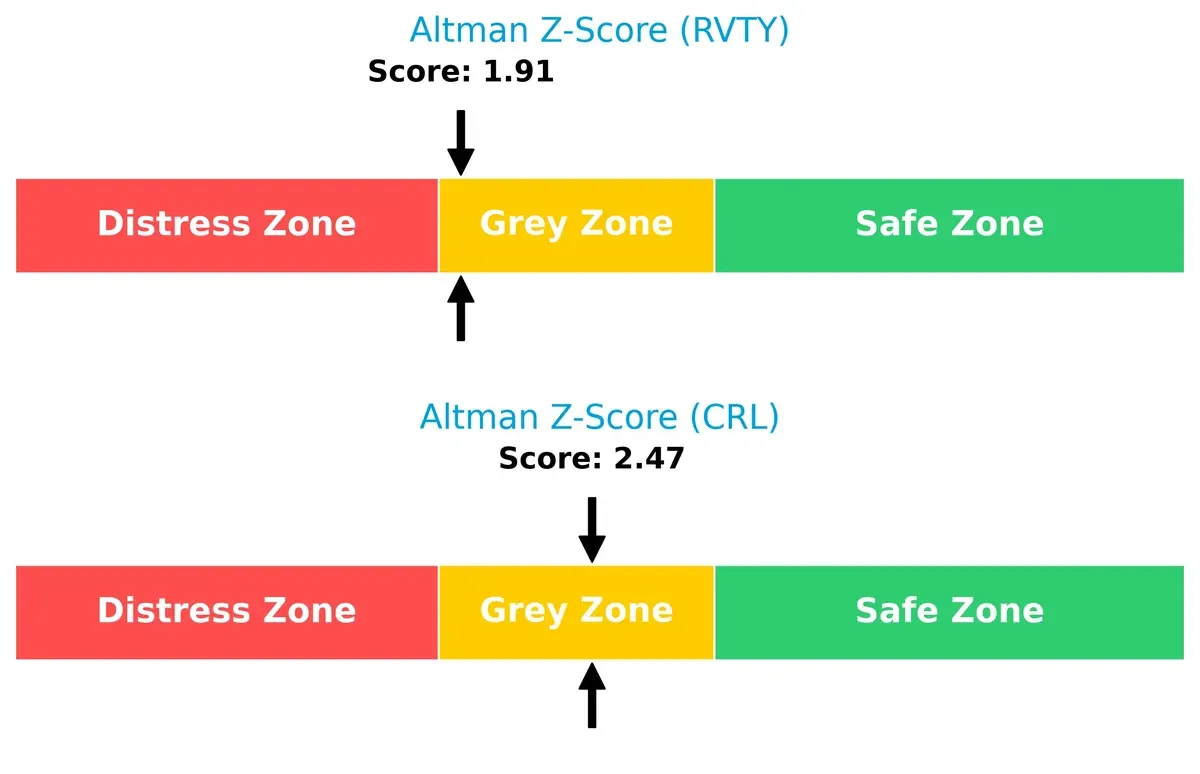
Revvity’s score is closer to distress, implying somewhat higher financial stress compared to Charles River, which maintains a marginally healthier solvency buffer.
Financial Health: Quality of Operations
Revvity posts a very strong Piotroski F-Score of 8, signaling robust financial health and operational quality, while Charles River’s average 5 score signals caution:
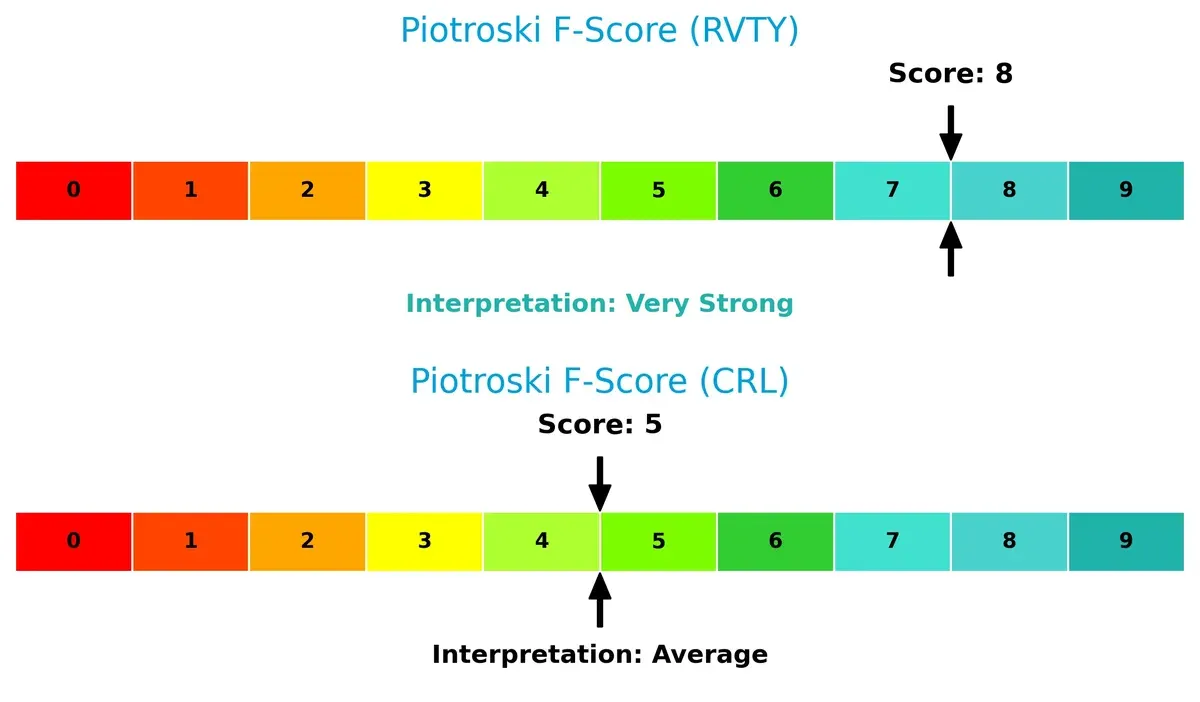
This gap warns that Charles River’s internal financial metrics may hide red flags, unlike Revvity’s clear operational strength and efficiency.
How are the two companies positioned?
This section dissects the operational DNA of Revvity and Charles River by comparing their revenue distribution by segment and internal dynamics, including strengths and weaknesses. The goal is to confront their economic moats to reveal which business model delivers the most resilient and sustainable competitive advantage in today’s market.
Revenue Segmentation: The Strategic Mix
This visual comparison dissects how Revvity, Inc. and Charles River Laboratories diversify their income streams and where their primary sector bets lie:
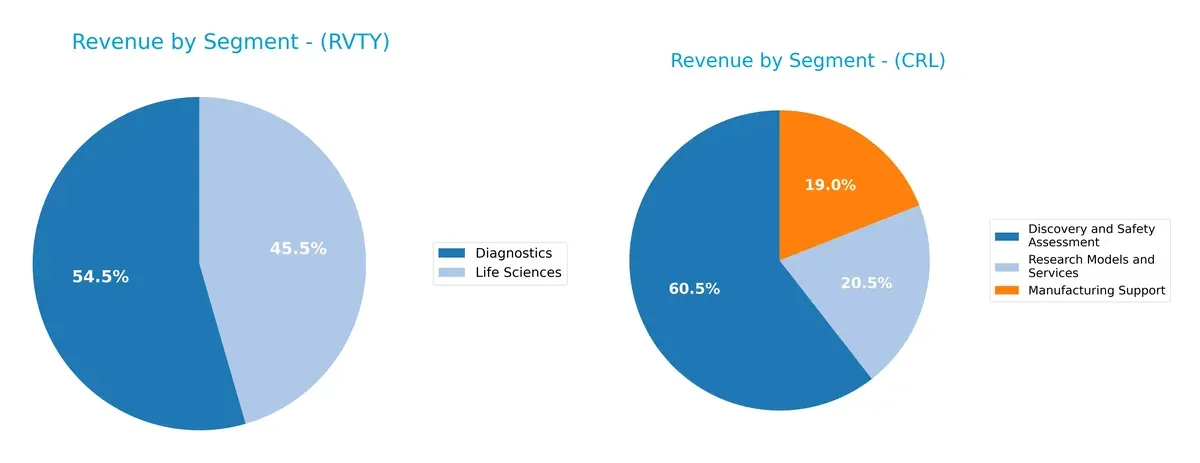
Revvity anchors its revenue roughly evenly between Diagnostics ($1.5B) and Life Sciences ($1.25B), signaling a balanced dual focus. Charles River dwarfs this with a more diversified mix across Discovery and Safety Assessment ($2.45B), Manufacturing Support ($770M), and Research Models and Services ($830M). While Revvity’s two-segment split suggests targeted expertise, Charles River’s broader base reduces concentration risk and strengthens ecosystem lock-in in drug development services.
Strengths and Weaknesses Comparison
This table compares the Strengths and Weaknesses of Revvity and Charles River Laboratories based on diversification, profitability, financials, innovation, global presence, and market share:
Revvity Strengths
- Balanced revenue from Diagnostics and Life Sciences
- Favorable current and quick ratios indicate solid liquidity
- Lower debt-to-assets ratio supports financial stability
- Higher fixed asset turnover suggests efficient asset use
- Significant international revenue diversification including China and UK
Charles River Strengths
- Diverse revenue streams across Discovery, Manufacturing, and Research Models
- Strong presence in US and Europe markets
- Quick ratio favorable, showing liquidity strength
- Moderate asset turnover indicates decent operational efficiency
- Consistent geographic revenue spread including Canada and Asia Pacific
Revvity Weaknesses
- Unfavorable ROE and ROIC below WACC indicate weak profitability and capital returns
- High P/E ratio signals possible overvaluation risk
- Net margin neutral but low compared to peers
- Dividend yield low at 0.3%
- Asset turnover quite low impacting revenue efficiency
Charles River Weaknesses
- Poor profitability metrics with very low net margin, ROE, and ROIC
- High P/E ratio far above sector norms indicates overvaluation concerns
- Interest coverage low, increasing financial risk
- Zero dividend yield may deter income-focused investors
- Debt levels relatively elevated compared to Revvity
Revvity shows stronger liquidity and asset efficiency, while Charles River maintains broader diversification and market reach. Both face profitability challenges and valuation concerns that require strategic attention.
The Moat Duel: Analyzing Competitive Defensibility
A structural moat is the only reliable shield protecting long-term profits from relentless competitive erosion. Let’s dissect the core moats of these two healthcare firms:
Revvity, Inc.: Intangible Assets with a Fragile Financial Edge
Revvity leverages proprietary diagnostics and life sciences solutions as its moat, reflected in stable gross margins above 53%. Yet, declining ROIC and net income over five years signal weakening capital efficiency, risking moat erosion if innovation stalls in 2026.
Charles River Laboratories International, Inc.: Scale and Service Breadth Under Pressure
Charles River’s moat stems from its integrated contract research services and global reach, especially in the U.S. Despite a 38% revenue growth over five years, it suffers severe profitability declines and negative ROIC trends, suggesting its scale advantage faces margin pressure and must pivot to new markets.
Market Reach vs. Innovation Depth: Who Defends Better?
Both firms exhibit deteriorating ROIC below WACC, a red flag for sustainable moats. Revvity’s intangible assets offer innovation potential but faltering returns. Charles River’s scale is broader but under margin assault. I see Revvity’s moat as potentially deeper if it reverses profitability decline, better positioning it to defend market share in 2026.
Which stock offers better returns?
The past year shows contrasting price dynamics: Revvity, Inc. endured a mild decline with accelerating downside, while Charles River Laboratories International, Inc. faced a steep drop but shows signs of recent recovery.
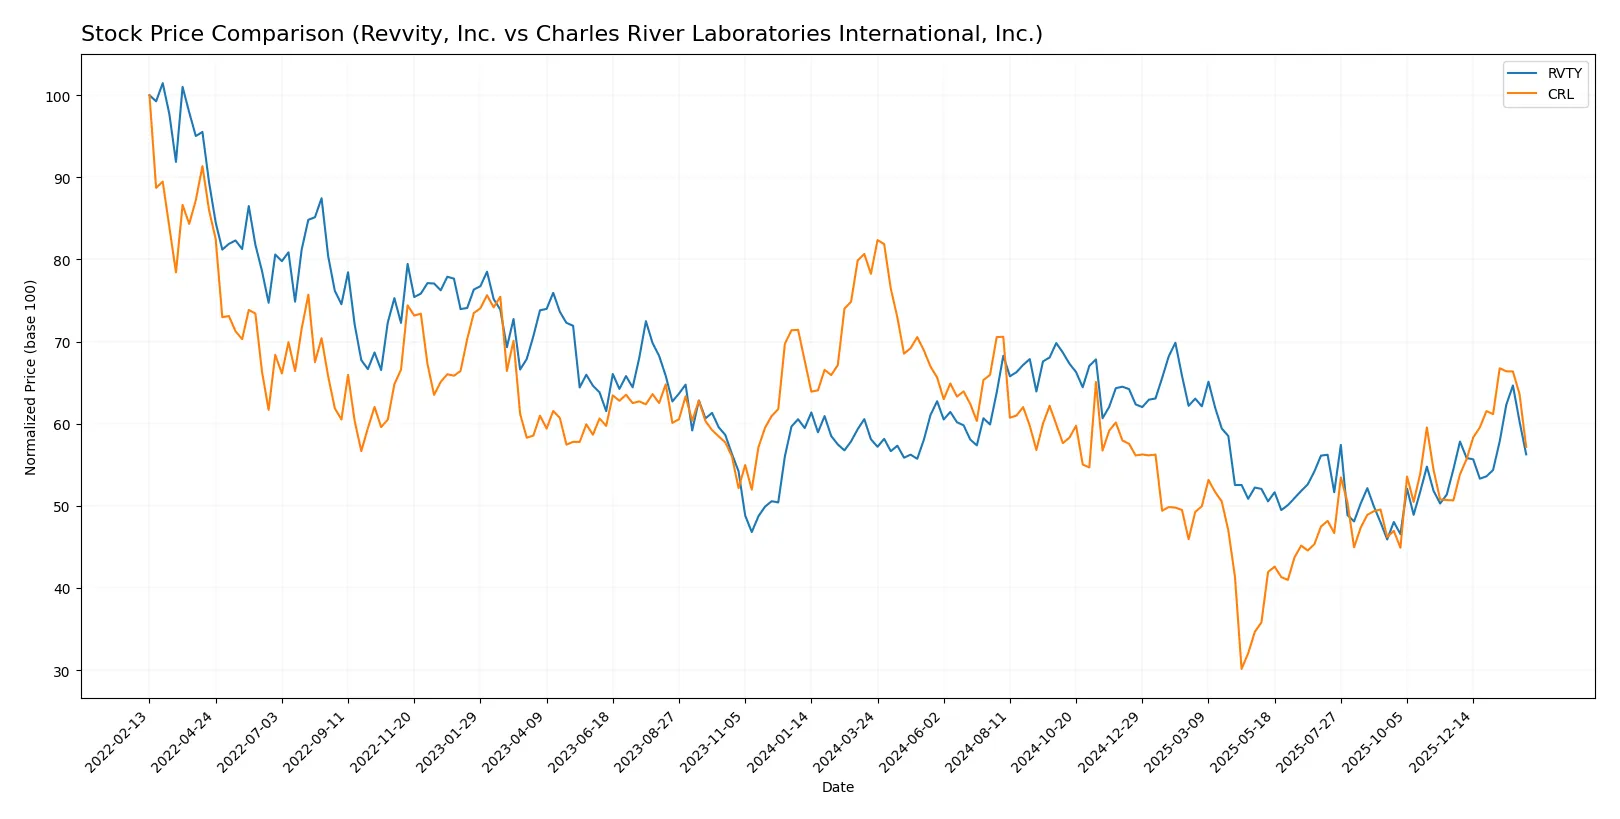
Trend Comparison
Revvity, Inc. (RVTY) posted a 12-month price decline of 3.16%, a bearish trend with accelerating loss. The stock fluctuated between $82.87 and $126.13, showing moderate volatility (11.37% std. dev.).
Charles River Laboratories (CRL) declined sharply by 26.94% over the same period, also bearish with accelerating downside. Volatility is notably higher at 33.67%, with prices ranging from $99.75 to $272.57.
While both stocks show bearish 12-month trends, Revvity’s smaller loss outperforms Charles River’s steep decline. Recent price gains suggest short-term recovery for both.
Target Prices
Analysts expect solid upside potential based on current consensus targets for these healthcare diagnostics leaders.
| Company | Target Low | Target High | Consensus |
|---|---|---|---|
| Revvity, Inc. | 105 | 129 | 115.14 |
| Charles River Laboratories International, Inc. | 185 | 260 | 214.43 |
Revvity’s consensus target sits roughly 13% above its $101.59 price, signaling moderate upside. Charles River’s target consensus exceeds its $189.21 price by about 13%, indicating similar growth expectations.

Don’t Let Luck Decide Your Entry Point
Optimize your entry points with our advanced ProRealTime indicators. You’ll get efficient buy signals with precise price targets for maximum performance. Start outperforming now!
How do institutions grade them?
The following tables present recent grades from established grading companies for both firms:
Revvity, Inc. Grades
This table summarizes Revvity, Inc.’s current ratings from reputable financial institutions.
| Grading Company | Action | New Grade | Date |
|---|---|---|---|
| Evercore ISI Group | maintain | Outperform | 2026-02-03 |
| Jefferies | maintain | Hold | 2026-02-03 |
| Wells Fargo | maintain | Equal Weight | 2026-02-03 |
| TD Cowen | maintain | Buy | 2026-02-03 |
| Barclays | maintain | Overweight | 2026-02-03 |
| JP Morgan | maintain | Neutral | 2026-02-03 |
| Wells Fargo | maintain | Equal Weight | 2025-12-15 |
| Barclays | maintain | Overweight | 2025-12-15 |
| Barclays | maintain | Overweight | 2025-10-28 |
| Baird | maintain | Outperform | 2025-10-28 |
Charles River Laboratories International, Inc. Grades
Below are the latest grades for Charles River Laboratories International, Inc. from leading analysts.
| Grading Company | Action | New Grade | Date |
|---|---|---|---|
| Citigroup | maintain | Buy | 2026-01-16 |
| Evercore ISI Group | maintain | Outperform | 2026-01-13 |
| Mizuho | maintain | Neutral | 2025-12-18 |
| JP Morgan | maintain | Neutral | 2025-12-15 |
| Barclays | maintain | Overweight | 2025-12-15 |
| Morgan Stanley | maintain | Equal Weight | 2025-11-11 |
| TD Cowen | maintain | Buy | 2025-11-10 |
| Baird | upgrade | Outperform | 2025-11-06 |
| JP Morgan | maintain | Neutral | 2025-11-06 |
| Barclays | maintain | Overweight | 2025-11-06 |
Which company has the best grades?
Both companies receive strong support from top firms, but Charles River Labs holds a slight edge with more Buy and Outperform ratings. This may signal higher analyst confidence and influence investor sentiment positively.
Risks specific to each company
The following categories identify critical pressure points and systemic threats facing both firms in the 2026 market environment:
1. Market & Competition
Revvity, Inc.
- Operates in diversified diagnostics and research markets with moderate pricing pressure.
Charles River Laboratories International, Inc.
- Faces intense competition in contract research and drug development services, impacting margin stability.
2. Capital Structure & Debt
Revvity, Inc.
- Maintains moderate leverage with a debt/equity ratio of 0.46, supporting financial flexibility.
Charles River Laboratories International, Inc.
- Higher leverage with debt/equity ratio of 0.79 raises concerns over financial risk and interest burden.
3. Stock Volatility
Revvity, Inc.
- Beta of 1.09 indicates moderate market sensitivity, aligned with healthcare sector trends.
Charles River Laboratories International, Inc.
- Elevated beta of 1.62 signals greater stock price volatility and investor risk exposure.
4. Regulatory & Legal
Revvity, Inc.
- Subject to evolving diagnostic regulations, but diversified product lines mitigate concentrated risk.
Charles River Laboratories International, Inc.
- Regulatory scrutiny in drug safety testing can lead to compliance costs and operational delays.
5. Supply Chain & Operations
Revvity, Inc.
- Benefits from stable supply chains across multiple industries, but sensitive to raw material costs.
Charles River Laboratories International, Inc.
- Operational complexity across global research models and manufacturing increases supply chain vulnerability.
6. ESG & Climate Transition
Revvity, Inc.
- ESG initiatives are progressing; however, transition risks in industrial markets demand ongoing investment.
Charles River Laboratories International, Inc.
- Faces pressure to improve sustainability in animal testing and manufacturing processes.
7. Geopolitical Exposure
Revvity, Inc.
- Primarily US-based with limited international exposure, reducing geopolitical risk.
Charles River Laboratories International, Inc.
- Broad global footprint increases exposure to geopolitical tensions and regulatory variability.
Which company shows a better risk-adjusted profile?
Revvity’s strongest risk is modest operational efficiency and pricing pressures in diagnostics. Charles River grapples with high leverage and stock volatility. I see Revvity as having a better risk-adjusted profile, supported by a more favorable debt structure and lower beta. Notably, Charles River’s P/E ratio exceeds 900, signaling market skepticism and valuation risk.
Final Verdict: Which stock to choose?
Revvity, Inc. showcases its superpower in operational efficiency and solid liquidity, standing out as a resilient cash generator. Its main point of vigilance lies in declining profitability and value destruction signals from ROIC trends. This stock aligns better with portfolios seeking aggressive growth but willing to tolerate risk.
Charles River Laboratories International, Inc. offers a strategic moat rooted in steady, recurring revenue streams and operational consistency. While it presents a more conservative safety profile than Revvity, it struggles with profitability and high leverage concerns. It fits portfolios focused on growth at a reasonable price, balancing risk with stability.
If you prioritize operational efficiency and aggressive expansion, Revvity outshines with stronger cash flow metrics despite profitability headwinds. However, if you seek better stability and a moat built on recurring revenues, Charles River offers a safer yet modest growth scenario. Both carry risks tied to declining returns on capital, so investor risk tolerance remains critical.
Disclaimer: Investment carries a risk of loss of initial capital. The past performance is not a reliable indicator of future results. Be sure to understand risks before making an investment decision.
Go Further
I encourage you to read the complete analyses of Revvity, Inc. and Charles River Laboratories International, Inc. to enhance your investment decisions: