Home > Comparison > Healthcare > MTD vs CRL
The strategic rivalry between Mettler-Toledo International Inc. and Charles River Laboratories International, Inc. shapes the healthcare diagnostics and research landscape. Mettler-Toledo operates as a precision instrument manufacturer with a diverse industrial and laboratory product portfolio. Conversely, Charles River serves as a contract research organization focusing on drug discovery and safety testing services. This analysis will identify which business model offers superior risk-adjusted returns for a diversified portfolio amid evolving sector dynamics.
Table of contents
Companies Overview
Mettler-Toledo International and Charles River Laboratories dominate specialized niches in medical diagnostics and research services.
Mettler-Toledo International Inc.: Precision Instruments Leader
Mettler-Toledo International excels as a manufacturer of precision instruments for healthcare and industrial markets. It generates revenue through sales of laboratory balances, analytical instruments, and industrial weighing systems. In 2026, the company emphasizes expanding its software-driven analytics platform, LabX, to enhance data integration and customer value.
Charles River Laboratories International, Inc.: Contract Research Powerhouse
Charles River Laboratories stands out as a non-clinical contract research organization supporting drug discovery and safety testing. Its revenue derives from research models, safety assessments, and pharmaceutical manufacturing solutions. The firm prioritizes broadening its early-stage drug discovery and toxicology services to meet increasing demand for outsourced development.
Strategic Collision: Similarities & Divergences
Both companies serve the healthcare sector but differ fundamentally in approach. Mettler-Toledo focuses on precision hardware combined with software ecosystems, while Charles River offers comprehensive research and testing services. Their competition unfolds primarily in the life sciences innovation pipeline. Investors face distinct profiles: Mettler-Toledo’s asset-heavy manufacturing contrasts with Charles River’s service-based model.
Income Statement Comparison
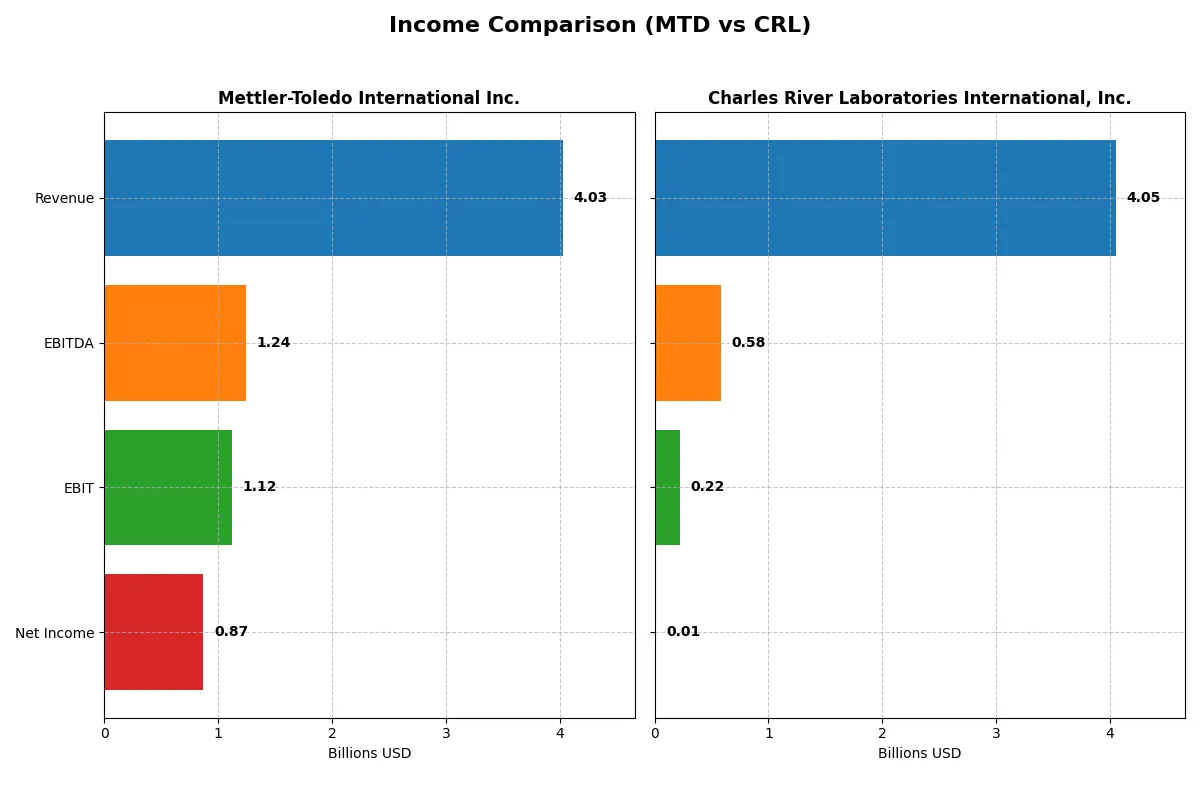
This data dissects the core profitability and scalability of both corporate engines to reveal who dominates the bottom line:
| Metric | Mettler-Toledo International Inc. (MTD) | Charles River Laboratories International, Inc. (CRL) |
|---|---|---|
| Revenue | 4.03B | 4.05B |
| Cost of Revenue | 1.71B | 2.72B |
| Operating Expenses | 1.20B | 1.10B |
| Gross Profit | 2.32B | 1.33B |
| EBITDA | 1.24B | 581M |
| EBIT | 1.12B | 219M |
| Interest Expense | 69M | 126M |
| Net Income | 869M | 10M |
| EPS | 42.17 | 0.20 |
| Fiscal Year | 2025 | 2024 |
Income Statement Analysis: The Bottom-Line Duel
This income statement comparison exposes the core efficiency and profitability of two distinct corporate engines in their latest fiscal years.
Mettler-Toledo International Inc. Analysis
Mettler-Toledo’s revenue steadily climbs, reaching $4.03B in 2025, while net income grows to $869M. The company sustains strong gross (57.5%) and net margins (21.6%), reflecting efficient cost control. Despite a slight dip in net margin growth, MTD’s operating momentum and EPS growth remain favorable, showcasing disciplined capital allocation.
Charles River Laboratories International, Inc. Analysis
Charles River’s revenue peaks at $4.05B in 2024 but dips slightly from prior years. Net income collapses to just $10M, crushing net margin to a meager 0.25%. The gross margin hovers at 32.9%, but the sharp net income decline and negative EBIT growth reveal significant operational challenges and deteriorating profitability.
Margin Strength vs. Revenue Scale
Mettler-Toledo outperforms Charles River decisively in profitability and margin sustainability. While both companies approach similar revenue levels, MTD’s superior margin management delivers robust net income and EPS growth. For investors, Mettler-Toledo’s profile offers a fundamentally stronger, more efficient engine for value creation compared to Charles River’s strained profit metrics.
Financial Ratios Comparison
These vital ratios act as a diagnostic tool to expose the underlying fiscal health, valuation premiums, and capital efficiency of the companies compared below:
| Ratios | Mettler-Toledo International Inc. (MTD) | Charles River Laboratories International, Inc. (CRL) |
|---|---|---|
| ROE | -36.77% (2025) | 0.30% (2024) |
| ROIC | 35.95% (2025) | 0.95% (2024) |
| P/E | 33.06 (2025) | 928.90 (2024) |
| P/B | -1215.71 (2025) | 2.76 (2024) |
| Current Ratio | 1.14 (2025) | 1.41 (2024) |
| Quick Ratio | 0.81 (2025) | 1.13 (2024) |
| D/E | -91.05 (2025) | 0.79 (2024) |
| Debt-to-Assets | 57.97% (2025) | 36.18% (2024) |
| Interest Coverage | 16.32 (2025) | 1.80 (2024) |
| Asset Turnover | 1.08 (2025) | 0.54 (2024) |
| Fixed Asset Turnover | 4.76 (2025) | 2.01 (2024) |
| Payout ratio | 0% (2025) | 0% (2024) |
| Dividend yield | 0% (2025) | 0% (2024) |
| Fiscal Year | 2025 | 2024 |
Efficiency & Valuation Duel: The Vital Signs
Ratios serve as a company’s DNA, revealing hidden risks and operational excellence behind headline numbers.
Mettler-Toledo International Inc.
Mettler-Toledo posts strong operational efficiency with a 21.6% net margin and a robust 36% ROIC, signaling excellent capital use. However, its -3677% ROE and a stretched P/E of 33 suggest valuation concerns. The firm does not pay dividends, instead reinvesting heavily in R&D to fuel growth and innovation.
Charles River Laboratories International, Inc.
Charles River shows weak profitability with a 0.25% net margin and sub-1% ROIC, reflecting operational struggles. Its P/E ratio is extremely high at 929, marking the stock as highly stretched. The company also offers no dividends, likely focusing resources on debt management and operational restructuring.
Operational Strength vs. Valuation Stretch
Mettler-Toledo delivers superior operational metrics but carries valuation risk, while Charles River’s financials raise caution amid extreme valuation multiples. Investors seeking operational resilience may prefer Mettler-Toledo; those with higher risk tolerance might consider Charles River’s turnaround potential.
Which one offers the Superior Shareholder Reward?
I observe both Mettler-Toledo International Inc. (MTD) and Charles River Laboratories International, Inc. (CRL) pay no dividends, focusing on reinvestment and buybacks. MTD boasts a robust free cash flow per share near $41 with no dividend payout, emphasizing strong buyback activity. CRL’s free cash flow per share is lower, around $9.7, yet it also refrains from dividends, reinvesting heavily in growth and acquisitions. MTD’s higher operating margins (~28%) and consistent buyback funding suggest a more sustainable shareholder reward. CRL’s lower margins (~5%) and weaker cash flow coverage raise concerns about distribution sustainability. I conclude MTD offers a superior total return potential in 2026 due to stronger cash flow generation and disciplined capital allocation.
Comparative Score Analysis: The Strategic Profile
The radar chart reveals the fundamental DNA and trade-offs of Mettler-Toledo International and Charles River Laboratories, highlighting strengths and weaknesses across key financial metrics:
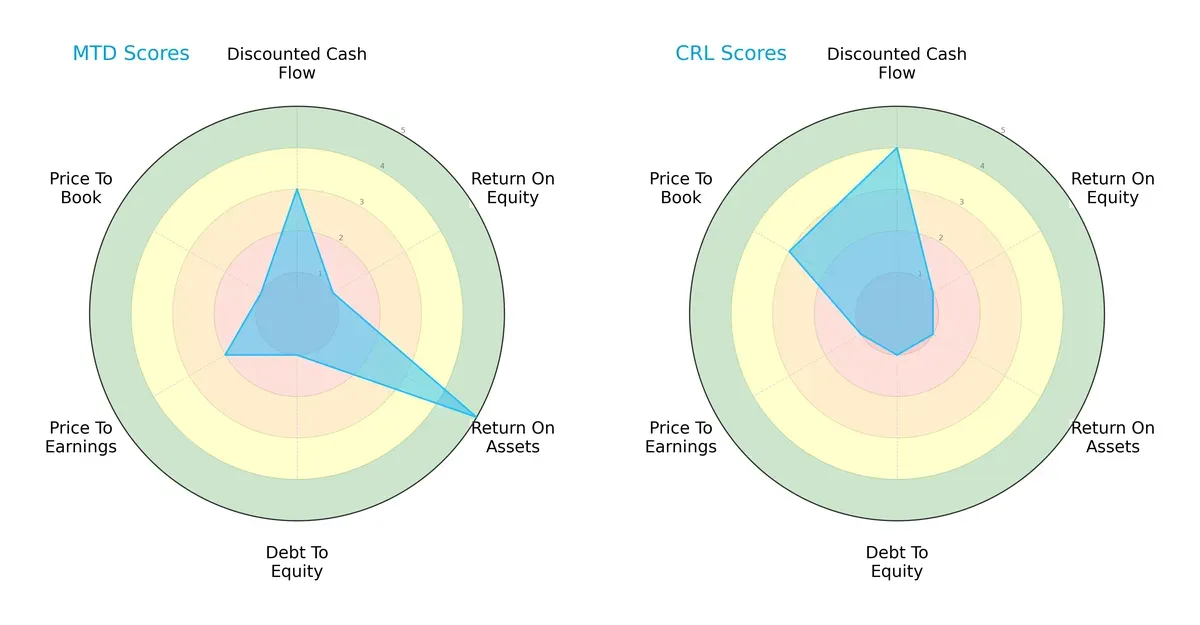
Mettler-Toledo shows a strong return on assets (score 5) but struggles with return on equity (score 1) and debt-to-equity (score 1), indicating operational efficiency but financial leverage risks. Charles River excels in discounted cash flow (score 4) yet shows weaker asset returns (score 1) and valuation metrics. Overall, Mettler-Toledo has a more balanced operational profile, while Charles River leans on cash flow advantages but faces valuation and efficiency challenges.
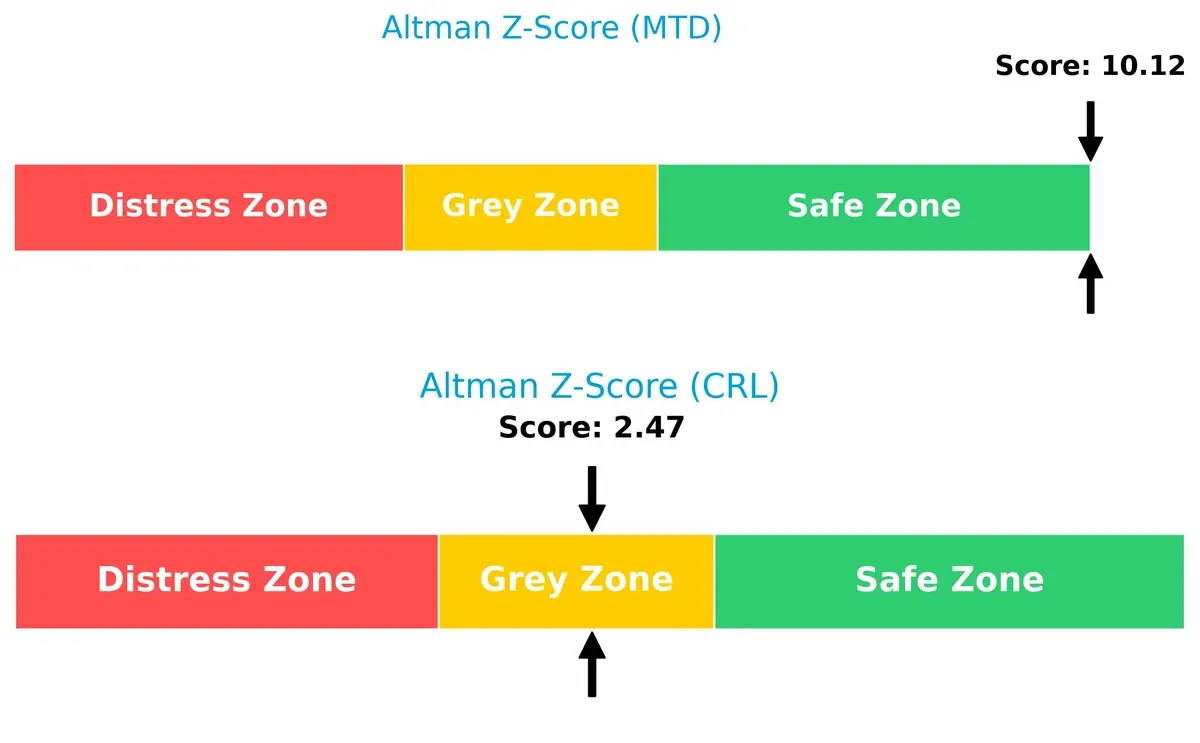
Bankruptcy Risk: Solvency Showdown
Mettler-Toledo’s Altman Z-Score of 10.1 places it well within the safe zone, signaling robust financial stability versus Charles River’s 2.5, which signals moderate bankruptcy risk in this cycle:
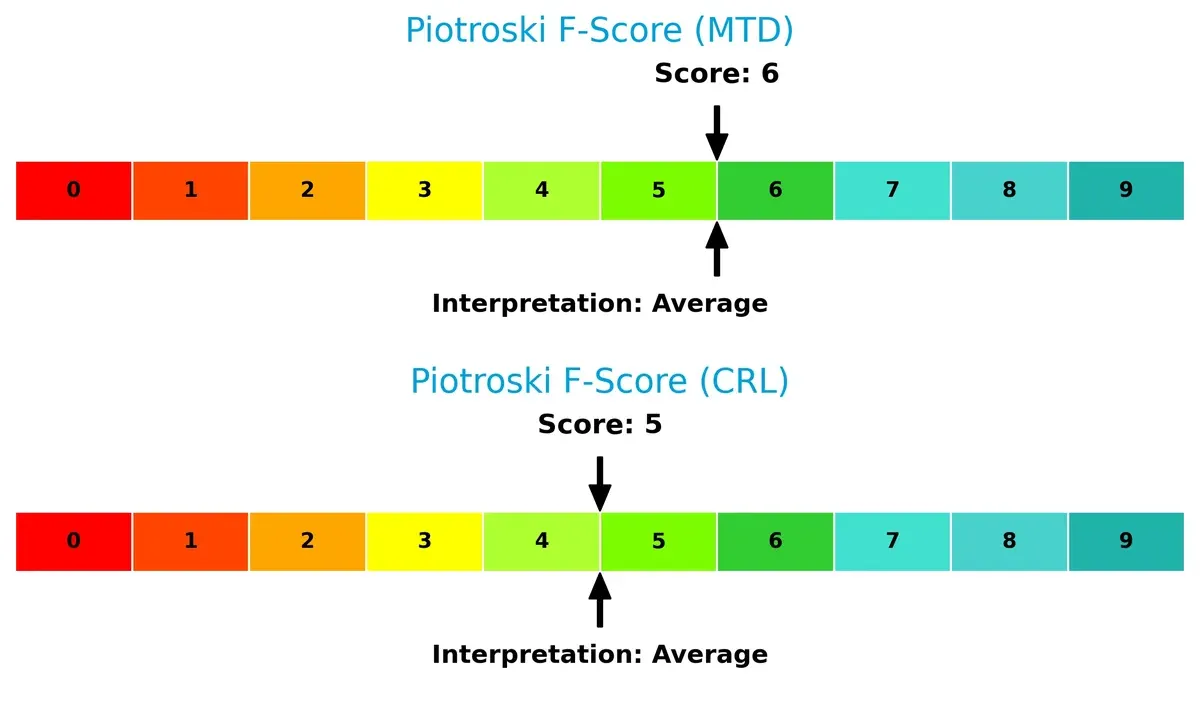
Financial Health: Quality of Operations
Mettler-Toledo and Charles River both score in the average range on Piotroski F-Score, with 6 and 5 respectively, indicating neither firm shows acute red flags but both have room to strengthen internal financial metrics:
How are the two companies positioned?
This section dissects the operational DNA of MTD and CRL by comparing their revenue distribution by segment and internal strengths and weaknesses. The goal is to confront their economic moats and reveal which business model offers the most resilient and sustainable competitive advantage today.
Revenue Segmentation: The Strategic Mix
This comparison dissects how Mettler-Toledo International Inc. and Charles River Laboratories diversify their income streams and where their primary sector bets lie:
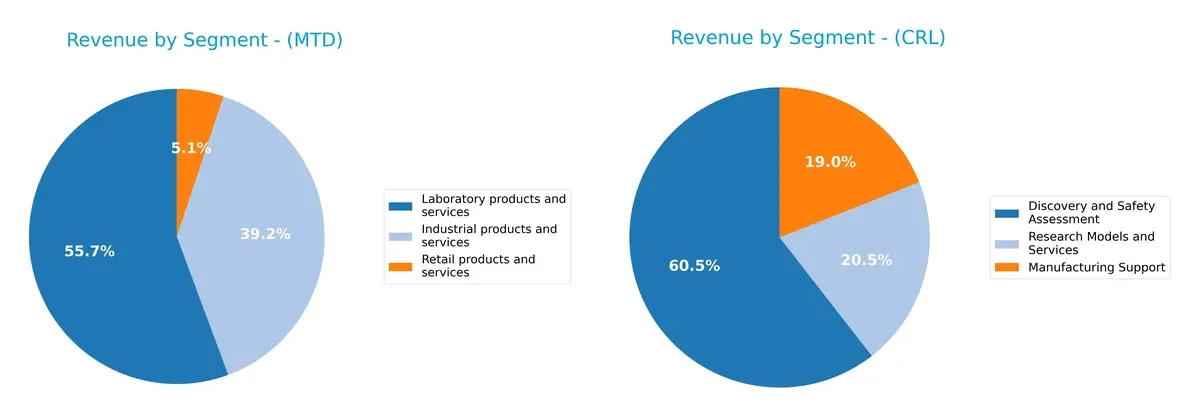
Mettler-Toledo anchors its revenue in two main segments: Laboratory products and services at $2.24B and Industrial products and services at $1.58B, showing a balanced mix with a smaller retail presence of $206M. Charles River leans heavily on Discovery and Safety Assessment, generating $2.45B, dwarfing its Manufacturing Support ($769M) and Research Models ($829M). Mettler-Toledo’s diversified portfolio reduces concentration risk, while Charles River’s focus strengthens its ecosystem lock-in but raises exposure to sector-specific cycles.
Strengths and Weaknesses Comparison
This table compares the Strengths and Weaknesses of Mettler-Toledo International Inc. (MTD) and Charles River Laboratories International, Inc. (CRL):
MTD Strengths
- Strong profitability with 21.59% net margin
- High ROIC at 35.95% indicating efficient capital use
- Favorable asset and fixed asset turnover ratios
- Diverse revenue streams across industrial, laboratory, and retail segments
CRL Strengths
- Broad product segmentation in discovery, manufacturing, and research services
- Favorable quick ratio showing good liquidity
- Neutral debt to assets ratio indicating moderate leverage
- Significant revenue from US and Europe markets
MTD Weaknesses
- Negative ROE at -3677.41% signals shareholder returns issues
- High debt to assets ratio at 57.97% raises financial risk
- Unfavorable PE and WACC ratios may limit valuation appeal
- Neutral current and quick ratios suggest liquidity caution
CRL Weaknesses
- Low profitability with 0.25% net margin and 0.3% ROE
- Unfavorable ROIC at 0.95% indicates poor capital efficiency
- High PE ratio of 928.9 questions valuation sustainability
- Low interest coverage ratio at 1.74 raises solvency concerns
MTD exhibits strong operational efficiency and profitability but faces financial structure risks. CRL shows broad diversification but struggles with profitability and capital returns, which may affect strategic financial decisions.
The Moat Duel: Analyzing Competitive Defensibility
A structural moat alone shields long-term profits from competitive erosion. It defines which companies can sustain value and which will falter:
Mettler-Toledo International Inc.: Precision Instrumentation with a Cost Advantage Moat
Mettler-Toledo dominates through cost advantages and specialized precision instruments. Its high ROIC at 26% versus WACC confirms strong value creation. New software integration deepens this moat in 2026.
Charles River Laboratories International, Inc.: Service Network with Fragile Profitability
Charles River relies on extensive service networks and research models but suffers a steep ROIC decline, signaling weak moat sustainability. Recent margin pressures threaten future competitiveness despite geographic scale.
Cost Leadership vs. Network Fragility
Mettler-Toledo’s widening moat outpaces Charles River’s shrinking economic returns. MTD’s consistent value creation and margin stability better defend market share against innovation and pricing pressures in 2026.
Which stock offers better returns?
Both Mettler-Toledo International Inc. and Charles River Laboratories International, Inc. experienced significant price shifts over the past year, reflecting distinct market dynamics and investor sentiment.
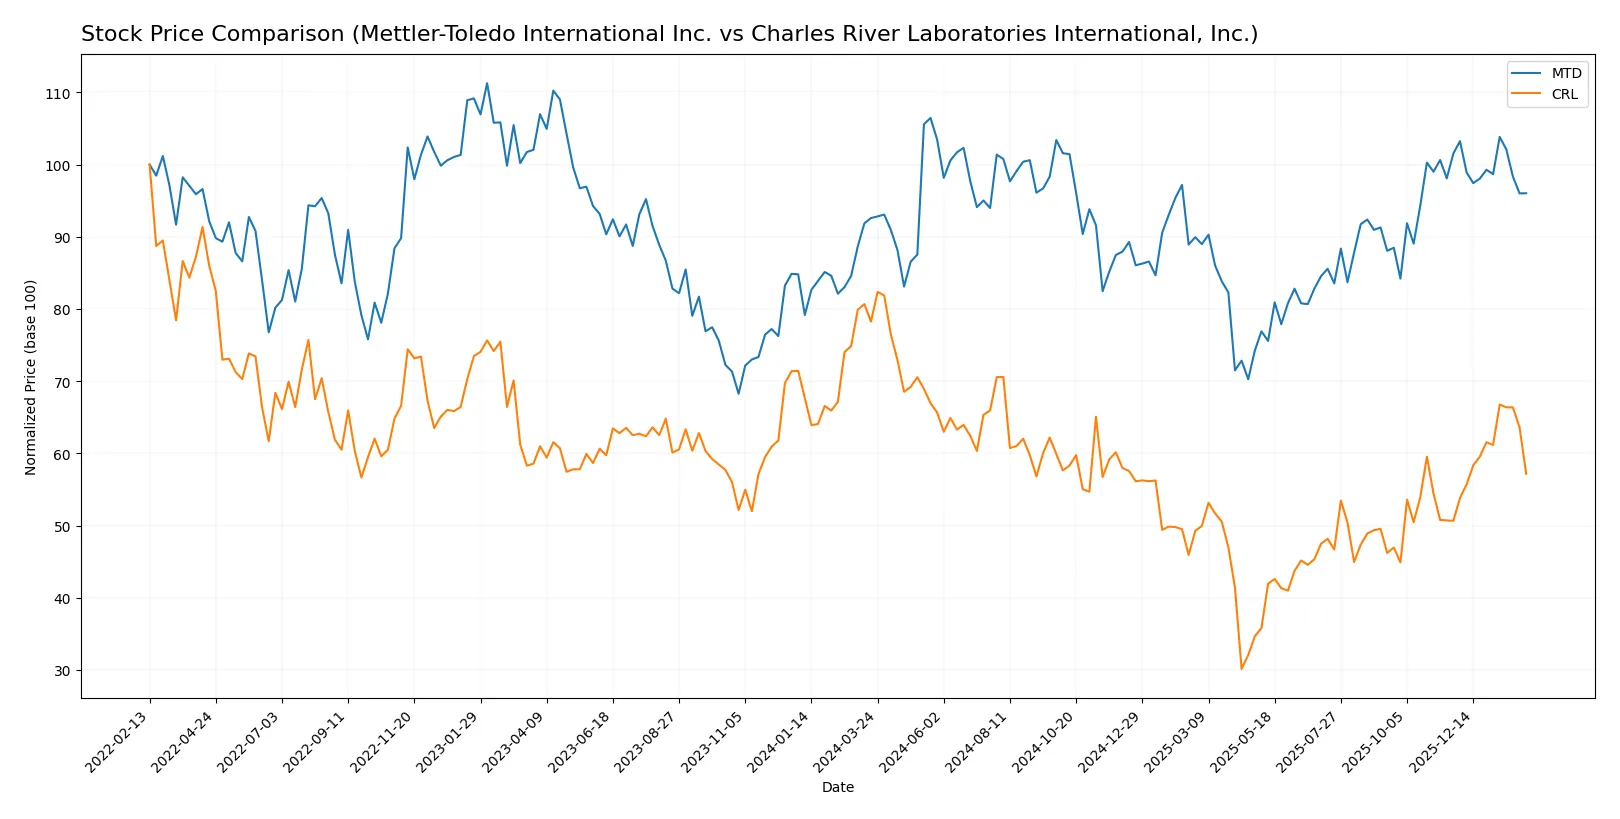
Trend Comparison
Mettler-Toledo’s stock shows a 3.71% gain over the past 12 months, signaling a bullish trend with decelerating momentum and a wide price range between 1004.96 and 1522.75.
Charles River Laboratories’ stock declined 26.94% over the same period, confirming a bearish trend with accelerating downward momentum, despite a recent price rebound.
Mettler-Toledo outperformed Charles River Labs, delivering positive returns while CRL faced steep losses despite recent recovery signs.
Target Prices
Analysts present a solid target price consensus for both Mettler-Toledo International and Charles River Laboratories.
| Company | Target Low | Target High | Consensus |
|---|---|---|---|
| Mettler-Toledo International Inc. | 1400 | 1600 | 1504.17 |
| Charles River Laboratories International, Inc. | 185 | 260 | 214.43 |
The target consensus for Mettler-Toledo exceeds its current price of 1373.57, indicating upside potential. Charles River Laboratories also shows a target consensus well above the current price of 189.21, suggesting bullish analyst sentiment.

Don’t Let Luck Decide Your Entry Point
Optimize your entry points with our advanced ProRealTime indicators. You’ll get efficient buy signals with precise price targets for maximum performance. Start outperforming now!
How do institutions grade them?
Mettler-Toledo International Inc. Grades
The following table shows recent grade actions from notable financial institutions for Mettler-Toledo:
| Grading Company | Action | New Grade | Date |
|---|---|---|---|
| Barclays | Maintain | Overweight | 2025-12-15 |
| Wells Fargo | Maintain | Equal Weight | 2025-12-15 |
| Citigroup | Maintain | Buy | 2025-11-10 |
| Wells Fargo | Maintain | Equal Weight | 2025-11-10 |
| Stifel | Maintain | Buy | 2025-11-10 |
| Barclays | Maintain | Overweight | 2025-11-10 |
| JP Morgan | Maintain | Neutral | 2025-10-09 |
| Evercore ISI Group | Maintain | Outperform | 2025-10-07 |
| Barclays | Maintain | Overweight | 2025-10-02 |
| B of A Securities | Maintain | Neutral | 2025-09-22 |
Charles River Laboratories International, Inc. Grades
Below are recent institutional grades for Charles River Laboratories:
| Grading Company | Action | New Grade | Date |
|---|---|---|---|
| Citigroup | Maintain | Buy | 2026-01-16 |
| Evercore ISI Group | Maintain | Outperform | 2026-01-13 |
| Mizuho | Maintain | Neutral | 2025-12-18 |
| JP Morgan | Maintain | Neutral | 2025-12-15 |
| Barclays | Maintain | Overweight | 2025-12-15 |
| Morgan Stanley | Maintain | Equal Weight | 2025-11-11 |
| TD Cowen | Maintain | Buy | 2025-11-10 |
| Baird | Upgrade | Outperform | 2025-11-06 |
| JP Morgan | Maintain | Neutral | 2025-11-06 |
| Barclays | Maintain | Overweight | 2025-11-06 |
Which company has the best grades?
Both companies maintain predominantly positive grades, but Charles River has a slightly stronger mix of upgrades and Outperform ratings. This could indicate better near-term analyst confidence, potentially attracting more investor interest.
Risks specific to each company
The following categories identify critical pressure points and systemic threats facing Mettler-Toledo International Inc. and Charles River Laboratories International, Inc. in the 2026 market environment:
1. Market & Competition
Mettler-Toledo International Inc.
- Strong market position in precision instruments; faces competition in diagnostics innovation.
Charles River Laboratories International, Inc.
- Intense competition in contract research and drug discovery services; pricing pressure evident.
2. Capital Structure & Debt
Mettler-Toledo International Inc.
- High debt-to-assets ratio at 58%, signaling leverage risk despite strong interest coverage.
Charles River Laboratories International, Inc.
- Moderate leverage with 36% debt-to-assets; interest coverage low at 1.74, raising refinancing concerns.
3. Stock Volatility
Mettler-Toledo International Inc.
- Beta of 1.44 indicates above-average volatility; stock range wide but stable trading volume.
Charles River Laboratories International, Inc.
- Higher beta of 1.62 shows greater sensitivity to market swings; volume above average signals active trading.
4. Regulatory & Legal
Mettler-Toledo International Inc.
- Operates in regulated healthcare sectors; compliance costs may rise with evolving standards.
Charles River Laboratories International, Inc.
- Faces regulatory scrutiny typical of CROs; increased oversight on animal testing and safety protocols.
5. Supply Chain & Operations
Mettler-Toledo International Inc.
- Diverse global operations exposed to supply chain disruptions but benefits from vertical integration.
Charles River Laboratories International, Inc.
- Complex supply chain for research models and testing services vulnerable to geopolitical and logistic risks.
6. ESG & Climate Transition
Mettler-Toledo International Inc.
- Moderate ESG risk; transition to sustainable operations underway but scope for improvement remains.
Charles River Laboratories International, Inc.
- ESG pressures rising, especially on animal welfare and environmental footprint in lab operations.
7. Geopolitical Exposure
Mettler-Toledo International Inc.
- Exposure to international markets including China and Europe; geopolitical tensions may impact growth.
Charles River Laboratories International, Inc.
- Global footprint exposes firm to trade policies and geopolitical instability affecting research collaborations.
Which company shows a better risk-adjusted profile?
Mettler-Toledo faces its greatest risk in high leverage despite strong operational metrics. Charles River’s main vulnerability lies in weak profitability and fragile interest coverage. Mettler-Toledo’s Altman Z-Score of 10.1 signals robust financial health versus Charles River’s grey zone score of 2.5. This disparity, combined with Mettler-Toledo’s stronger operational efficiency, reveals a superior risk-adjusted profile. Recent data highlight Mettler-Toledo’s efficient asset turnover (4.76) as a key advantage amid debt concerns.
Final Verdict: Which stock to choose?
Mettler-Toledo International Inc. wields a formidable superpower in its ability to generate exceptional returns on invested capital, signaling robust value creation and operational excellence. Its main point of vigilance lies in its elevated debt-to-assets ratio, which could pressure financial flexibility. This stock suits investors with an appetite for aggressive growth and innovation leadership.
Charles River Laboratories International, Inc. benefits from a strategic moat rooted in its steady recurring revenue streams and solid liquidity profile. It presents a comparatively safer balance sheet, though its declining profitability demands caution. CRL fits well within a Growth at a Reasonable Price (GARP) portfolio seeking stability amid industry challenges.
If you prioritize sustained value creation and superior capital efficiency, Mettler-Toledo outshines with its proven competitive advantage and growth trajectory. However, if you seek a more conservative investment with moderate growth and better liquidity, Charles River offers better stability despite its profitability headwinds. Each appeals to distinct investor profiles navigating differing risk tolerances.
Disclaimer: Investment carries a risk of loss of initial capital. The past performance is not a reliable indicator of future results. Be sure to understand risks before making an investment decision.
Go Further
I encourage you to read the complete analyses of Mettler-Toledo International Inc. and Charles River Laboratories International, Inc. to enhance your investment decisions: