Home > Comparison > Healthcare > DHR vs CRL
The strategic rivalry between Danaher Corporation and Charles River Laboratories defines the current trajectory of the healthcare diagnostics and research sector. Danaher operates as a diversified industrial powerhouse with a broad product portfolio, while Charles River focuses on specialized contract research services. This head-to-head pits Danaher’s integrated manufacturing scale against Charles River’s niche scientific expertise. This analysis aims to identify which growth strategy delivers superior risk-adjusted returns for a diversified portfolio.

Table of contents
Companies Overview
Danaher Corporation and Charles River Laboratories both command significant roles in the medical diagnostics and research sector, shaping innovation and service delivery.
Danaher Corporation: Diversified Leader in Life Sciences and Diagnostics
Danaher Corporation dominates with a diversified portfolio spanning Life Sciences, Diagnostics, and Environmental Solutions. Its core revenue comes from advanced instruments and consumables used by pharmaceutical, medical, and industrial clients. In 2026, Danaher focuses on expanding bioprocess technologies and automation, reinforcing its competitive edge in integrated laboratory solutions.
Charles River Laboratories International, Inc.: Specialist in Non-Clinical Research Services
Charles River Laboratories excels as a contract research organization, generating revenue by providing drug discovery, safety testing, and manufacturing support. Its 2026 strategy targets growth in genetically engineered models and specialized biologics testing, reinforcing its role in accelerating pharmaceutical development and regulatory compliance.
Strategic Collision: Similarities & Divergences
Both companies operate within healthcare’s research and diagnostics space but diverge in approach. Danaher pursues a broad product and technology ecosystem, while Charles River emphasizes service specialization in preclinical research. Their primary battleground lies in supporting pharmaceutical innovation with complementary tools versus outsourced R&D services. Investor appeal differs: Danaher offers scale and integration, Charles River delivers niche expertise and clinical focus.
Income Statement Comparison
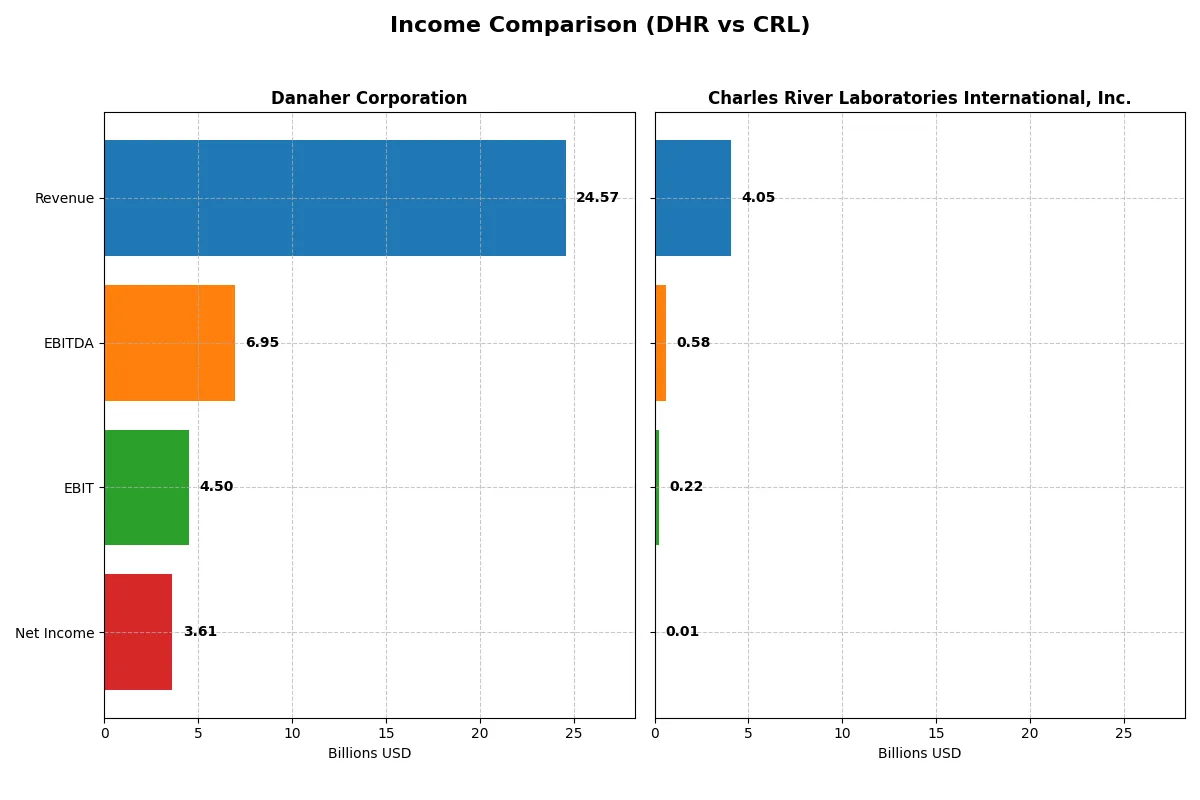
This data dissects the core profitability and scalability of both corporate engines to reveal who dominates the bottom line:
| Metric | Danaher Corporation (DHR) | Charles River Laboratories (CRL) |
|---|---|---|
| Revenue | 24.57B | 4.05B |
| Cost of Revenue | 9.60B | 2.72B |
| Operating Expenses | 9.83B | 1.10B |
| Gross Profit | 14.97B | 1.33B |
| EBITDA | 6.95B | 581M |
| EBIT | 4.50B | 219M |
| Interest Expense | 265M | 126M |
| Net Income | 3.61B | 10M |
| EPS | 5.07 | 0.20 |
| Fiscal Year | 2025 | 2024 |
Income Statement Analysis: The Bottom-Line Duel
This income statement comparison reveals each company’s operational efficiency and profitability over recent years.
Danaher Corporation Analysis
Danaher’s revenue declined from 29.5B in 2021 to 24.6B in 2025, with net income dropping sharply from 6.3B to 3.6B. Its gross margin remains robust at 60.9%, and net margin at 14.7%, reflecting strong cost control despite falling top-line momentum. The 2025 year shows deteriorating EBIT and net income growth, signaling pressure on profitability.
Charles River Laboratories Analysis
Charles River’s revenue grew overall from 2.9B in 2020 to 4.0B in 2024 but slipped slightly in the last year. Net income collapsed from 486M in 2022 to just 10M in 2024, dragging net margin to a thin 0.25%. Its gross margin at 32.9% is stable but far lower than Danaher’s, and EBIT margin is modest at 5.4%. The recent sharp earnings decline highlights significant operational challenges.
Margin Strength vs. Earnings Stability
Danaher outperforms Charles River in margin quality and scale, maintaining a strong gross and net margin despite revenue shrinkage. Charles River shows revenue expansion but suffers a drastic earnings collapse and razor-thin profitability. Danaher’s profile suggests better operational leverage and cost management, making it more attractive for investors prioritizing stable earnings and margin resilience.
Financial Ratios Comparison
These vital ratios act as a diagnostic tool to expose the underlying fiscal health, valuation premiums, and capital efficiency of each company:
| Ratios | Danaher Corporation (DHR) | Charles River Laboratories (CRL) |
|---|---|---|
| ROE | 6.9% | 0.3% |
| ROIC | 5.7% | 0.9% |
| P/E | 44.8 | 928.9 |
| P/B | 3.08 | 2.76 |
| Current Ratio | 1.87 | 1.41 |
| Quick Ratio | 1.51 | 1.13 |
| D/E | 0.35 | 0.79 |
| Debt-to-Assets | 22.1% | 36.2% |
| Interest Coverage | 19.4 | 1.8 |
| Asset Turnover | 0.29 | 0.54 |
| Fixed Asset Turnover | 4.44 | 2.01 |
| Payout Ratio | 24.3% | 0% |
| Dividend Yield | 0.54% | 0% |
| Fiscal Year | 2025 | 2024 |
Efficiency & Valuation Duel: The Vital Signs
Financial ratios act as a company’s DNA, uncovering hidden risks and operational strengths that shape investor decisions.
Danaher Corporation
Danaher delivers a solid net margin of 14.7% but a modest 6.9% ROE, signaling moderate profitability. Its P/E ratio at 44.8 marks the stock as expensive compared to benchmarks. Danaher maintains a prudent dividend yield of 0.54%, reflecting shareholder returns alongside a strong focus on research and development to fuel growth.
Charles River Laboratories International, Inc.
Charles River struggles with profitability, posting a net margin of 0.25% and a minimal 0.3% ROE. The stock appears severely stretched with a P/E ratio near 929, indicating high valuation risk. The company offers no dividends, instead reinvesting to support operational improvements, though its overall financial health remains fragile.
Premium Valuation vs. Operational Safety
Danaher balances premium valuation with operational safety, showing more favorable ratios and steady shareholder returns. Charles River’s stretched valuation and weak profitability suggest higher risk. Danaher suits investors seeking stability and growth, while Charles River fits those willing to endure volatility for potential turnaround gains.
Which one offers the Superior Shareholder Reward?
I observe Danaher Corporation (DHR) pays a modest dividend yield near 0.54% with a prudent payout ratio around 24%. Its free cash flow coverage exceeds 3x, supporting dividend sustainability. Danaher also executes steady buybacks, enhancing total returns. Charles River Laboratories (CRL) offers no dividend but reinvests heavily in growth, reflected by a free cash flow yield around 5%, yet weaker free cash flow coverage below 1x and higher leverage. CRL’s buybacks are minimal, limiting direct shareholder distributions. I conclude Danaher’s balanced dividend and buyback approach delivers a more sustainable, attractive total shareholder return in 2026.
Comparative Score Analysis: The Strategic Profile
The radar chart reveals the fundamental DNA and trade-offs of Danaher Corporation and Charles River Laboratories International, Inc.:
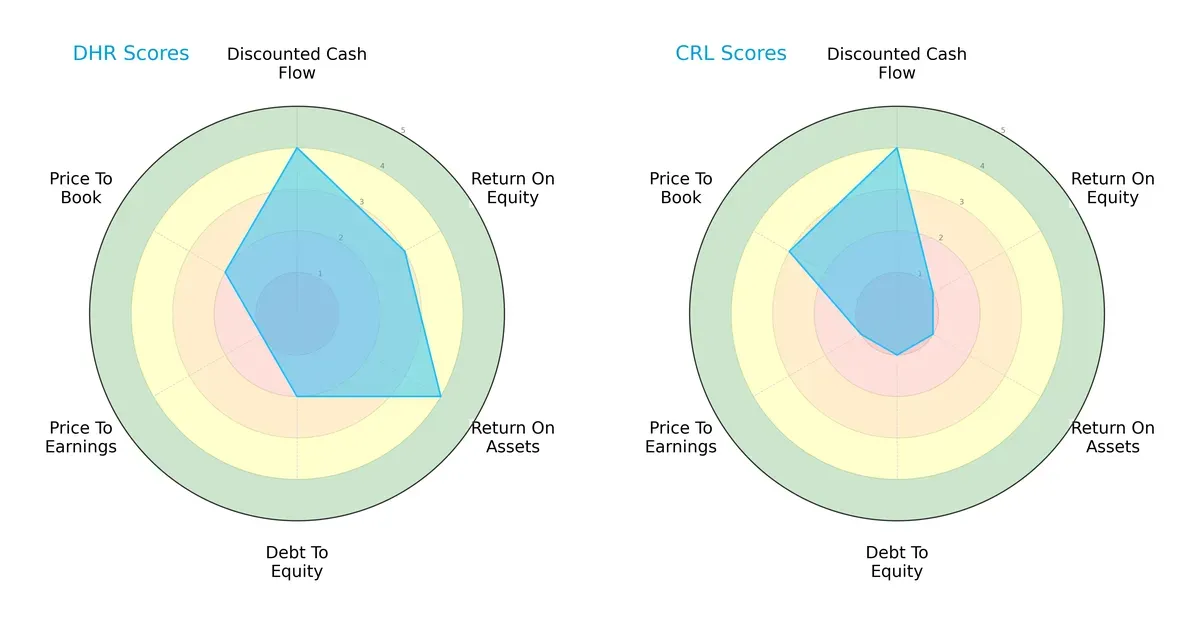
Danaher shows a more balanced profile with strong DCF (4), ROA (4), and moderate ROE (3) scores, while Charles River relies heavily on DCF (4) but scores very low in ROE (1), ROA (1), and debt-to-equity (1). Danaher’s moderate debt management contrasts with Charles River’s weaker financial stability. Valuation metrics favor Charles River slightly on price-to-book (3 vs. 2), but Danaher’s overall operational efficiency and financial strength dominate.
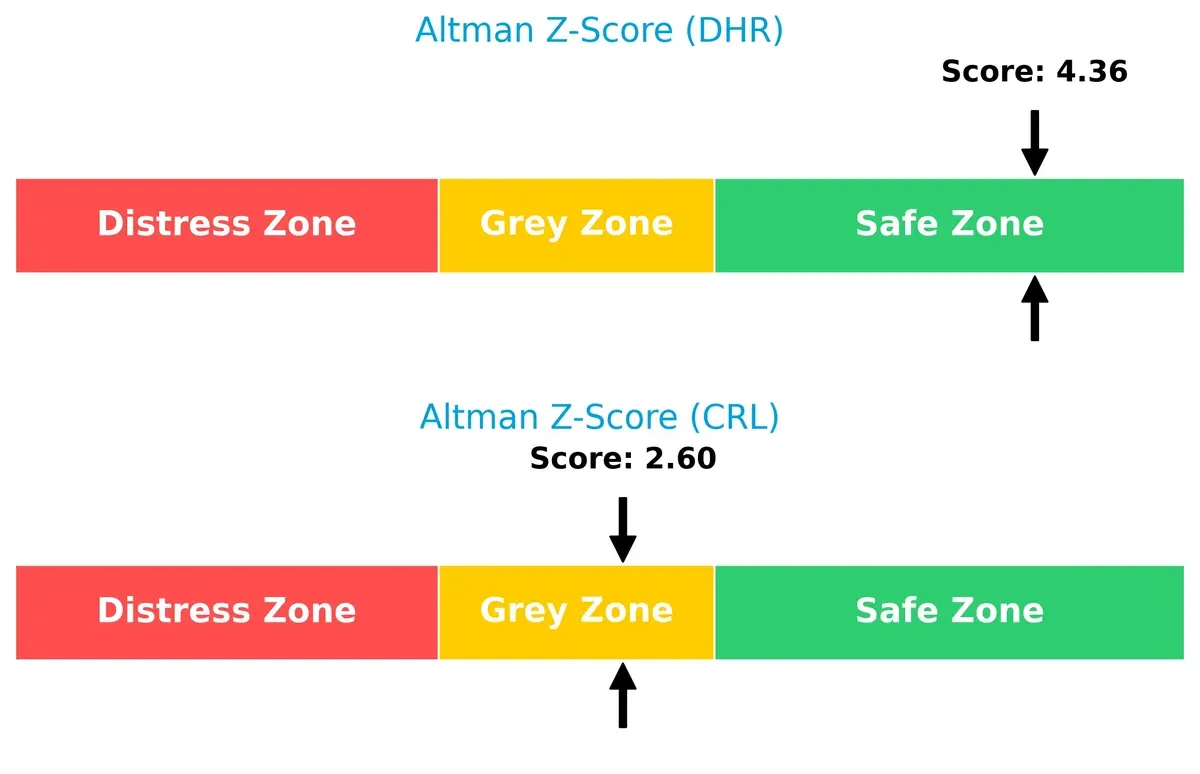
Bankruptcy Risk: Solvency Showdown
Danaher’s Altman Z-Score of 4.36 places it firmly in the safe zone, signaling robust long-term survival prospects. Charles River’s 2.60 score falls into the grey zone, implying moderate bankruptcy risk under current economic conditions:
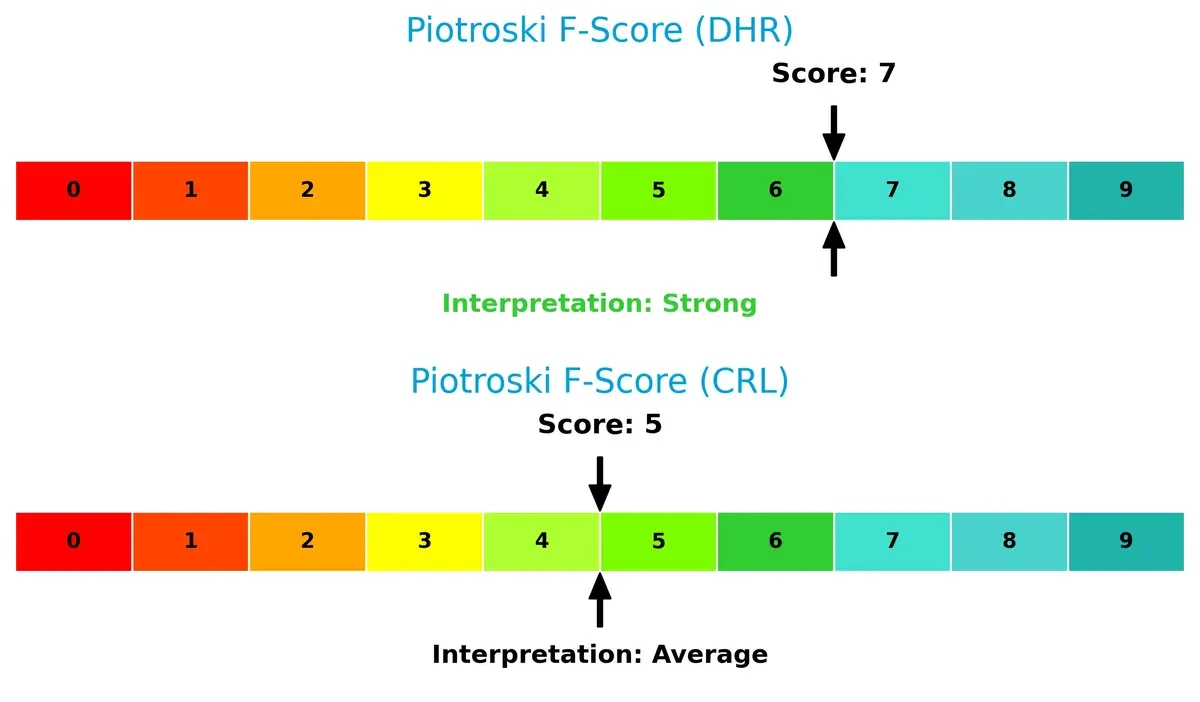
Financial Health: Quality of Operations
Danaher’s Piotroski F-Score of 7 indicates strong financial health and operational quality. Charles River’s score of 5 is average, signaling potential red flags in internal metrics when compared directly:
How are the two companies positioned?
This section dissects Danaher and Charles River’s operational DNA by comparing their revenue distribution and internal dynamics. The goal is to confront their economic moats and reveal which model delivers the most resilient competitive advantage today.
Revenue Segmentation: The Strategic Mix
This visual comparison dissects how Danaher Corporation and Charles River Laboratories diversify their income streams and reveals where their primary sector bets lie:
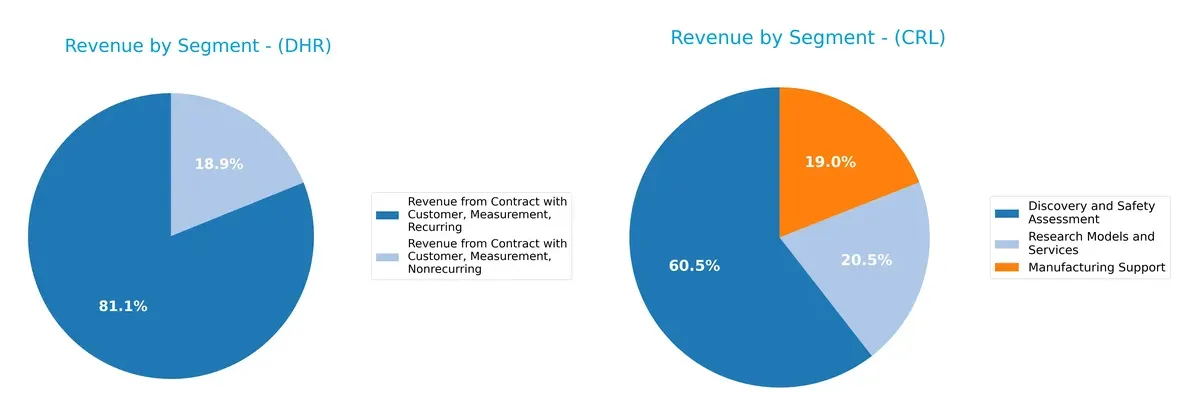
Danaher’s revenue anchors heavily on Measurement Recurring at $19.4B (2024), dwarfing its Nonrecurring segment at $4.5B. This concentration suggests a strong ecosystem lock-in through subscription-like contracts. Charles River Laboratories shows a more balanced mix: Discovery and Safety Assessment leads at $2.45B, but Manufacturing Support ($770M) and Research Models ($830M) also contribute significantly, reducing concentration risk. Danaher pivots on infrastructure dominance; CRL embraces diversified service streams.
Strengths and Weaknesses Comparison
This table compares the Strengths and Weaknesses of Danaher Corporation and Charles River Laboratories International, Inc.:
Danaher Strengths
- Diverse revenue streams with recurring and nonrecurring measurement contracts
- Strong global presence including North America, China, and developed markets
- Favorable net margin at 14.7%
- Solid liquidity ratios with current ratio 1.87
- Low leverage with debt-to-assets at 22%
Charles River Strengths
- Focused revenue segments in discovery, manufacturing support, and research models
- Favorable quick ratio of 1.13 indicating good short-term liquidity
- Moderate global diversification including US, Europe, Canada, and Asia Pacific
- Neutral price-to-book at 2.76
Danaher Weaknesses
- Unfavorable return on equity at 6.9% below cost of capital
- High price-to-earnings ratio of 44.8 signals overvaluation risk
- Unfavorable asset turnover at 0.29 reflects lower efficiency
- Low dividend yield at 0.54%
- Moderate exposure to market fluctuations in developed regions
Charles River Weaknesses
- Very low profitability metrics with net margin 0.25% and ROE 0.3%
- High price-to-earnings ratio near 929 raises valuation concerns
- Interest coverage ratio is weak at 1.74, signaling financial risk
- Zero dividend yield limits income appeal
- Higher debt-to-assets ratio at 36% increases leverage risk
Danaher’s diversified global footprint and solid profitability contrast with Charles River’s narrow margins and financial vulnerabilities. Each company’s financial profile reflects distinct strategic priorities and risk exposures.
The Moat Duel: Analyzing Competitive Defensibility
A structural moat is the only true shield preserving long-term profits from relentless competitive pressure and industry commoditization:
Danaher Corporation: Diversified Innovation and Scale Moat
Danaher leverages a broad portfolio and operational excellence to maintain high margins and stable returns. Despite recent ROIC decline, new life sciences products could revitalize its moat in 2026.
Charles River Laboratories: Niche Expertise and Client Integration Moat
Charles River’s competitive edge rests on specialized drug discovery services and deep client relationships. Its narrower scope limits margin expansion but offers opportunities in emerging biotech markets.
Innovation Breadth vs. Specialist Depth
Danaher’s diversified innovation moat is wider but currently challenged by declining capital returns. Charles River’s specialist moat is narrower and weaker, with steeper profitability erosion. Danaher remains better positioned to defend market share through scale and product breadth.
Which stock offers better returns?
The past year shows divergent dynamics between Danaher Corporation and Charles River Laboratories, with both experiencing broad downtrends but differing recent momentum and volatility profiles.
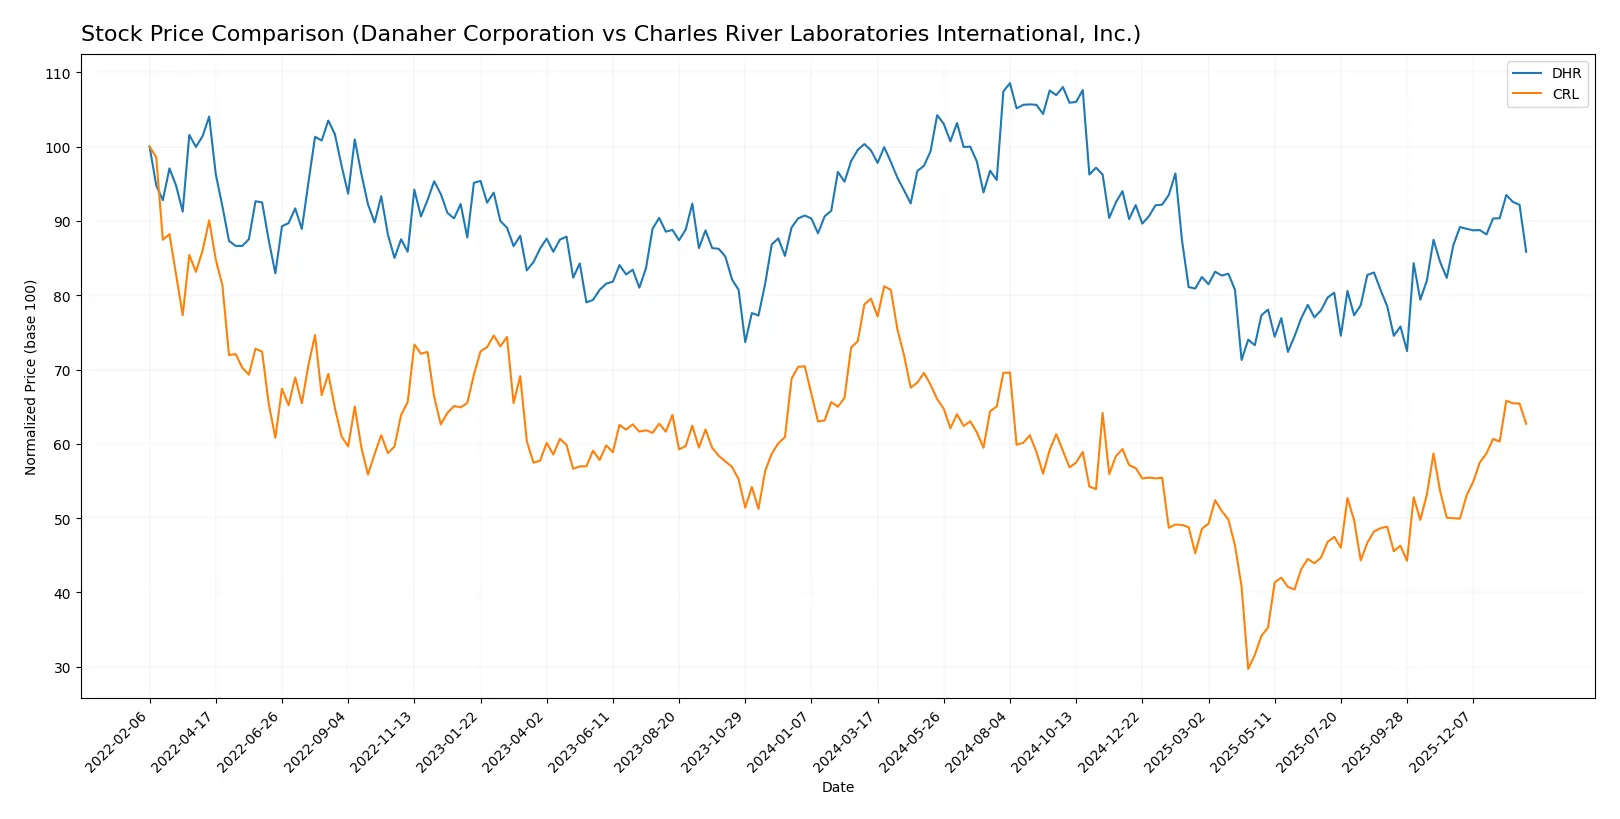
Trend Comparison
Danaher Corporation’s stock declined 13.72% over the last 12 months, reflecting a bearish trend with accelerating downside and high volatility, peaking at 276.75 and bottoming at 181.77.
Charles River Laboratories fell 21.16% over the same period, also bearish with accelerating losses and greater volatility, hitting a high of 272.57 and a low near 99.75.
Recent trends diverge: Danaher shows a mild 1.05% gain, signaling stabilization, while Charles River gained 25.43%, indicating strong short-term recovery and superior recent market performance.
Target Prices
Analysts present a bullish consensus for Danaher Corporation and Charles River Laboratories, signaling confidence in their growth prospects.
| Company | Target Low | Target High | Consensus |
|---|---|---|---|
| Danaher Corporation | 220 | 270 | 252.33 |
| Charles River Laboratories International, Inc. | 185 | 260 | 214.43 |
Both stocks trade below their consensus targets, implying upside potential. Danaher’s target consensus sits 15% above its current price, while Charles River’s target indicates about 2% upside.

Don’t Let Luck Decide Your Entry Point
Optimize your entry points with our advanced ProRealTime indicators. You’ll get efficient buy signals with precise price targets for maximum performance. Start outperforming now!
How do institutions grade them?
Danaher Corporation Grades
Here are the latest institutional grades for Danaher Corporation from leading firms:
| Grading Company | Action | New Grade | Date |
|---|---|---|---|
| JP Morgan | Maintain | Overweight | 2026-01-29 |
| Jefferies | Maintain | Buy | 2026-01-29 |
| TD Cowen | Maintain | Buy | 2026-01-07 |
| Guggenheim | Maintain | Buy | 2026-01-05 |
| Wells Fargo | Maintain | Equal Weight | 2025-12-15 |
| Wells Fargo | Maintain | Equal Weight | 2025-10-23 |
| Barclays | Maintain | Overweight | 2025-10-22 |
| TD Cowen | Maintain | Buy | 2025-10-22 |
| Rothschild & Co | Downgrade | Neutral | 2025-10-08 |
| Evercore ISI Group | Maintain | Outperform | 2025-10-07 |
Charles River Laboratories International, Inc. Grades
The following table shows recent grades from reputable analysts for Charles River Laboratories:
| Grading Company | Action | New Grade | Date |
|---|---|---|---|
| Citigroup | Maintain | Buy | 2026-01-16 |
| Evercore ISI Group | Maintain | Outperform | 2026-01-13 |
| Mizuho | Maintain | Neutral | 2025-12-18 |
| Barclays | Maintain | Overweight | 2025-12-15 |
| JP Morgan | Maintain | Neutral | 2025-12-15 |
| Morgan Stanley | Maintain | Equal Weight | 2025-11-11 |
| TD Cowen | Maintain | Buy | 2025-11-10 |
| Baird | Upgrade | Outperform | 2025-11-06 |
| Barclays | Maintain | Overweight | 2025-11-06 |
| JP Morgan | Maintain | Neutral | 2025-11-06 |
Which company has the best grades?
Danaher holds predominantly Buy and Overweight ratings from top firms, indicating strong confidence. Charles River shows a mix of Buy, Overweight, and Neutral grades with some upgrades. Investors may view Danaher’s steadier Buy consensus as a signal of more consistent institutional support.
Risks specific to each company
The following categories identify the critical pressure points and systemic threats facing both firms in the 2026 market environment:
1. Market & Competition
Danaher Corporation
- Large market cap (154B) supports scale advantages; faces intense innovation demands in diagnostics and life sciences.
Charles River Laboratories International, Inc.
- Smaller market cap (10B) limits scale; operates in niche CRO market with growing competition and pricing pressure.
2. Capital Structure & Debt
Danaher Corporation
- Low debt-to-equity (0.35), strong interest coverage (16.97), reflecting prudent leverage and financial flexibility.
Charles River Laboratories International, Inc.
- Higher leverage (0.79 D/E) with weak interest coverage (1.74) increases refinancing risk amid rising rates.
3. Stock Volatility
Danaher Corporation
- Beta at 0.93 suggests moderate market sensitivity, aligning with sector stability.
Charles River Laboratories International, Inc.
- Beta at 1.62 indicates elevated volatility, exposing investors to wider price swings.
4. Regulatory & Legal
Danaher Corporation
- Operates globally with exposure to evolving medical regulations, but diversified segments mitigate risk.
Charles River Laboratories International, Inc.
- Faces regulatory scrutiny in drug development and animal testing; complexity in global compliance is a concern.
5. Supply Chain & Operations
Danaher Corporation
- Robust supply chain with diversified industrial and life sciences operations; some vulnerability to component shortages.
Charles River Laboratories International, Inc.
- Specialized supply chain for research models and testing services; sensitive to disruptions in biotech supply lines.
6. ESG & Climate Transition
Danaher Corporation
- Initiatives in sustainability and environmental solutions support transition; ESG integration is advanced.
Charles River Laboratories International, Inc.
- ESG efforts less mature; animal welfare and sustainability pressures could increase operational costs.
7. Geopolitical Exposure
Danaher Corporation
- Global footprint broadens risk from trade tensions and regulatory divergence but also diversifies revenue.
Charles River Laboratories International, Inc.
- Significant US and Europe focus; geopolitical shifts could affect regulatory regimes and cross-border collaborations.
Which company shows a better risk-adjusted profile?
Danaher’s strongest risk lies in market competition demanding constant innovation and premium valuation multiples. Charles River faces its greatest risk in elevated leverage and weak profitability, heightening financial vulnerability. Danaher’s diversified business and strong financials create a better risk-adjusted profile. Charles River’s higher beta and distress-zone Altman Z-score flag greater caution. The contrast in interest coverage—17x vs. 1.7x—underscores my concern about Charles River’s debt burden and ability to withstand shocks.
Final Verdict: Which stock to choose?
Danaher Corporation’s superpower lies in its operational resilience and robust balance sheet. The company maintains solid liquidity and manageable debt, supporting stable cash generation. A point of vigilance remains its declining profitability and returns, which could challenge future growth. Danaher suits investors seeking steady, quality exposure in a diversified growth portfolio.
Charles River Laboratories stands out with its strategic niche in the life sciences industry, anchored by recurring client relationships. While it carries higher financial risk and weaker profitability than Danaher, its recent revenue growth and improving market momentum suggest potential upside. This stock may appeal to investors favoring a risk-tolerant GARP approach.
If you prioritize financial stability and operational strength, Danaher is the compelling choice due to its enduring cash flow and conservative leverage. However, if you seek growth with a higher risk tolerance and exposure to specialized life sciences services, Charles River offers better momentum and sector-specific upside. Both require close monitoring of profitability trends and capital efficiency.
Disclaimer: Investment carries a risk of loss of initial capital. The past performance is not a reliable indicator of future results. Be sure to understand risks before making an investment decision.
Go Further
I encourage you to read the complete analyses of Danaher Corporation and Charles River Laboratories International, Inc. to enhance your investment decisions: