Choosing the right agricultural inputs company is critical for investors seeking exposure to basic materials with growth potential. CF Industries Holdings, Inc. (CF) and The Mosaic Company (MOS) both play leading roles in producing essential fertilizers and crop nutrients, serving global markets with overlapping product lines. This comparison will evaluate their innovation strategies, market positions, and financial resilience to help you identify the most promising investment opportunity. Let’s explore which company deserves a spot in your portfolio.

Table of contents
Companies Overview
I will begin the comparison between CF Industries Holdings, Inc. and The Mosaic Company by providing an overview of these two companies and their main differences.
CF Industries Holdings, Inc. Overview
CF Industries Holdings, Inc. manufactures and sells hydrogen and nitrogen products used in energy, fertilizer, emissions abatement, and other industrial activities worldwide. Its key products include anhydrous ammonia, granular urea, and ammonium nitrate. Founded in 1946 and headquartered in Northbrook, Illinois, CF Industries primarily serves cooperatives, independent distributors, traders, and industrial users in the agricultural inputs sector.
The Mosaic Company Overview
The Mosaic Company produces and markets concentrated phosphate and potash crop nutrients globally through its segments: Phosphates, Potash, and Mosaic Fertilizantes. It owns mines for phosphate and potash production and offers phosphate-based animal feed ingredients and industrial products. Incorporated in 2004 and based in Tampa, Florida, Mosaic serves wholesalers, retail chains, farmers, cooperatives, and national accounts within the agricultural inputs industry.
Key similarities and differences
Both CF Industries and Mosaic operate within the agricultural inputs sector, focusing on fertilizer products and related nutrients. CF specializes in nitrogen-based products such as ammonia and urea, while Mosaic emphasizes phosphate and potash crop nutrients along with nitrogen offerings. Additionally, Mosaic operates mining facilities, which CF does not, and employs a significantly larger workforce, reflecting differences in scale and operational scope between the two firms.
Income Statement Comparison
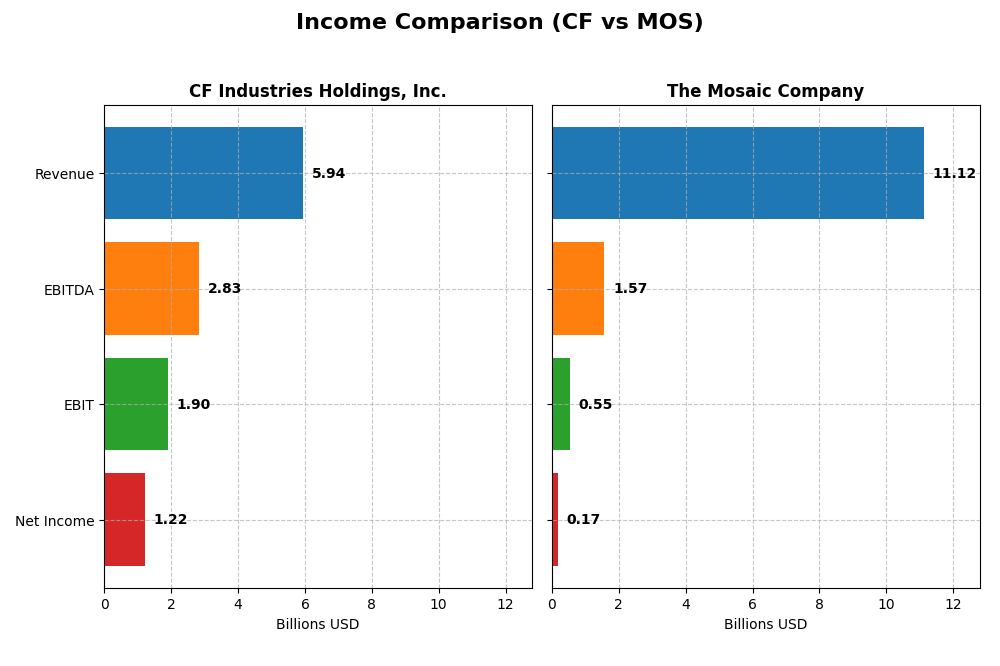
The table below presents a side-by-side comparison of key income statement metrics for CF Industries Holdings, Inc. and The Mosaic Company for the fiscal year 2024.
| Metric | CF Industries Holdings, Inc. | The Mosaic Company |
|---|---|---|
| Market Cap | 13.4B | 8.5B |
| Revenue | 5.94B | 11.12B |
| EBITDA | 2.83B | 1.57B |
| EBIT | 1.90B | 545M |
| Net Income | 1.22B | 175M |
| EPS | 6.75 | 0.55 |
| Fiscal Year | 2024 | 2024 |
Income Statement Interpretations
CF Industries Holdings, Inc.
CF Industries showed strong overall growth from 2020 to 2024, with revenue rising 44% and net income surging 284%. Margins remained robust, with a gross margin of 34.6% and net margin at 20.5%, both favorable. However, in 2024 revenue and profit declined compared to 2023, signaling a slowdown and margin compression despite still strong returns.
The Mosaic Company
Mosaic’s revenue grew 28% over the five-year period but net income fell sharply by 74%, reflecting weaker profitability. Margins were neutral to low, with a gross margin of 13.6% and net margin of just 1.6%. The 2024 year saw a significant drop in revenue and earnings, with steep margin contractions illustrating ongoing operational challenges.
Which one has the stronger fundamentals?
CF Industries holds stronger fundamentals with consistently favorable margins and overall income growth, despite recent declines. In contrast, Mosaic’s declining net income and weak margins weigh on its financial strength, resulting in an unfavorable income statement evaluation. CF’s better margin control and profitability underpin its more solid income fundamentals.
Financial Ratios Comparison
This table presents the most recent financial ratios for CF Industries Holdings, Inc. and The Mosaic Company, reflecting their fiscal year 2024 performance for a clear side-by-side comparison.
| Ratios | CF Industries Holdings, Inc. | The Mosaic Company |
|---|---|---|
| ROE | 24.4% | 1.5% |
| ROIC | 11.5% | 1.6% |
| P/E | 12.6 | 44.9 |
| P/B | 3.09 | 0.68 |
| Current Ratio | 3.08 | 1.08 |
| Quick Ratio | 2.70 | 0.47 |
| D/E | 0.65 | 0.39 |
| Debt-to-Assets | 24.1% | 19.4% |
| Interest Coverage | 14.4 | 2.7 |
| Asset Turnover | 0.44 | 0.49 |
| Fixed Asset Turnover | 0.85 | 0.82 |
| Payout ratio | 29.9% | 154.8% |
| Dividend yield | 2.36% | 3.44% |
Interpretation of the Ratios
CF Industries Holdings, Inc.
CF Industries displays mostly favorable financial ratios with strong net margin at 20.52%, ROE at 24.43%, and ROIC at 11.49%, indicating efficient profitability and capital use. However, its price-to-book ratio and current ratio are less favorable, suggesting valuation and liquidity concerns. The company pays dividends with a 2.36% yield, supported by free cash flow, though careful monitoring of payout sustainability remains essential.
The Mosaic Company
Mosaic’s financial ratios reveal weakness, including a low net margin of 1.57%, ROE at 1.52%, and ROIC at 1.64%, reflecting limited profitability and capital returns. Its valuation shows a high P/E ratio of 44.94, posing potential risk. The dividend yield is 3.44%, but the company’s weak liquidity and coverage ratios call for attention to dividend sustainability and financial health.
Which one has the best ratios?
CF Industries holds the advantage with a majority of favorable ratios, strong profitability, and balanced capital efficiency, despite some valuation and liquidity drawbacks. Conversely, Mosaic’s ratios indicate weaker earnings performance and higher valuation risk, with a less favorable overall financial profile, rendering its ratios slightly unfavorable in comparison.
Strategic Positioning
This section compares the strategic positioning of CF and MOS, focusing on market position, key segments, and exposure to technological disruption:
CF
- Strong market cap of 13.4B, lower beta at 0.68, facing agricultural inputs competition.
- Key segments include ammonia, UAN, urea, and ammonium nitrate, serving cooperatives and distributors.
- No explicit mention of technological disruption exposure in the data provided.
MOS
- Market cap of 8.5B, higher beta at 0.95, operates under competitive pressure in fertilizers.
- Operates Phosphates, Potash, and Mosaic Fertilizantes segments, targeting wholesale and retail chains.
- No explicit mention of technological disruption exposure in the data provided.
CF vs MOS Positioning
CF focuses on a narrower product range centered on nitrogen-based fertilizers with a moderate workforce, while MOS operates more diversified segments including phosphate and potash with a significantly larger employee base, indicating broader operational scope but higher complexity.
Which has the best competitive advantage?
CF demonstrates a very favorable moat with growing ROIC above WACC, indicating durable competitive advantage. MOS shows a very unfavorable moat with declining ROIC below WACC, suggesting value destruction and weaker competitive positioning.
Stock Comparison
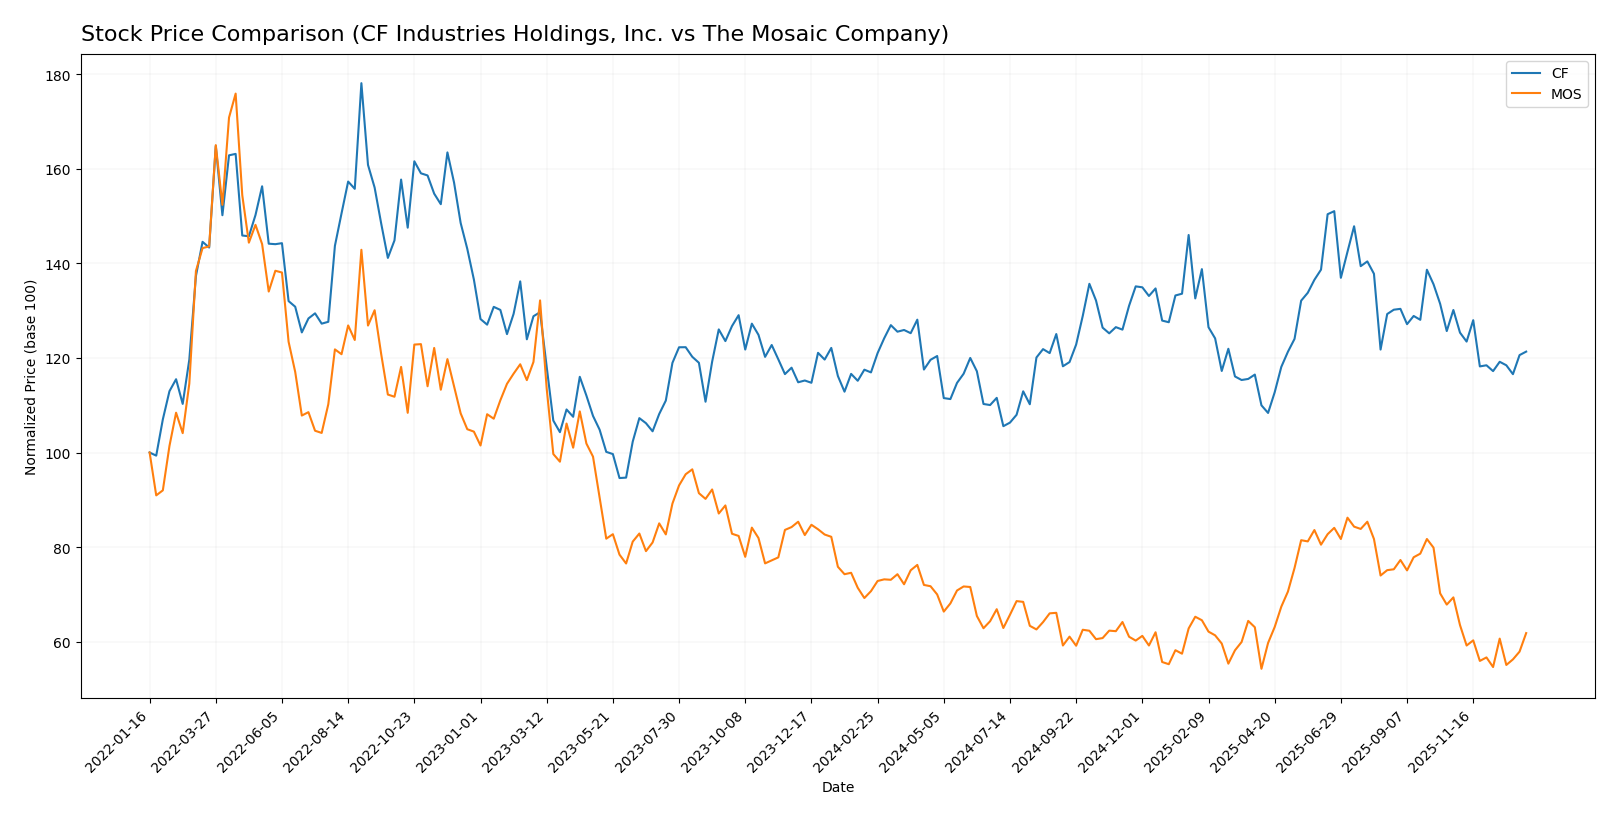
The stock price movements of CF Industries Holdings, Inc. and The Mosaic Company over the past 12 months reveal contrasting trends, with CF showing moderate gains and MOS experiencing notable declines amid evolving trading volumes and market dynamics.
Trend Analysis
CF Industries Holdings, Inc. exhibited a 3.76% price increase over the past year, indicating a bullish trend with deceleration. The stock ranged from 70.14 to 100.36, with a recent short-term decline of -6.77%.
The Mosaic Company showed a bearish trend with a -12.55% price change over 12 months and decelerating decline. Its price fluctuated between 23.45 and 37.27, accompanied by a recent sharper drop of -10.89%.
Comparing both, CF delivered the highest market performance with a positive 3.76% annual gain, outperforming MOS’s significant negative trend.
Target Prices
Analysts provide a clear consensus on target prices for CF Industries Holdings, Inc. and The Mosaic Company, reflecting moderate upside potential.
| Company | Target High | Target Low | Consensus |
|---|---|---|---|
| CF Industries Holdings, Inc. | 96 | 87 | 90.2 |
| The Mosaic Company | 44 | 27 | 35.33 |
The consensus targets suggest that CF Industries’ stock price of 80.62 USD has room to grow toward the 90 USD level, while The Mosaic Company’s current price of 26.71 USD is slightly below its consensus target, indicating potential appreciation.
Analyst Opinions Comparison
This section compares analysts’ ratings and grades for CF Industries Holdings, Inc. (CF) and The Mosaic Company (MOS):
Rating Comparison
CF Rating
- Rating: A- rating, categorized as Very Favorable.
- Discounted Cash Flow Score: 5, indicating Very Favorable.
- ROE Score: 5, reflecting Very Favorable efficiency in generating profit from equity.
- ROA Score: 5, showing Very Favorable asset utilization.
- Debt To Equity Score: 1, indicating a Very Unfavorable financial risk due to high leverage.
- Overall Score: 4, assessed as Favorable.
MOS Rating
- Rating: A- rating, categorized as Very Favorable.
- Discounted Cash Flow Score: 5, indicating Very Favorable.
- ROE Score: 4, reflecting Favorable efficiency in generating profit from equity.
- ROA Score: 4, showing Favorable asset utilization.
- Debt To Equity Score: 2, indicating Moderate financial risk with better balance sheet strength.
- Overall Score: 4, assessed as Favorable.
Which one is the best rated?
Both CF and MOS share the same overall rating of A- and an overall score of 4, categorized as Favorable. CF scores higher in ROE and ROA but has a more unfavorable debt-to-equity score, while MOS presents a more balanced financial risk profile.
Scores Comparison
The scores comparison between CF Industries Holdings, Inc. and The Mosaic Company is as follows:
CF Scores
- Altman Z-Score: 2.73, in the grey zone, moderate bankruptcy risk.
- Piotroski Score: 7, indicating strong financial health.
MOS Scores
- Altman Z-Score: 2.04, also in the grey zone, moderate bankruptcy risk.
- Piotroski Score: 6, indicating average financial health.
Which company has the best scores?
Based strictly on the provided data, CF Industries shows a higher Piotroski Score (7 vs. 6) indicating stronger financial health, while both companies have similar Altman Z-Scores in the grey zone, reflecting moderate bankruptcy risk.
Grades Comparison
Here is a summary of the most recent grades for CF Industries Holdings, Inc. and The Mosaic Company:
CF Industries Holdings, Inc. Grades
The following table lists recent grades from verified grading companies for CF Industries Holdings, Inc.:
| Grading Company | Action | New Grade | Date |
|---|---|---|---|
| Mizuho | Maintain | Neutral | 2025-12-18 |
| Wells Fargo | Maintain | Overweight | 2025-11-11 |
| Scotiabank | Maintain | Sector Perform | 2025-11-10 |
| RBC Capital | Maintain | Sector Perform | 2025-11-10 |
| Mizuho | Maintain | Neutral | 2025-11-06 |
| UBS | Maintain | Neutral | 2025-11-06 |
| Wells Fargo | Maintain | Overweight | 2025-10-16 |
| B of A Securities | Maintain | Underperform | 2025-10-14 |
| Mizuho | Maintain | Neutral | 2025-10-09 |
| UBS | Maintain | Neutral | 2025-10-06 |
The grades for CF Industries largely range between Neutral and Overweight, with a consistent maintenance of these ratings, indicating stable analyst sentiment.
The Mosaic Company Grades
The following table lists recent grades from verified grading companies for The Mosaic Company:
| Grading Company | Action | New Grade | Date |
|---|---|---|---|
| Mizuho | Maintain | Neutral | 2025-12-18 |
| Barclays | Maintain | Overweight | 2025-12-09 |
| JP Morgan | Maintain | Neutral | 2025-12-05 |
| Barclays | Maintain | Overweight | 2025-11-13 |
| Goldman Sachs | Maintain | Buy | 2025-11-12 |
| Wells Fargo | Maintain | Equal Weight | 2025-11-11 |
| JP Morgan | Downgrade | Neutral | 2025-11-11 |
| Scotiabank | Maintain | Sector Perform | 2025-11-10 |
| CIBC | Maintain | Neutral | 2025-11-06 |
| UBS | Maintain | Buy | 2025-11-05 |
The Mosaic Company shows a mix of ratings from Neutral to Buy, with some downgrades but also maintained Overweight and Buy grades, reflecting a somewhat varied but generally moderate positive outlook.
Which company has the best grades?
CF Industries Holdings, Inc. has a consensus “Buy” rating with more buy recommendations (21) than The Mosaic Company, which holds a consensus “Hold” with fewer buys (17) and more holds (25). Investors might interpret CF’s stronger buy consensus as a sign of comparatively greater confidence from analysts, potentially influencing portfolio decisions towards CF.
Strengths and Weaknesses
The table below summarizes the key strengths and weaknesses of CF Industries Holdings, Inc. (CF) and The Mosaic Company (MOS) based on their recent financial and operational data.
| Criterion | CF Industries Holdings, Inc. (CF) | The Mosaic Company (MOS) |
|---|---|---|
| Diversification | Moderate product diversification with Ammonia, UAN, Urea, AN; strong US and Non-US market presence | Focused on fertilizers: Phosphates, Potash, Mosaic Fertilizantes; less diversified product base |
| Profitability | High net margin (20.52%), ROIC 11.49%, favorable ratios overall | Low net margin (1.57%), ROIC 1.64%, several unfavorable profitability ratios |
| Innovation | Demonstrates growing ROIC trend, indicating efficient capital use and value creation | Declining ROIC trend, value destruction; innovation and capital efficiency appear weak |
| Global presence | Strong US market dominance with growing non-US sales | Global presence in fertilizer markets, but profitability challenges limit impact |
| Market Share | Solid market share in nitrogen-based fertilizers with increasing returns | Significant share in phosphates and potash, but facing profitability pressures |
In summary, CF Industries shows a durable competitive advantage with strong profitability, growing returns, and diversified nitrogen fertilizer products. Mosaic struggles with profitability and declining returns despite its sizeable presence in phosphate and potash markets. Investors should weigh CF’s value-creating profile against Mosaic’s challenges in capital efficiency and profit generation.
Risk Analysis
Below is a comparative table highlighting key risks for CF Industries Holdings, Inc. (CF) and The Mosaic Company (MOS) based on the most recent data from 2024.
| Metric | CF Industries Holdings, Inc. | The Mosaic Company |
|---|---|---|
| Market Risk | Moderate (Beta 0.68) | Higher (Beta 0.95) |
| Debt Level | Moderate (D/E 0.65, Neutral) | Low (D/E 0.39, Favorable) |
| Regulatory Risk | Moderate | Moderate |
| Operational Risk | Moderate (Asset turnover low) | Moderate (Asset turnover low) |
| Environmental Risk | Moderate (fertilizer industry) | Moderate (mining & fertilizer) |
| Geopolitical Risk | Present (global supply chains) | Present (global supply chains) |
CF benefits from strong profitability and financial stability but faces moderate market risk with a beta below 1, suggesting less volatility. MOS exhibits higher market risk and lower profitability, though it carries less debt, which reduces financial risk. Both companies operate in sectors sensitive to regulatory changes and environmental concerns, with geopolitical tensions affecting global supply chains as a significant risk factor. Investors should weigh these risks carefully alongside each firm’s operational and financial health.
Which Stock to Choose?
CF Industries Holdings, Inc. shows a favorable income evolution with strong profitability metrics, including a 20.52% net margin and 24.43% ROE, supported by a manageable debt level and a very favorable overall rating of A-. Its financial ratios are mostly favorable, reflecting efficient capital use and solid value creation.
The Mosaic Company exhibits an unfavorable income evolution with low profitability, including a 1.57% net margin and 1.52% ROE, coupled with higher debt relative to earnings. Despite a very favorable overall rating of A-, its financial ratios are slightly unfavorable, indicating challenges in operational efficiency and value preservation.
For investors prioritizing durable competitive advantage and value creation, CF Industries might appear more favorable given its very favorable moat status and stronger profitability. Conversely, those focused on dividend yield or lower price-to-book ratios could find Mosaic’s profile more appealing, though its financial performance suggests caution.
Disclaimer: Investment carries a risk of loss of initial capital. The past performance is not a reliable indicator of future results. Be sure to understand risks before making an investment decision.
Go Further
I encourage you to read the complete analyses of CF Industries Holdings, Inc. and The Mosaic Company to enhance your investment decisions: