Home > Comparison > Basic Materials > CTVA vs CF
The strategic rivalry between Corteva, Inc. and CF Industries Holdings, Inc. shapes the agricultural inputs sector’s evolution. Corteva leads with a technology-driven seed and crop protection model, focusing on innovation and digital farming solutions. CF Industries operates a capital-intensive fertilizer manufacturing business, emphasizing commodity production efficiency. This analysis compares growth-oriented innovation versus industrial scale, determining which trajectory offers superior risk-adjusted returns for a diversified portfolio in 2026.
Table of contents
Companies Overview
Corteva and CF Industries both anchor the agricultural inputs sector with distinct market roles and strategic priorities.
Corteva, Inc.: Agricultural Innovation Leader
Corteva stands as a major seed and crop protection provider. It generates revenue by developing advanced germplasm and trait technologies that boost farm yields and crop resilience. In 2026, it emphasized digital solutions to optimize farmer decisions, reinforcing its competitive edge in integrated agricultural inputs globally.
CF Industries Holdings, Inc.: Nitrogen Fertilizer Specialist
CF Industries focuses on manufacturing nitrogen-based fertilizers and industrial chemicals. Its revenue comes from products like anhydrous ammonia and urea sold primarily to distributors and industrial users. In the latest year, CF prioritized expanding its production capacity to meet rising global nitrogen demand, strengthening its foothold in fertilizer supply chains.
Strategic Collision: Similarities & Divergences
Both operate in agricultural inputs but diverge sharply: Corteva pursues a technology-driven, integrated crop approach, while CF focuses on commodity nitrogen products. Their primary battleground is global farm productivity versus raw fertilizer supply. Investors face contrasting profiles—Corteva offers innovation-led growth, CF provides exposure to fundamental fertilizer cycles.
Income Statement Comparison
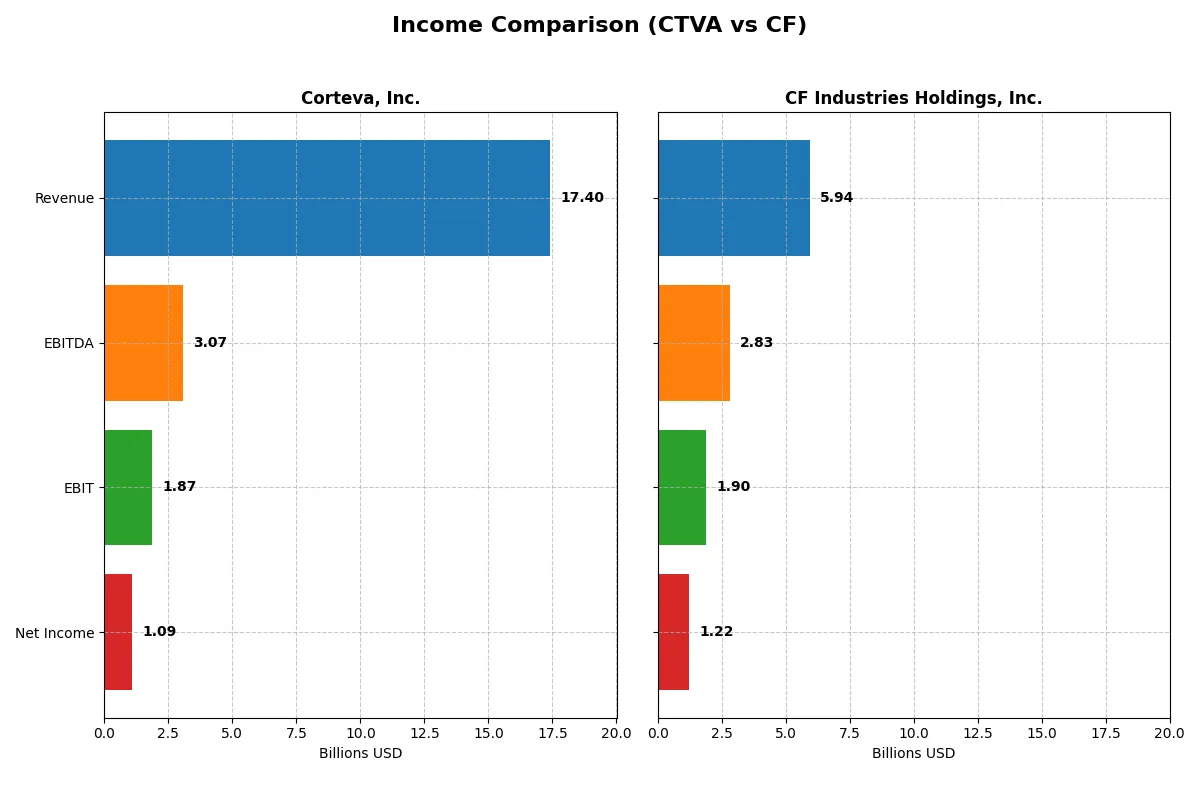
This data dissects the core profitability and scalability of both corporate engines to reveal who dominates the bottom line:
| Metric | Corteva, Inc. (CTVA) | CF Industries Holdings, Inc. (CF) |
|---|---|---|
| Revenue | 17.4B | 5.9B |
| Cost of Revenue | 9.8B | 3.9B |
| Operating Expenses | 5.0B | 310M |
| Gross Profit | 7.6B | 2.1B |
| EBITDA | 3.1B | 2.8B |
| EBIT | 1.9B | 1.9B |
| Interest Expense | 180M | 121M |
| Net Income | 1.1B | 1.2B |
| EPS | 1.61 | 6.75 |
| Fiscal Year | 2025 | 2024 |
Income Statement Analysis: The Bottom-Line Duel
This income statement comparison reveals the true efficiency and profitability of Corteva, Inc. and CF Industries Holdings, Inc. over recent years.
Corteva, Inc. Analysis
Corteva’s revenue grew modestly to $17.4B in 2025, with net income rising to $1.09B, reflecting improved profitability. Its gross margin remains healthy at 43.6%, supporting a solid 6.3% net margin. Corteva’s 2025 EBIT margin climbed to 10.7%, signaling stronger operational efficiency and favorable momentum despite slower revenue growth.
CF Industries Holdings, Inc. Analysis
CF’s revenue declined 10.5% to $5.9B in 2024, with net income falling to $1.22B. Despite this, it maintains robust margins: a 34.6% gross margin and a 20.5% net margin. EBIT margin stands at an impressive 32%. CF’s sharp margin erosion this past year contrasts with strong overall growth since 2020, highlighting volatility in earnings momentum.
Margin Efficiency vs. Revenue Growth Momentum
Corteva delivers steady revenue growth with improving margins, emphasizing operational efficiency. CF boasts superior margin percentages but faces recent revenue and profit contractions. Investors seeking consistent growth may prefer Corteva, while those valuing high margin resilience might find CF’s earnings profile more compelling despite recent headwinds.
Financial Ratios Comparison
These vital ratios act as a diagnostic tool to expose the underlying fiscal health, valuation premiums, and capital efficiency of the companies compared below:
| Ratios | Corteva, Inc. (CTVA) | CF Industries Holdings, Inc. (CF) |
|---|---|---|
| ROE | 4.53% | 24.43% |
| ROIC | 6.67% | 11.49% |
| P/E | 41.25 | 12.64 |
| P/B | 1.87 | 3.09 |
| Current Ratio | 1.43 | 3.08 |
| Quick Ratio | 0.96 | 2.70 |
| D/E | 0.11 | 0.65 |
| Debt-to-Assets | 6.02% | 24.11% |
| Interest Coverage | 14.55 | 14.43 |
| Asset Turnover | 0.41 | 0.44 |
| Fixed Asset Turnover | 4.12 | 0.85 |
| Payout ratio | 43.42% | 29.89% |
| Dividend yield | 1.05% | 2.36% |
| Fiscal Year | 2025 | 2024 |
Efficiency & Valuation Duel: The Vital Signs
Financial ratios act as a company’s DNA, uncovering hidden risks and signaling operational excellence to guide investors’ decisions.
Corteva, Inc.
Corteva shows moderate profitability with a 4.53% ROE and neutral net margin of 6.29%. The stock trades expensive at a 41.25 P/E, suggesting stretched valuation. Its 1.05% dividend yield provides modest shareholder returns, balanced by reinvestments in R&D driving growth potential amid cautious capital allocation.
CF Industries Holdings, Inc.
CF Industries delivers robust profitability with a 24.43% ROE and a strong net margin of 20.52%. The valuation appears attractive with a 12.64 P/E despite a relatively high 3.09 P/B. CF rewards shareholders with a 2.36% dividend yield, reflecting solid cash flow generation and effective capital deployment.
Robust Profitability Meets Valuation Discipline
CF Industries offers a compelling balance of high returns and reasonable valuation, outperforming Corteva’s stretched multiples and lower profitability. Investors prioritizing efficiency and shareholder yield may favor CF’s profile, while those valuing growth reinvestment might consider Corteva’s approach.
Which one offers the Superior Shareholder Reward?
I compare Corteva, Inc. (CTVA) and CF Industries Holdings, Inc. (CF) on dividends, payout ratios, and buybacks. CF yields 2.36% with a 30% payout ratio, supported by robust free cash flow of 9.7B and strong buybacks. CTVA pays a lower 1.05% yield, with a higher 43% payout ratio, free cash flow per share at 4.26, and modest buybacks. CF’s aggressive buyback and lower payout ratio signal a more sustainable, shareholder-friendly model amid industry volatility. I favor CF for superior total return potential in 2026.
Comparative Score Analysis: The Strategic Profile
The radar chart reveals the fundamental DNA and trade-offs of Corteva, Inc. and CF Industries Holdings, Inc., highlighting their strategic strengths and vulnerabilities:
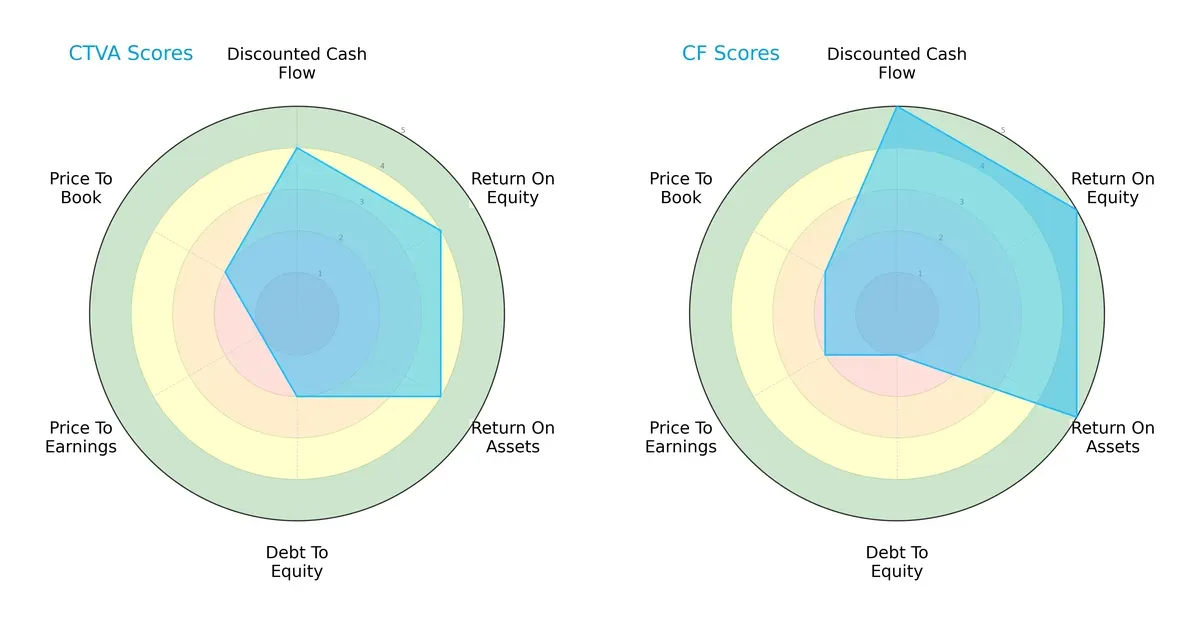
CF leads with a more balanced profile, excelling in DCF (5 vs. 4), ROE (5 vs. 4), and ROA (5 vs. 4), signaling superior profitability and asset efficiency. Corteva shows moderate overall strength but struggles with valuation metrics, scoring very unfavorable in P/E (1) and unfavorable in P/B (2). Both firms have weak debt-to-equity scores, though Corteva fares slightly better (2 vs. 1). CF’s edge lies in operational efficiency; Corteva depends more on specific valuation factors.
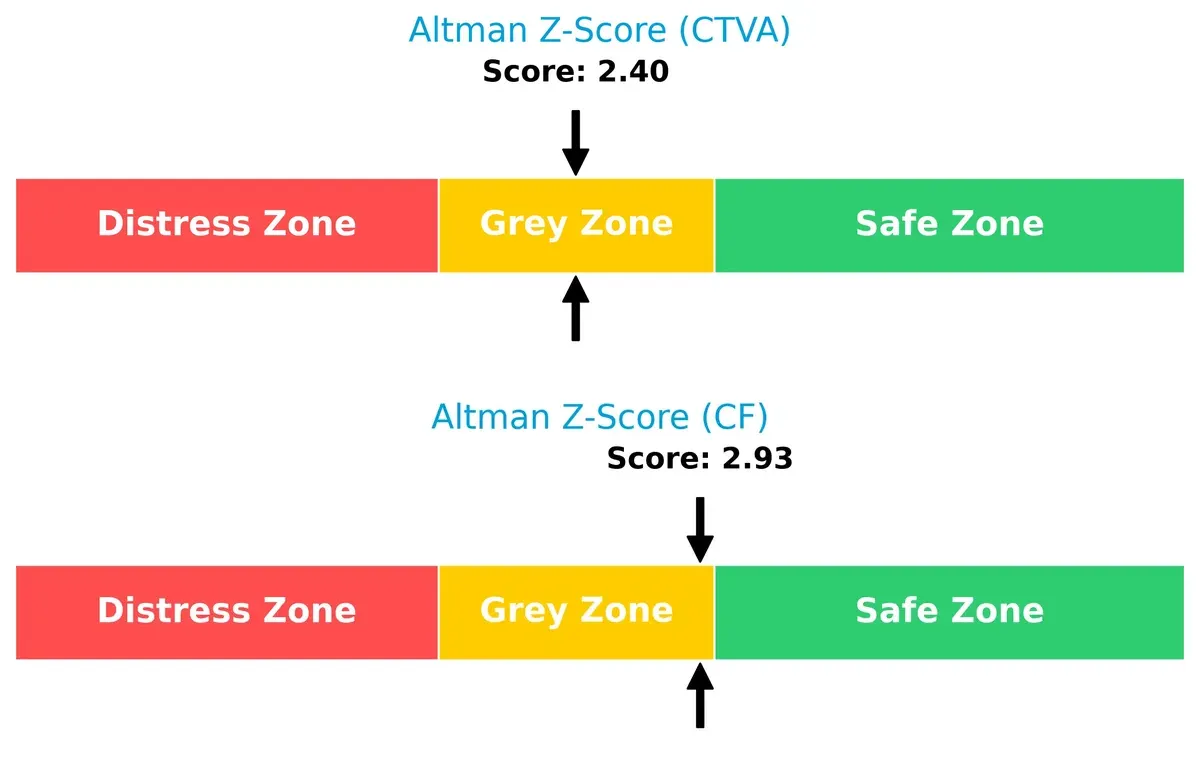
Bankruptcy Risk: Solvency Showdown
The Altman Z-Scores place both companies in the grey zone, indicating moderate bankruptcy risk. CF edges closer to safety at 2.93 compared to Corteva’s 2.40:
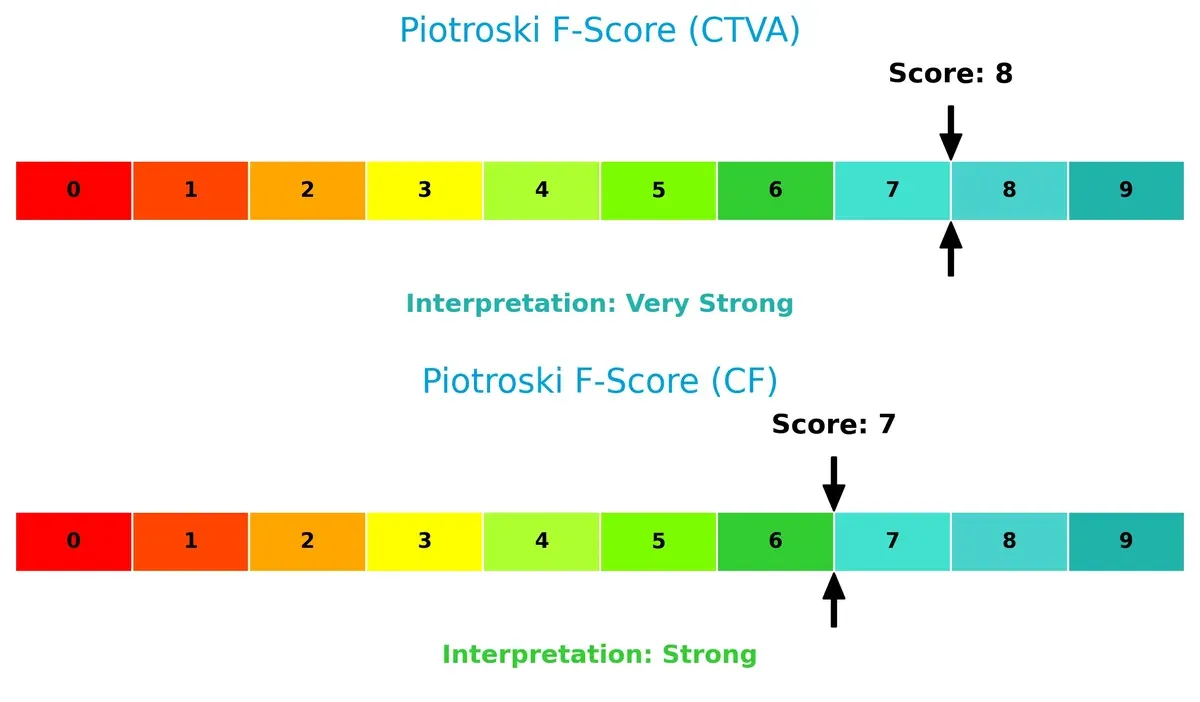
Financial Health: Quality of Operations
Corteva boasts a very strong Piotroski F-Score of 8, suggesting robust internal financial health. CF follows with a strong score of 7, indicating sound but slightly weaker operational metrics:
How are the two companies positioned?
This section dissects the operational DNA of Corteva and CF by comparing their revenue distribution and internal dynamics, including strengths and weaknesses. The goal is to confront their economic moats and identify which model delivers the most resilient, sustainable competitive advantage today.
Revenue Segmentation: The Strategic Mix
This visual comparison dissects how Corteva, Inc. and CF Industries Holdings, Inc. diversify their income streams and where their primary sector bets lie:
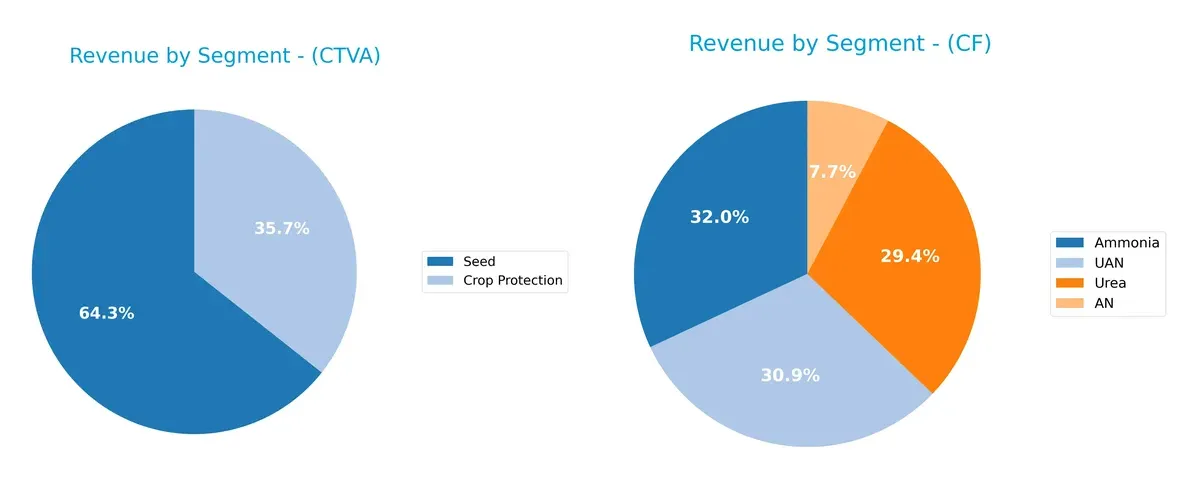
Corteva pivots on two main segments: Seed at $6.5B and Crop Protection at $3.6B in 2024, showing a balanced agritech portfolio. CF relies on a more fragmented fertilizer mix, with Ammonia at $1.7B, UAN at $1.7B, and Urea at $1.6B, but this diversification still centers on nitrogen-based products. Corteva’s focused dual-segment model drives ecosystem lock-in, while CF’s multi-product approach reduces single-product risk but hinges on commodity cycles.
Strengths and Weaknesses Comparison
This table compares the strengths and weaknesses of Corteva, Inc. and CF Industries Holdings, Inc.:
Corteva Strengths
- Diverse revenue streams from Seed and Crop Protection segments
- Balanced geographic exposure across Americas, EMEA, Asia Pacific
- Favorable debt metrics indicating strong financial stability
CF Strengths
- Strong profitability with high net margin and ROE
- Favorable WACC and interest coverage support capital efficiency
- Geographic diversification with significant US and Non-US revenues
Corteva Weaknesses
- Lower ROE and asset turnover compared to sector benchmarks
- Elevated P/E ratio implies higher valuation risk
- Neutral liquidity ratios may restrict short-term flexibility
CF Weaknesses
- Elevated debt-to-equity ratio indicating higher leverage
- Unfavorable current ratio suggests potential liquidity concerns
- Weaker fixed asset turnover compared to peers
Corteva shows moderate financial stability with diversified products and global reach but faces challenges in profitability efficiency. CF demonstrates strong profitability and capital structure efficiency but carries higher leverage and liquidity risks. These factors shape their strategic priorities differently.
The Moat Duel: Analyzing Competitive Defensibility
A structural moat is the only shield protecting long-term profits from relentless competition erosion. Let’s dissect the moats of Corteva and CF Industries:
Corteva, Inc.: Innovation-Driven Trait and Seed Technology Moat
Corteva’s moat stems from advanced germplasm and trait technologies that drive stable margins and rising ROIC trends despite an ROIC below WACC. New digital tools and product lines could deepen its innovation edge in 2026.
CF Industries Holdings, Inc.: Cost Advantage and Scale Moat
CF relies on cost leadership in nitrogen fertilizer production, reflected in a robust ROIC exceeding WACC and superior margin expansion versus Corteva. Its expanding global footprint could disrupt markets further as scale economies grow.
Innovation vs. Scale: Who Holds the Stronger Moat?
CF’s cost and scale moat is wider and deeper than Corteva’s innovation moat, which still struggles to generate economic profits. CF stands better poised to defend and grow market share amid evolving agricultural demands.
Which stock offers better returns?
The past year shows Corteva’s stock rising sharply by 31.78%, while CF Industries gained a more moderate 11.05%, both with accelerating momentum.
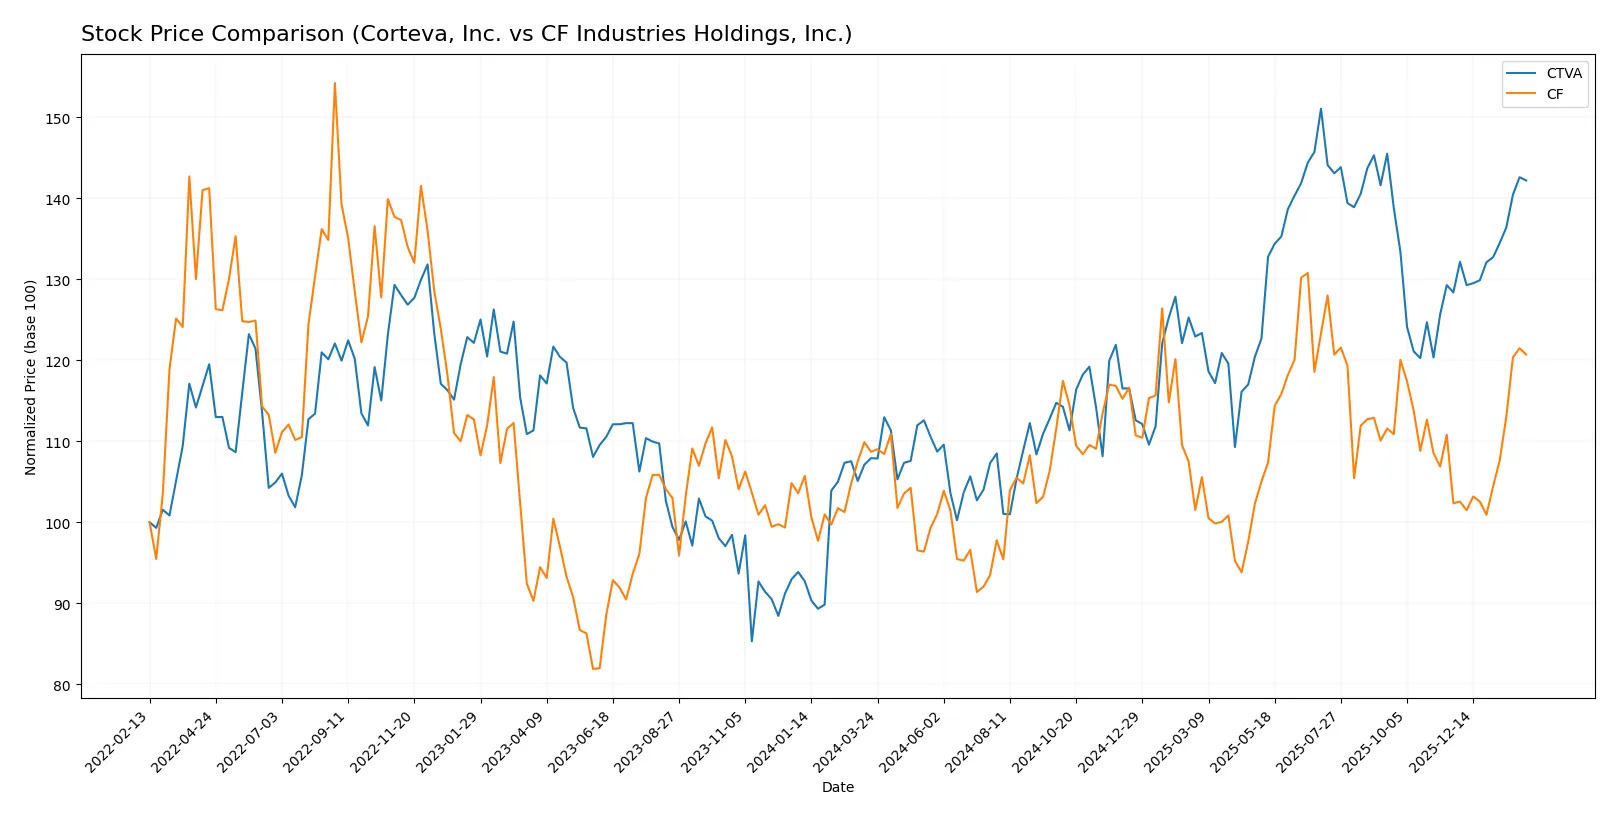
Trend Comparison
Corteva, Inc. exhibits a strong bullish trend with a 31.78% price increase over 12 months. The stock shows acceleration and a high of 77.12, signaling robust upward momentum.
CF Industries Holdings, Inc. posts a bullish 11.05% gain in the same period. It also accelerates, reaching a peak price of 100.36, but with less overall growth than Corteva.
Corteva’s stock outperforms CF Industries, delivering nearly triple the market return over the past year. Both trends accelerate, but Corteva leads clearly in total gain.
Target Prices
Analysts present a firm target consensus for Corteva, Inc. and CF Industries Holdings, Inc., indicating moderate upside potential.
| Company | Target Low | Target High | Consensus |
|---|---|---|---|
| Corteva, Inc. | 80 | 89 | 84.88 |
| CF Industries Holdings, Inc. | 72 | 90 | 84.17 |
Both stocks show target consensus prices above their current levels, suggesting analysts expect appreciation. Corteva trades at $72.6, well below its $84.88 consensus, while CF trades at $92.64, slightly above its $84.17 consensus, indicating differing market sentiment.

Don’t Let Luck Decide Your Entry Point
Optimize your entry points with our advanced ProRealTime indicators. You’ll get efficient buy signals with precise price targets for maximum performance. Start outperforming now!
How do institutions grade them?
The following tables summarize recent grades from major financial institutions for both companies:
Corteva, Inc. Grades
This table lists recent grades and rating actions from reputable financial firms for Corteva, Inc.:
| Grading Company | Action | New Grade | Date |
|---|---|---|---|
| Citigroup | Maintain | Neutral | 2026-02-05 |
| JP Morgan | Downgrade | Neutral | 2026-02-05 |
| Wells Fargo | Maintain | Overweight | 2026-02-05 |
| RBC Capital | Maintain | Outperform | 2026-02-05 |
| Oppenheimer | Maintain | Outperform | 2026-01-27 |
| Citigroup | Maintain | Neutral | 2026-01-21 |
| JP Morgan | Maintain | Overweight | 2026-01-21 |
| Mizuho | Maintain | Outperform | 2026-01-16 |
| Citigroup | Maintain | Neutral | 2025-12-18 |
| Wells Fargo | Maintain | Overweight | 2025-11-11 |
CF Industries Holdings, Inc. Grades
This table shows recent grades and rating actions from verified grading companies for CF Industries Holdings, Inc.:
| Grading Company | Action | New Grade | Date |
|---|---|---|---|
| Scotiabank | Maintain | Sector Perform | 2026-02-02 |
| RBC Capital | Maintain | Sector Perform | 2026-01-20 |
| JP Morgan | Maintain | Neutral | 2026-01-15 |
| UBS | Maintain | Neutral | 2026-01-12 |
| Mizuho | Maintain | Neutral | 2025-12-18 |
| Wells Fargo | Maintain | Overweight | 2025-11-11 |
| RBC Capital | Maintain | Sector Perform | 2025-11-10 |
| Scotiabank | Maintain | Sector Perform | 2025-11-10 |
| UBS | Maintain | Neutral | 2025-11-06 |
| Mizuho | Maintain | Neutral | 2025-11-06 |
Which company has the best grades?
Corteva, Inc. consistently receives higher ratings such as Outperform and Overweight, while CF Industries mainly holds Sector Perform and Neutral grades. This suggests Corteva currently enjoys stronger institutional confidence, potentially influencing investor sentiment favorably.
Risks specific to each company
The following categories identify the critical pressure points and systemic threats facing both firms in the 2026 market environment:
1. Market & Competition
Corteva, Inc.
- Faces pressure from innovation demands and commodity price fluctuations in seeds and crop protection.
CF Industries Holdings, Inc.
- Confronts volatility in fertilizer prices and competition in nitrogen products amid global supply shifts.
2. Capital Structure & Debt
Corteva, Inc.
- Maintains low debt levels with favorable debt-to-assets and interest coverage ratios, indicating financial stability.
CF Industries Holdings, Inc.
- Carries higher debt-to-equity ratio, raising leverage risk despite solid interest coverage and manageable debt-to-assets.
3. Stock Volatility
Corteva, Inc.
- Exhibits moderate volatility with beta around 0.74, less sensitive to market swings.
CF Industries Holdings, Inc.
- Displays slightly lower beta near 0.69, showing marginally less stock price volatility than Corteva.
4. Regulatory & Legal
Corteva, Inc.
- Faces rigorous agricultural chemical regulations and evolving global trade policies.
CF Industries Holdings, Inc.
- Subject to environmental regulations tied to nitrogen emissions and fertilizer production standards.
5. Supply Chain & Operations
Corteva, Inc.
- Dependent on global seed trait innovations and crop protection distribution networks vulnerable to disruption.
CF Industries Holdings, Inc.
- Relies heavily on natural gas prices affecting production costs and logistics complexity for fertilizer supply.
6. ESG & Climate Transition
Corteva, Inc.
- Needs to meet rising standards on sustainable agriculture and reduce chemical environmental impact.
CF Industries Holdings, Inc.
- Faces pressure to reduce carbon footprint and adapt fertilizer production amid climate policy tightening.
7. Geopolitical Exposure
Corteva, Inc.
- Exposure to trade tensions affecting agricultural exports in key regions like Asia-Pacific and Latin America.
CF Industries Holdings, Inc.
- Vulnerable to geopolitical risks impacting energy prices and fertilizer export restrictions globally.
Which company shows a better risk-adjusted profile?
CF Industries faces the most significant risk from its elevated leverage, which increases financial vulnerability despite strong profitability. Corteva’s key risk lies in market competition and regulatory complexity, which could pressure margins. CF’s superior profitability and favorable Altman Z-Score near the safe zone suggest a better risk-adjusted profile. However, Corteva’s lower leverage and stable liquidity reduce bankruptcy risk. The recent divergence in debt-to-equity ratios justifies caution on CF’s balance sheet risk.
Final Verdict: Which stock to choose?
Corteva, Inc. (CTVA) excels as a cash-efficient operator with improving profitability, signaling a turnaround in value creation. Its main point of vigilance remains the slightly unfavorable ROIC versus WACC, suggesting cautious capital deployment. It suits portfolios seeking steady recovery with moderate risk appetite.
CF Industries Holdings, Inc. (CF) boasts a robust moat powered by superior ROIC well above WACC and a history of value creation. Its financial strength and recurring cash flow enhance safety relative to Corteva. CF fits well in GARP portfolios aiming for sustainable growth with a stable income profile.
If you prioritize disciplined capital efficiency and a turnaround story, Corteva offers an intriguing scenario despite some value erosion. However, if you seek a proven value creator with superior profitability and stronger financial resilience, CF outshines as the more stable candidate commanding a premium. Each appeals to distinct investor profiles balancing growth potential and risk tolerance.
Disclaimer: Investment carries a risk of loss of initial capital. The past performance is not a reliable indicator of future results. Be sure to understand risks before making an investment decision.
Go Further
I encourage you to read the complete analyses of Corteva, Inc. and CF Industries Holdings, Inc. to enhance your investment decisions: