In the dynamic semiconductor industry, Tower Semiconductor Ltd. (TSEM) and CEVA, Inc. (CEVA) stand out for their distinct yet overlapping roles in innovation and technology. Tower focuses on analog mixed-signal manufacturing, while CEVA specializes in licensing advanced wireless and AI processing technologies. This comparison explores their market strategies and growth potential to help you identify which company holds the most promise for your investment portfolio. Let’s dive into the details.
Table of contents
Companies Overview
I will begin the comparison between Tower Semiconductor Ltd. and CEVA, Inc. by providing an overview of these two companies and their main differences.
Tower Semiconductor Ltd. Overview
Tower Semiconductor Ltd. is an independent semiconductor foundry specializing in analog intensive mixed-signal semiconductor devices. The company offers customizable process technologies such as SiGe, BiCMOS, RF CMOS, and MEMS, serving diverse markets including consumer electronics, automotive, aerospace, and medical devices. Founded in 1993 and headquartered in Israel, Tower operates wafer fabrication and design services globally.
CEVA, Inc. Overview
CEVA, Inc. is a licensor of wireless connectivity and smart sensing technologies for semiconductor and OEM companies worldwide. It designs and licenses digital signal processors, AI processors, and wireless platforms for applications like 5G, IoT, imaging, and voice recognition. Founded in 1999 and based in the US, CEVA provides IP solutions and software development tools to clients across mobile, automotive, robotics, and industrial sectors.
Key similarities and differences
Both Tower Semiconductor and CEVA operate in the semiconductor industry but focus on different segments: Tower manufactures semiconductor devices and offers fabrication services, while CEVA licenses intellectual property and software for wireless and AI applications. Tower serves a broad range of end markets through hardware production, whereas CEVA’s business model centers on technology licensing and support to OEMs and chip designers.
Income Statement Comparison
The table below compares key income statement metrics for Tower Semiconductor Ltd. and CEVA, Inc. for the fiscal year 2024, providing a snapshot of their financial performance.

| Metric | Tower Semiconductor Ltd. | CEVA, Inc. |
|---|---|---|
| Market Cap | 13.9B | 536M |
| Revenue | 1.44B | 107M |
| EBITDA | 451M | -3.4M |
| EBIT | 185M | -7.5M |
| Net Income | 208M | -8.8M |
| EPS | 1.87 | -0.37 |
| Fiscal Year | 2024 | 2024 |
Income Statement Interpretations
Tower Semiconductor Ltd.
Tower Semiconductor’s revenues grew modestly by 0.94% in 2024, reaching $1.44B, with net income declining sharply by 60.3% to $208M. Gross and net margins remain favorable at 23.64% and 14.47%, respectively, but margins contracted compared to prior years. The recent year reflected slower growth and margin compression despite positive overall trends since 2020.
CEVA, Inc.
CEVA posted a 9.77% revenue increase to $107M in 2024, improving from previous years, while net losses narrowed to $8.8M. The company’s gross margin is very strong at 88.06%, but EBIT and net margins remain negative at -7.06% and -8.22%. Recent improvements in profitability metrics show progress, though the overall net income trend since 2020 has been negative.
Which one has the stronger fundamentals?
Tower Semiconductor exhibits stronger fundamentals with consistent positive net income growth and favorable margins, despite recent margin pressures and slower revenue growth. CEVA demonstrates robust gross margins and recent operational improvements but continues to face net losses and negative margins over the period. Both companies have favorable income statement evaluations, yet Tower’s sustained profitability offers a more solid fundamental base.
Financial Ratios Comparison
The table below presents a side-by-side comparison of key financial ratios for Tower Semiconductor Ltd. (TSEM) and CEVA, Inc. (CEVA) based on their most recent fiscal year data, providing insight into their financial performance and stability.
| Ratios | Tower Semiconductor Ltd. (TSEM) | CEVA, Inc. (CEVA) |
|---|---|---|
| ROE | 7.83% | -3.30% |
| ROIC | 6.41% | -2.68% |
| P/E | 27.5 | -84.8 |
| P/B | 2.16 | 2.79 |
| Current Ratio | 6.18 | 7.09 |
| Quick Ratio | 5.23 | 7.09 |
| D/E | 0.068 | 0.021 |
| Debt-to-Assets | 5.87% | 1.80% |
| Interest Coverage | 32.64 | 0 |
| Asset Turnover | 0.47 | 0.35 |
| Fixed Asset Turnover | 1.11 | 8.43 |
| Payout ratio | 0 | 0 |
| Dividend yield | 0 | 0 |
Interpretation of the Ratios
Tower Semiconductor Ltd.
Tower Semiconductor shows a mix of strong and weak ratios. The net margin is favorable at 14.47%, but return on equity is relatively low at 7.83%, which is unfavorable. The high current ratio of 6.18 may indicate inefficient asset use. The company does not pay dividends, likely reinvesting earnings to support growth and operational needs.
CEVA, Inc.
CEVA’s financial ratios reflect challenges, with a negative net margin of -8.22% and unfavorable returns on equity and invested capital. The zero interest coverage ratio is a concern, despite a strong fixed asset turnover of 8.43. CEVA does not distribute dividends, consistent with its negative earnings and focus on R&D and technology licensing.
Which one has the best ratios?
Tower Semiconductor presents a slightly favorable overall ratio profile, balancing profitability and conservative leverage, despite some inefficiencies. CEVA’s ratios are predominantly unfavorable, reflecting operational and profitability struggles. Based on these metrics alone, Tower Semiconductor appears to have the stronger financial ratio standing in 2024.
Strategic Positioning
This section compares the strategic positioning of Tower Semiconductor Ltd. and CEVA, Inc., including market position, key segments, and exposure to technological disruption:
Tower Semiconductor Ltd.
- Independent foundry with global presence in analog mixed-signal semiconductors, facing competitive pressure in semiconductor manufacturing.
- Serves diverse markets: consumer electronics, automotive, industrial, aerospace, and medical devices, driven by customizable process technologies.
- Exposed to semiconductor fabrication technology changes; offers advanced processes like SiGe, BiCMOS, RF CMOS, and MEMS to adapt.
CEVA, Inc.
- Licensor of wireless connectivity and smart sensing IP, competing in digital signal processor markets.
- Focuses on licensing DSP cores and AI processors for mobile, IoT, automotive, and industrial segments.
- Faces disruption from rapid evolution in wireless and AI processing technologies requiring constant innovation.
Tower Semiconductor Ltd. vs CEVA, Inc. Positioning
Tower Semiconductor adopts a diversified manufacturing model across multiple industries, leveraging analog and mixed-signal technologies. CEVA concentrates on licensing digital signal processors and AI platforms, mainly in wireless and sensing. Tower’s broad market exposure contrasts with CEVA’s focused IP licensing, each with distinct operational scopes and innovation challenges.
Which has the best competitive advantage?
Both companies are currently shedding value relative to their costs of capital. Tower Semiconductor shows improving profitability with a slightly unfavorable moat, while CEVA experiences declining profitability and a very unfavorable moat, indicating Tower may have a comparatively stronger competitive advantage.
Stock Comparison
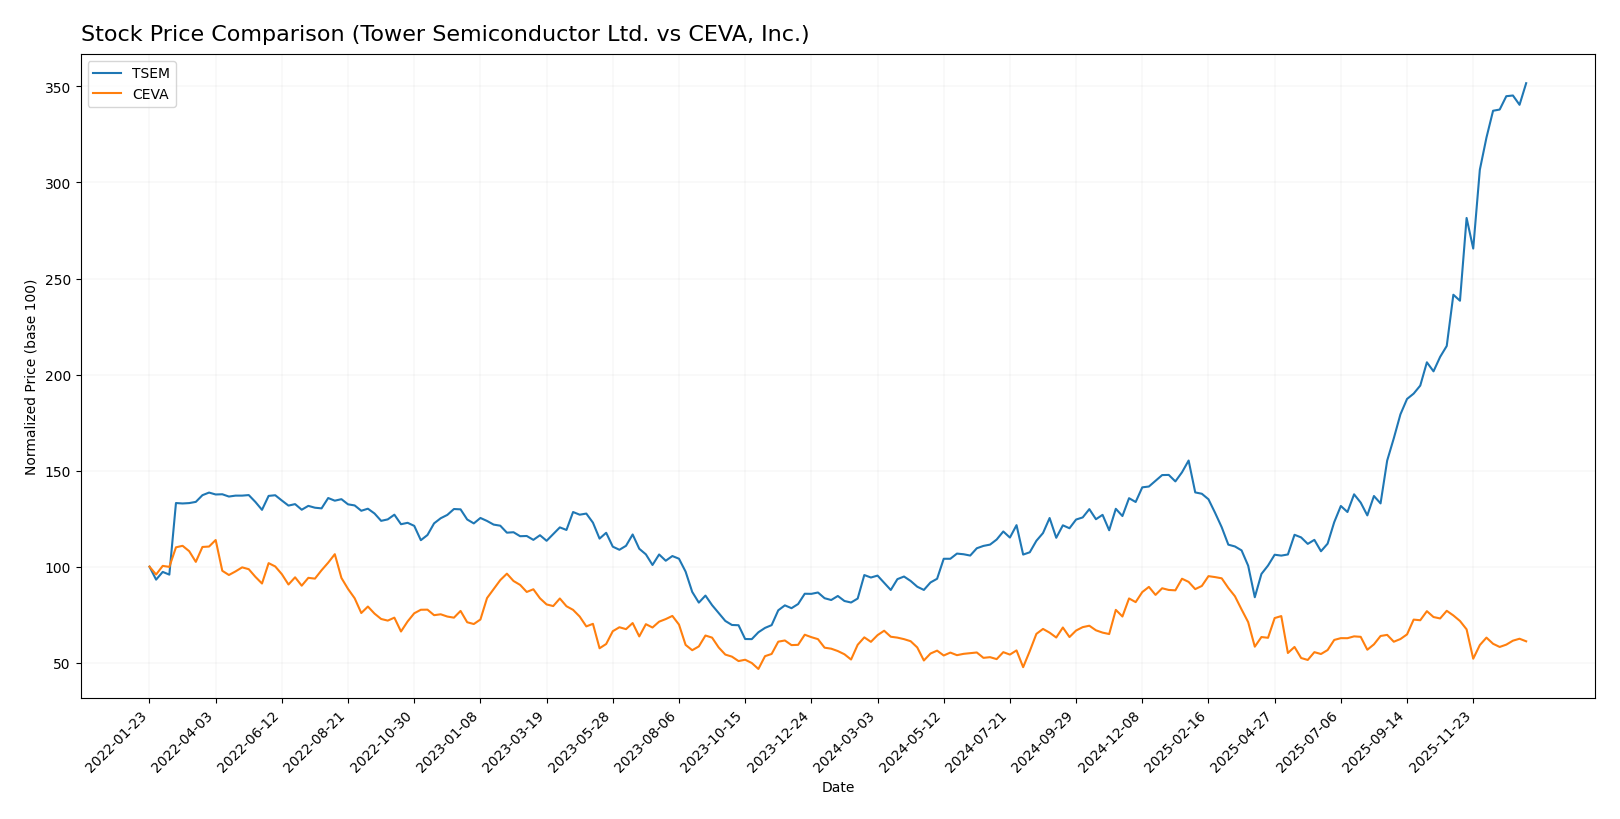
The past year has seen Tower Semiconductor Ltd. (TSEM) exhibit a pronounced bullish momentum with accelerating gains, while CEVA, Inc. (CEVA) has maintained a nearly flat overall price with recent signs of deceleration and slight decline.
Trend Analysis
Tower Semiconductor Ltd. shows a strong bullish trend over the past 12 months with a 272.71% price increase and accelerating momentum, reaching a high of 124.0. Volatility is elevated with a 23.67 standard deviation.
CEVA, Inc. experienced a neutral overall trend with a 0.45% gain but shows deceleration and a recent 18.04% decline, with lower volatility at 4.4 standard deviation and a recent negative slope.
Comparing the two, Tower Semiconductor Ltd. delivered the highest market performance, significantly outperforming CEVA, Inc. in price appreciation and momentum.
Target Prices
Analysts present a clear target consensus for Tower Semiconductor Ltd. and CEVA, Inc.
| Company | Target High | Target Low | Consensus |
|---|---|---|---|
| Tower Semiconductor Ltd. | 125 | 66 | 96 |
| CEVA, Inc. | 28 | 28 | 28 |
Tower Semiconductor’s consensus target price of 96 is slightly below its current price of 124, indicating cautious optimism. CEVA’s consensus target of 28 suggests a potential upside from its current 22.3, reflecting moderate growth expectations.
Analyst Opinions Comparison
This section compares analysts’ ratings and grades for Tower Semiconductor Ltd. and CEVA, Inc.:
Rating Comparison
TSEM Rating
- Rating: B+, considered very favorable.
- Discounted Cash Flow Score: Moderate at 3, indicating balanced valuation expectations.
- ROE Score: Moderate at 3, showing decent efficiency in generating profit from equity.
- ROA Score: Favorable at 4, reflecting effective use of assets to generate earnings.
- Debt To Equity Score: Favorable at 4, implying a strong balance sheet with manageable debt.
- Overall Score: Moderate at 3, summarizing the company’s financial standing as balanced.
CEVA Rating
- Rating: C+, also considered very favorable.
- Discounted Cash Flow Score: Moderate at 3, indicating balanced valuation expectations.
- ROE Score: Very unfavorable at 1, suggesting low profitability from shareholders’ equity.
- ROA Score: Very unfavorable at 1, indicating poor asset utilization.
- Debt To Equity Score: Favorable at 4, indicating strong financial stability.
- Overall Score: Moderate at 2, reflecting a weaker overall financial position than TSEM.
Which one is the best rated?
Based on the data, Tower Semiconductor Ltd. holds a higher overall rating (B+) and better scores in ROE and ROA compared to CEVA, Inc., which has a lower rating (C+) and weaker profitability metrics. Both have favorable debt-to-equity scores.
Scores Comparison
Here is a comparison of the Altman Z-Score and Piotroski Score for Tower Semiconductor Ltd. and CEVA, Inc.:
TSEM Scores
- Altman Z-Score: 21.06, well within the safe zone, indicating strong financial stability.
- Piotroski Score: 7, classified as strong, reflecting good financial strength.
CEVA Scores
- Altman Z-Score: 9.99, also in the safe zone, showing solid financial health.
- Piotroski Score: 4, rated average, indicating moderate financial strength.
Which company has the best scores?
Tower Semiconductor Ltd. has higher scores in both categories: a significantly higher Altman Z-Score and a stronger Piotroski Score, suggesting more robust financial health compared to CEVA, Inc. based on the provided data.
Grades Comparison
The grades provided by recognized grading companies for Tower Semiconductor Ltd. and CEVA, Inc. are as follows:
Tower Semiconductor Ltd. Grades
The table below summarizes recent grades from reputable grading firms for Tower Semiconductor Ltd.:
| Grading Company | Action | New Grade | Date |
|---|---|---|---|
| Benchmark | Maintain | Buy | 2026-01-09 |
| Wedbush | Downgrade | Neutral | 2025-12-31 |
| Benchmark | Maintain | Buy | 2025-11-11 |
| Susquehanna | Maintain | Positive | 2025-11-11 |
| Wedbush | Maintain | Outperform | 2025-11-11 |
| Barclays | Maintain | Equal Weight | 2025-11-11 |
| Benchmark | Maintain | Buy | 2025-09-08 |
| Susquehanna | Maintain | Positive | 2025-08-05 |
| Benchmark | Maintain | Buy | 2025-08-05 |
| Benchmark | Maintain | Buy | 2025-08-04 |
The overall trend for Tower Semiconductor Ltd. shows predominantly positive grades, with multiple “Buy” and “Positive” ratings, though one downgrade to “Neutral” was noted.
CEVA, Inc. Grades
The table below summarizes recent grades from reputable grading firms for CEVA, Inc.:
| Grading Company | Action | New Grade | Date |
|---|---|---|---|
| Barclays | Maintain | Overweight | 2025-11-12 |
| Rosenblatt | Maintain | Buy | 2025-11-11 |
| Rosenblatt | Maintain | Buy | 2025-08-14 |
| Oppenheimer | Maintain | Outperform | 2025-05-09 |
| Rosenblatt | Maintain | Buy | 2025-05-08 |
| Barclays | Maintain | Overweight | 2025-05-08 |
| Rosenblatt | Maintain | Buy | 2025-04-23 |
| Barclays | Maintain | Overweight | 2025-02-14 |
| Rosenblatt | Maintain | Buy | 2025-02-14 |
| Rosenblatt | Maintain | Buy | 2025-02-11 |
CEVA, Inc. consistently received “Buy,” “Overweight,” and “Outperform” ratings with no downgrades during the period.
Which company has the best grades?
Both companies hold a consensus “Buy” rating, but CEVA, Inc. has a stronger pattern of positive grades, consistently rated “Buy” or better by multiple firms. Tower Semiconductor Ltd.’s grades include some mixed signals, such as a downgrade to “Neutral.” This suggests CEVA’s grades may reflect more robust analyst confidence, potentially influencing investor perception of relative stability and growth prospects.
Strengths and Weaknesses
Below is a comparison table highlighting the key strengths and weaknesses of Tower Semiconductor Ltd. (TSEM) and CEVA, Inc. based on the most recent financial and strategic data.
| Criterion | Tower Semiconductor Ltd. (TSEM) | CEVA, Inc. |
|---|---|---|
| Diversification | Moderate; focus on semiconductor foundry | Moderate; revenue mainly from licensing & royalties |
| Profitability | Positive net margin (14.47%), improving ROIC | Negative net margin (-8.22%), declining ROIC |
| Innovation | Growing ROIC trend suggests improving efficiency | Declining ROIC indicates challenges in innovation |
| Global presence | Established global foundry operations | Global licensing footprint, tech focus |
| Market Share | Stable niche in specialty semiconductor foundry | Smaller share, highly competitive IP licensing |
Key takeaways: Tower Semiconductor shows improving profitability with a slightly unfavorable moat but solid financial ratios, suggesting cautious optimism. CEVA struggles with declining profitability and a very unfavorable moat, indicating higher investment risk despite a favorable price-to-earnings ratio. Risk management favors TSEM for more stable value creation.
Risk Analysis
Below is a comparative table of key risks for Tower Semiconductor Ltd. (TSEM) and CEVA, Inc. based on the most recent 2024 data.
| Metric | Tower Semiconductor Ltd. (TSEM) | CEVA, Inc. (CEVA) |
|---|---|---|
| Market Risk | Moderate (Beta 0.876) | High (Beta 1.436) |
| Debt Level | Low (Debt/Equity 0.07) | Very Low (Debt/Equity 0.02) |
| Regulatory Risk | Moderate (Global semiconductor regulations) | Moderate (Licensing and IP regulations) |
| Operational Risk | Moderate (Complex manufacturing) | High (Dependency on licensing contracts) |
| Environmental Risk | Moderate (Manufacturing impact) | Low (Software licensing model) |
| Geopolitical Risk | Moderate (Exposure to Asia, Israel) | Moderate (US-based, global clients) |
Tower Semiconductor faces moderate market and geopolitical risks due to its manufacturing footprint and industry exposure but benefits from strong balance sheet health. CEVA’s higher market risk combined with operational dependency on licensing agreements poses more significant volatility and financial challenges. Investors should weigh CEVA’s higher risk against its growth potential carefully.
Which Stock to Choose?
Tower Semiconductor Ltd. (TSEM) shows a favorable overall income statement with strong gross and net margins but recent declines in revenue and earnings growth. Its financial ratios are slightly favorable, supported by low debt levels and strong interest coverage, despite some unfavorable valuation and liquidity metrics. The company’s rating is very favorable (B+), with solid Altman Z and Piotroski scores, though its MOAT evaluation signals slight value destruction amid rising profitability.
CEVA, Inc. (CEVA) presents a mixed income profile with a very high gross margin but negative EBIT and net margins. Its financial ratios are globally unfavorable due to persistent losses and weak returns, despite low debt and a favorable fixed asset turnover. The company holds a very favorable rating (C+), but lower profitability scores and a very unfavorable MOAT reflect ongoing value erosion and declining returns. Price trends show recent deceleration and negative momentum.
Considering these factors, TSEM might appear more suitable for investors seeking established profitability and moderate growth potential, while CEVA could be interpreted as fitting for those with a tolerance for higher risk and focus on turnaround opportunities. The final interpretation depends on individual risk profiles and investment strategies.
Disclaimer: Investment carries a risk of loss of initial capital. The past performance is not a reliable indicator of future results. Be sure to understand risks before making an investment decision.
Go Further
I encourage you to read the complete analyses of Tower Semiconductor Ltd. and CEVA, Inc. to enhance your investment decisions: