Home > Comparison > Technology > TER vs CEVA
The strategic rivalry between Teradyne, Inc. and CEVA, Inc. defines the current trajectory of the semiconductor industry. Teradyne operates as a capital-intensive manufacturer of automated test equipment, while CEVA licenses high-margin wireless connectivity and AI processor technologies. This head-to-head pits manufacturing scale against intellectual property innovation. This analysis will determine which corporate model offers a superior risk-adjusted return for diversified portfolios navigating evolving tech cycles.
Table of contents
Companies Overview
Teradyne and CEVA stand as key players in the semiconductor technology landscape, each shaping innovation distinctly.
Teradyne, Inc.: Leader in Automated Test Solutions
Teradyne dominates the automated test equipment sector, generating revenue through testing platforms for semiconductors, wireless devices, and industrial robotics. Its 2026 strategy emphasizes expanding its Industrial Automation segment, leveraging collaborative robots and autonomous systems to capture manufacturing efficiencies. Teradyne’s broad portfolio supports diverse end markets from automotive to cloud computing, reinforcing its competitive edge.
CEVA, Inc.: Specialist in Wireless Connectivity IP
CEVA focuses on licensing digital signal processing and AI technologies to semiconductor and OEM companies globally. It earns by licensing DSP cores and AI processors for 5G, IoT, and smart sensing applications. In 2026, CEVA prioritizes advancing AI-enabled platforms and expanding its footprint in wireless IoT standards, targeting growth in consumer electronics, automotive, and industrial sectors with its licensable IP solutions.
Strategic Collision: Similarities & Divergences
Teradyne and CEVA diverge markedly in business models—Teradyne sells hardware-driven test systems, while CEVA licenses semiconductor IP. Both compete indirectly in the 5G and IoT ecosystem, but Teradyne’s strength lies in physical test platforms, whereas CEVA leads in embedded connectivity software. Their investment profiles reflect this: Teradyne offers scale and diversified industrial exposure, CEVA provides niche tech innovation with a leaner structure.
Income Statement Comparison
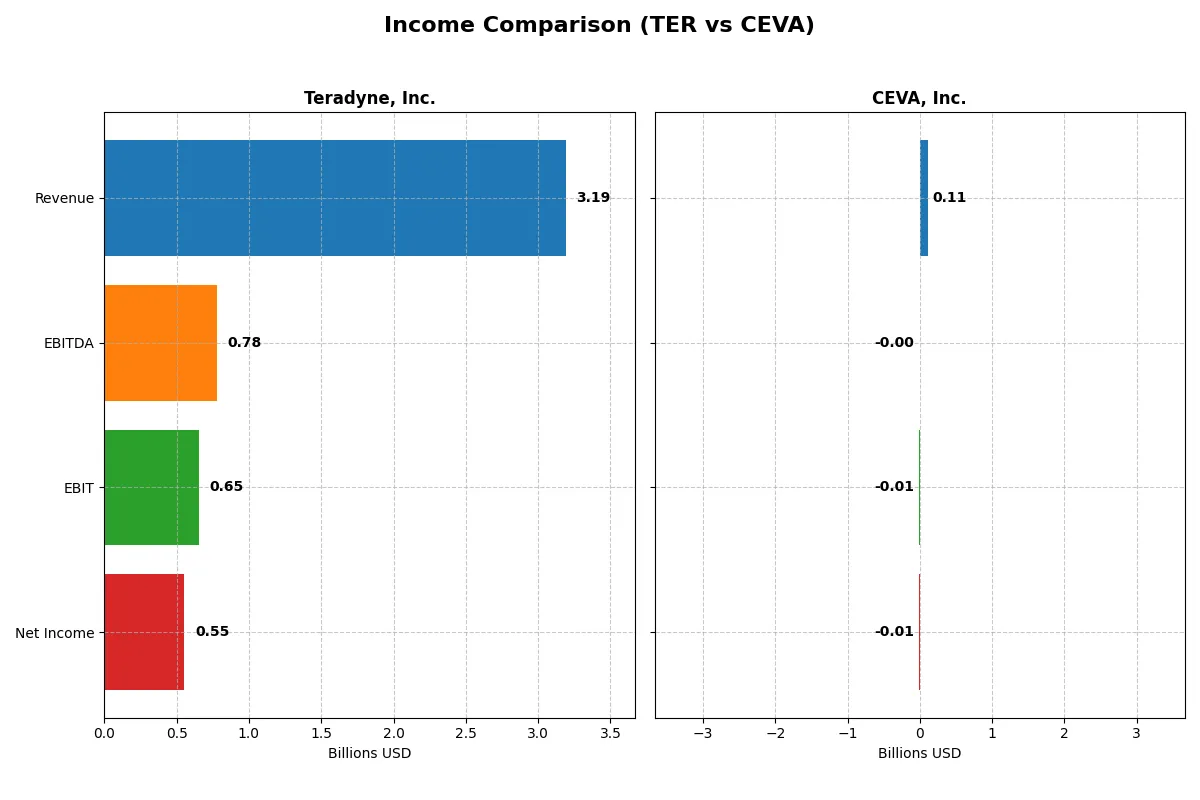
This data dissects the core profitability and scalability of both corporate engines to reveal who dominates the bottom line:
| Metric | Teradyne, Inc. (TER) | CEVA, Inc. (CEVA) |
|---|---|---|
| Revenue | 3.19B | 107M |
| Cost of Revenue | 1.32B | 13M |
| Operating Expenses | 1.17B | 102M |
| Gross Profit | 1.87B | 94M |
| EBITDA | 780M | -3.4M |
| EBIT | 653M | -7.5M |
| Interest Expense | 8.0M | 0 |
| Net Income | 554M | -8.8M |
| EPS | 3.49 | -0.37 |
| Fiscal Year | 2025 | 2024 |
Income Statement Analysis: The Bottom-Line Duel
This income statement comparison reveals which company runs a more efficient and profitable corporate engine.
Teradyne, Inc. Analysis
Teradyne’s revenue shows a mixed trend, peaking at 3.7B in 2021 before dipping to 3.19B in 2025. Net income follows suit, peaking at 1.01B in 2021 but settling at 554M in 2025. Gross margin remains strong at 58.55%, while net margin holds a healthy 17.37%. The company’s 2025 momentum reflects efficient cost control and solid operating income of 693M.
CEVA, Inc. Analysis
CEVA’s revenue grows steadily from 100M in 2020 to 107M in 2024. Despite this, net income remains negative, though losses shrink from -23M in 2022 to -8.8M in 2024. Gross margin impresses at 88.06%, but negative EBIT (-7.06%) and net margins (-8.22%) signal ongoing profitability challenges. The 2024 figures show improving operational efficiency but no bottom-line profits yet.
Profitability Strength vs. Growth Struggles
Teradyne dominates with profitable scale and solid margins, while CEVA improves revenues but remains unprofitable. Teradyne’s consistent positive net income and margin stability make it the clear fundamental winner. Investors seeking proven profitability will find Teradyne’s profile more attractive than CEVA’s still-recovering earnings trajectory.
Financial Ratios Comparison
These vital ratios act as a diagnostic tool to expose the underlying fiscal health, valuation premiums, and capital efficiency of these companies:
| Ratios | Teradyne, Inc. (TER) | CEVA, Inc. (CEVA) |
|---|---|---|
| ROE | 19.8% | -3.3% |
| ROIC | 18.4% | -2.7% |
| P/E | 54.6 | -84.8 |
| P/B | 10.8 | 2.8 |
| Current Ratio | 1.76 | 7.09 |
| Quick Ratio | 1.41 | 7.09 |
| D/E | 0.12 | 0.02 |
| Debt-to-Assets | 8.3% | 1.8% |
| Interest Coverage | 86.4 | 0 |
| Asset Turnover | 0.76 | 0.35 |
| Fixed Asset Turnover | 5.0 | 8.4 |
| Payout Ratio | 13.8% | 0 |
| Dividend Yield | 0.25% | 0 |
| Fiscal Year | 2025 | 2024 |
Efficiency & Valuation Duel: The Vital Signs
Financial ratios serve as a company’s DNA, exposing hidden risks and operational strengths essential for savvy investment decisions.
Teradyne, Inc.
Teradyne delivers strong profitability with a 19.82% ROE and a healthy 17.37% net margin, signaling operational efficiency. Its valuation appears stretched, trading at a high 54.64 P/E and 10.83 P/B ratios. Shareholders receive modest dividends (0.25% yield), while the company reinvests heavily in R&D to fuel growth and innovation.
CEVA, Inc.
CEVA struggles with negative profitability, posting a -3.3% ROE and -8.22% net margin, reflecting operational challenges. Despite this, its valuation looks attractive with a negative P/E and a reasonable 2.79 P/B. The company pays no dividends, instead directing capital towards R&D to reverse its losses and support future growth.
Premium Valuation vs. Operational Struggles
Teradyne offers robust profitability and solid capital allocation, though at a premium valuation. CEVA faces clear profitability headwinds and weaker financial health but trades at a discount. Investors seeking operational safety may favor Teradyne, while those drawn to turnaround potential might consider CEVA’s riskier profile.
Which one offers the Superior Shareholder Reward?
I see Teradyne, Inc. (TER) pays dividends with a modest 0.38% yield and a sustainable 14% payout ratio backed by solid free cash flow. TER also executes steady buybacks, enhancing total return. CEVA, Inc. (CEVA) pays no dividend, retains cash, and invests heavily in R&D and growth, but posts losses and weak cash flow coverage. CEVA’s buybacks are negligible. Historically, dividend-supported returns combined with buybacks have outperformed in semis during market cycles. I conclude TER offers a superior total return profile in 2026 given its balanced distribution and financial strength.
Comparative Score Analysis: The Strategic Profile
The radar chart reveals the fundamental DNA and trade-offs of Teradyne, Inc. and CEVA, Inc., highlighting their contrasting financial strengths and vulnerabilities:
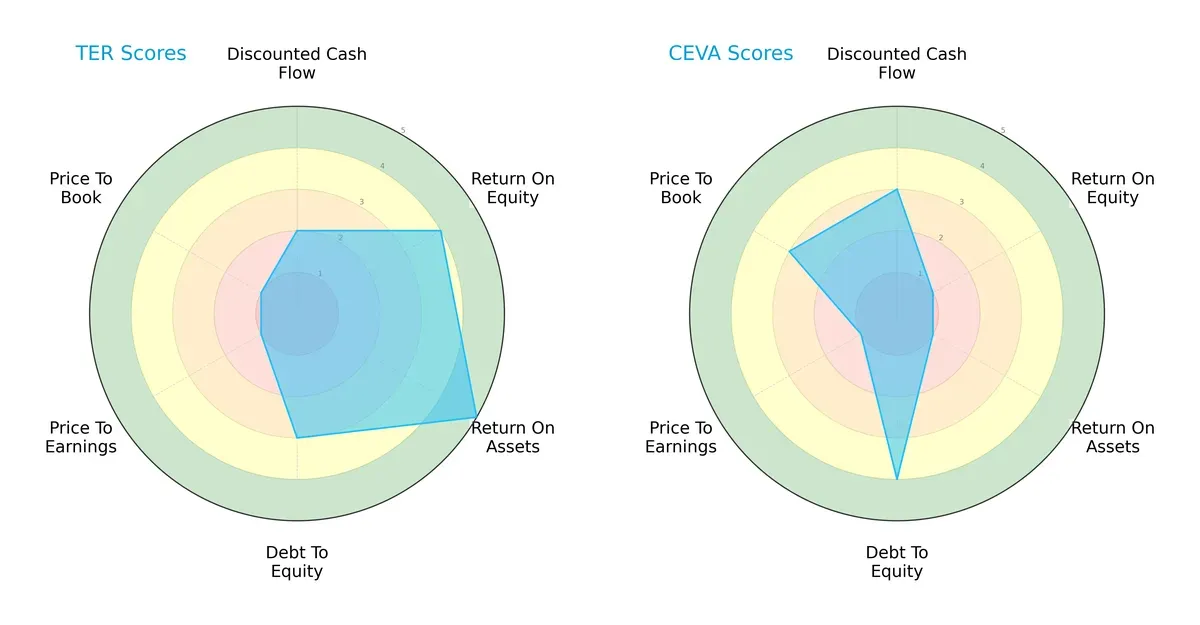
Teradyne delivers a more balanced profile with strong ROE (4) and ROA (5), moderate debt-to-equity (3), but poor valuation metrics (PE and PB both 1). CEVA relies on a favorable debt-to-equity score (4) and moderate DCF (3) but suffers from weak profitability (ROE 1, ROA 1) and undervaluation signals. Teradyne’s diversified strengths suggest operational efficiency, while CEVA’s profile points to financial conservatism but limited profit generation.
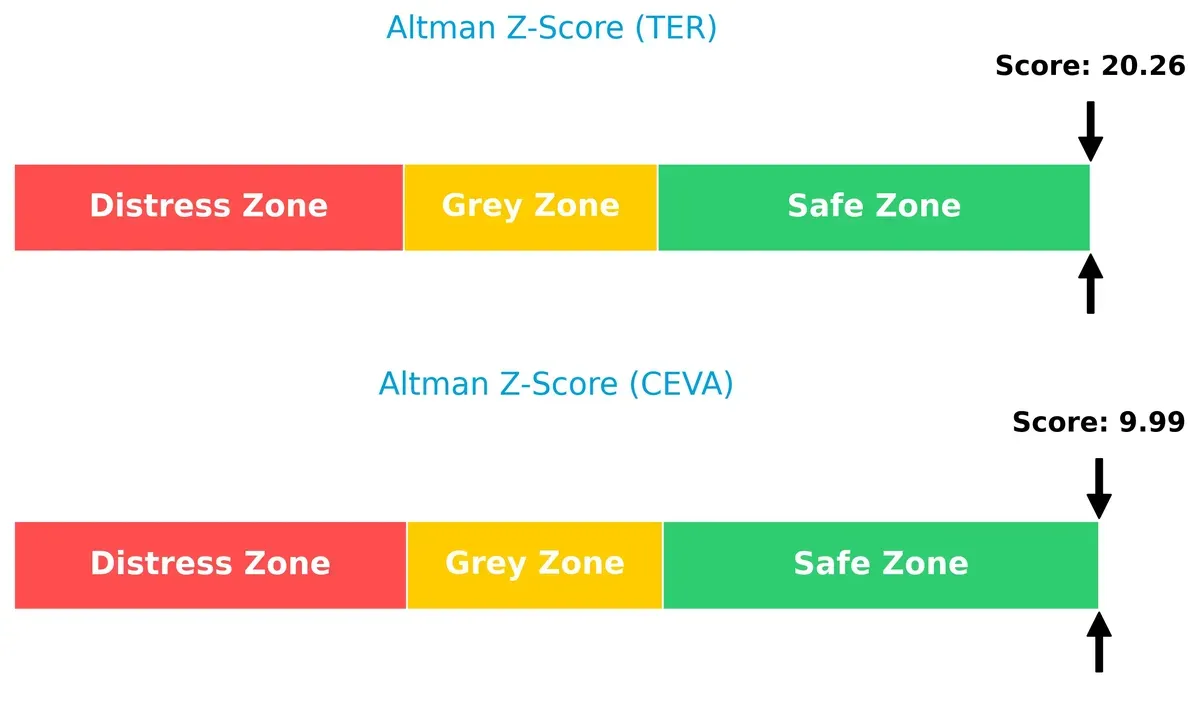
Bankruptcy Risk: Solvency Showdown
Teradyne’s Altman Z-Score (20.3) far exceeds CEVA’s (10.0), placing both safely above distress but indicating Teradyne’s superior resilience in this economic cycle:
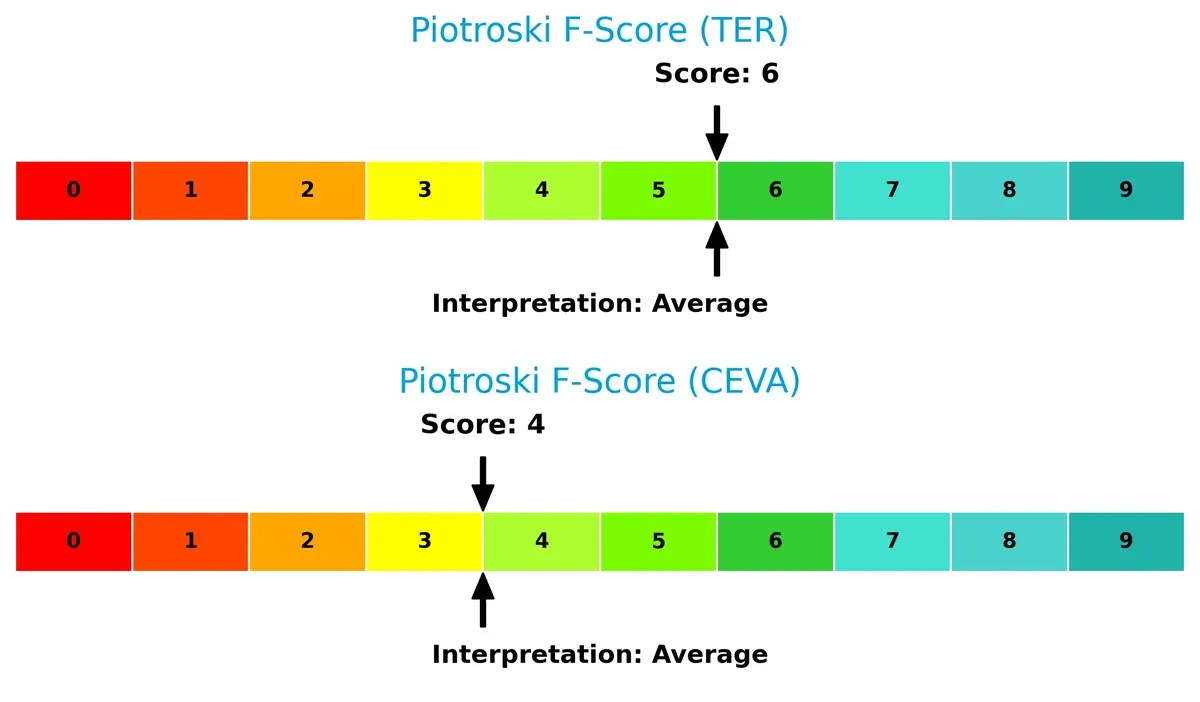
Financial Health: Quality of Operations
Teradyne scores a healthier Piotroski F-Score (6) versus CEVA’s (4), signaling stronger internal financial controls and fewer red flags:
How are the two companies positioned?
This section dissects the operational DNA of Teradyne and CEVA by comparing their revenue distribution across segments and analyzing their internal strengths and weaknesses. The goal is to confront their economic moats and identify which model delivers the most resilient, sustainable competitive advantage today.
Revenue Segmentation: The Strategic Mix
This visual comparison dissects how Teradyne, Inc. and CEVA, Inc. diversify their income streams and where their primary sector bets lie:
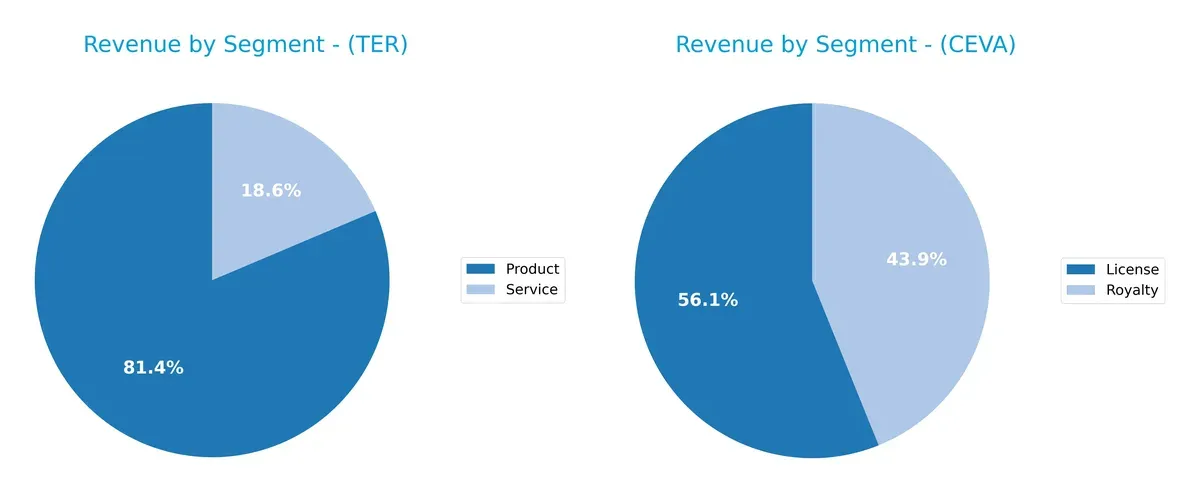
Teradyne anchors revenue heavily in Product sales, generating $2.3B in 2024, dwarfing its Service segment at $525M. This signals a strong focus on hardware solutions with moderate service support. CEVA shows a more balanced mix between License ($60M) and Royalty ($47M) revenues, highlighting diversification through intellectual property monetization. Teradyne’s concentrated Product dominance implies infrastructure strength but introduces concentration risk. CEVA’s mix suggests ecosystem lock-in via licensing and royalties.
Strengths and Weaknesses Comparison
This table compares the strengths and weaknesses of Teradyne, Inc. and CEVA, Inc.:
TER Strengths
- Robust profitability with 17.37% net margin and 19.82% ROE
- Strong balance sheet with low debt to assets at 8.32%
- Favorable liquidity ratios: current ratio 1.76 and quick ratio 1.41
- Diverse global presence across Asia, US, and Europe
- Solid innovation shown by consistent product revenue exceeding $2.2B
CEVA Strengths
- Very low debt to assets at 1.8% and debt equity ratio 0.02
- Favorable quick ratio of 7.09 indicating liquidity
- High fixed asset turnover at 8.43 reflecting efficient asset use
- Focused product segmentation in licensing and royalties with steady revenue streams
- Presence in Asia Pacific and US markets
TER Weaknesses
- High valuation multiples: PE 54.64 and PB 10.83 suggest overvaluation risk
- WACC at 12.29% exceeds ROIC, indicating potential capital inefficiency
- Dividend yield low at 0.25%, limiting income appeal
- Neutral asset turnover at 0.76 could constrain growth
CEVA Weaknesses
- Negative profitability metrics: net margin -8.22%, ROE -3.3%, ROIC -2.68%
- Poor interest coverage at zero signals financial risk
- Unfavorable asset turnover at 0.35 limits revenue generation
- Unfavorable current ratio at 7.09 flagged as liquidity risk despite quick ratio
- Lack of dividend yield
Despite TER’s strong profitability and global diversification, high valuation and capital cost caution investors. CEVA’s low debt and asset efficiency contrast with weak profitability and financial risks, highlighting challenges in operational performance and liquidity management.
The Moat Duel: Analyzing Competitive Defensibility
A structural moat protects long-term profits from relentless competition and market pressures. Without it, profits erode quickly. Let’s dissect these moats:
Teradyne, Inc.: Diversified Testing and Automation Moat
Teradyne’s moat lies in its broad portfolio—semiconductor testing, industrial automation, and wireless test platforms. This diversity sustains 6% ROIC above WACC despite a declining trend. Expansion into robotics and 5G testing could deepen its competitive edge in 2026.
CEVA, Inc.: IP Licensing and DSP Technology Moat
CEVA’s moat centers on licensing advanced DSP and AI processors, unlike Teradyne’s product-heavy model. However, it sheds value with ROIC well below WACC and steeply declining profitability. Growth in AI and 5G IP licensing offers potential but remains uncertain in 2026.
Market Defense: Product Diversification vs. Licensing Vulnerability
Teradyne’s wider moat is evident in consistent value creation across multiple segments. CEVA’s narrow, licensing-dependent moat faces profitability challenges and higher risk. Teradyne stands better equipped to defend and grow market share amid intensifying semiconductor innovation.
Which stock offers better returns?
The past year shows stark divergence in stock price performance and trading dynamics between Teradyne, Inc. and CEVA, Inc., highlighting contrasting momentum and investor sentiment.
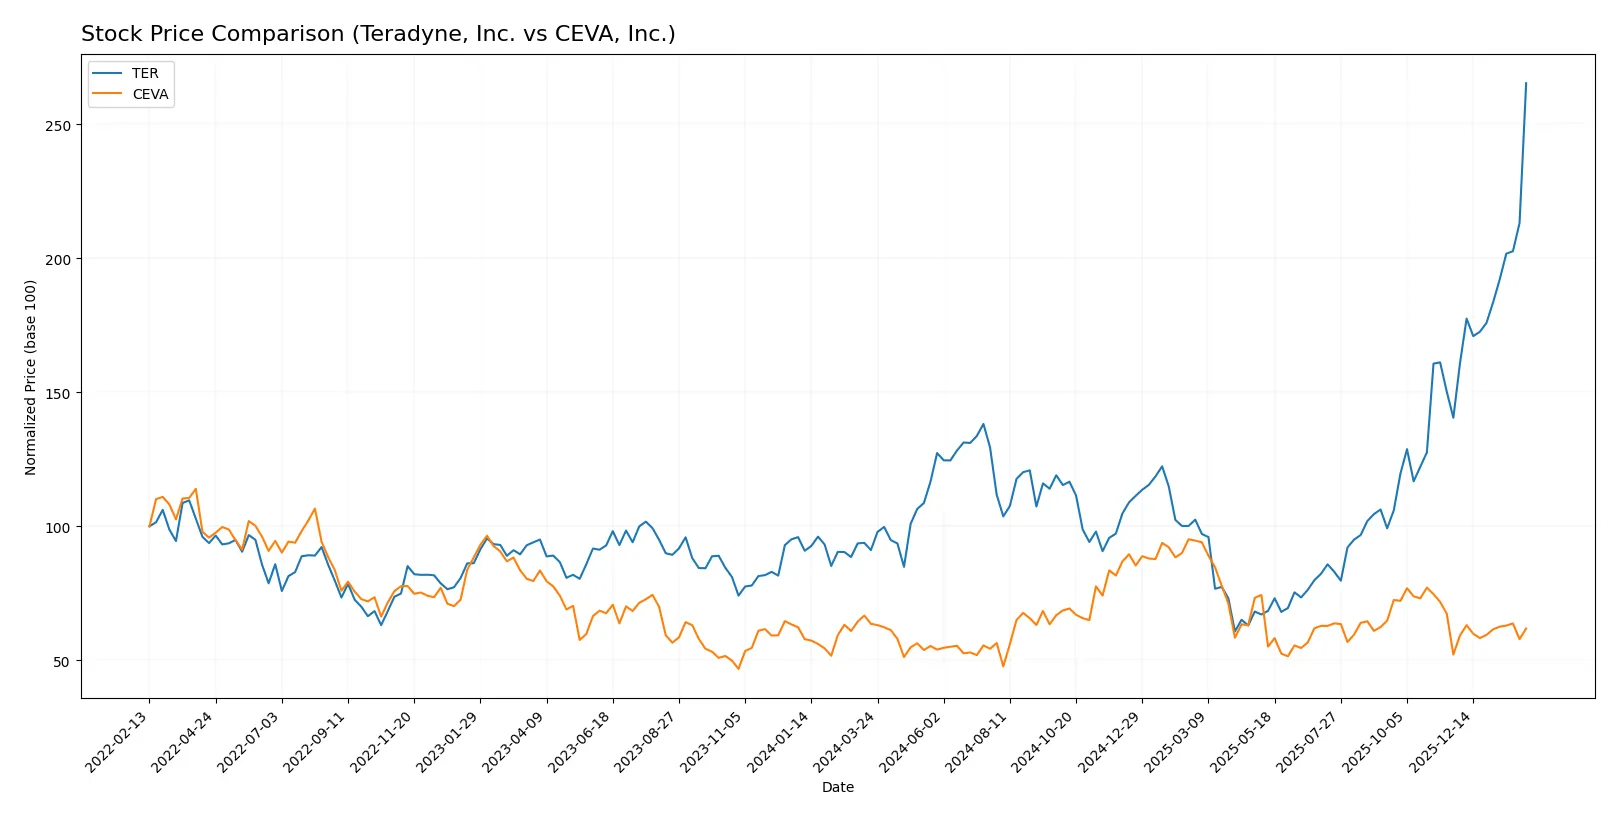
Trend Comparison
Teradyne, Inc. exhibits a strong bullish trend with a 191.2% price increase over the past 12 months, marked by acceleration and a high volatility of 40.42. It reached a peak price of 300.11 and a low of 68.72.
CEVA, Inc. shows a bearish trend over the year, declining 2.72%, despite recent acceleration. It has low volatility at 4.41, with a high of 34.67 and a low of 17.39.
Teradyne’s substantial price appreciation surpasses CEVA’s slight decline, delivering the highest market performance in this comparison.
Target Prices
Analysts present a solid target price consensus for Teradyne, Inc. and CEVA, Inc., reflecting confidence in their growth prospects.
| Company | Target Low | Target High | Consensus |
|---|---|---|---|
| Teradyne, Inc. | 175 | 335 | 276.08 |
| CEVA, Inc. | 28 | 28 | 28 |
Teradyne’s target consensus of 276.08 sits slightly below its current 300.11 price, suggesting modest downside risk. CEVA’s consensus target of 28 significantly exceeds its current 22.54 price, indicating strong analyst optimism.

Don’t Let Luck Decide Your Entry Point
Optimize your entry points with our advanced ProRealTime indicators. You’ll get efficient buy signals with precise price targets for maximum performance. Start outperforming now!
How do institutions grade them?
Teradyne, Inc. Grades
The following table shows recent grade actions from leading financial institutions on Teradyne, Inc.:
| Grading Company | Action | New Grade | Date |
|---|---|---|---|
| Goldman Sachs | Maintain | Buy | 2026-02-04 |
| Citigroup | Maintain | Buy | 2026-02-04 |
| Cantor Fitzgerald | Maintain | Overweight | 2026-02-04 |
| Evercore ISI Group | Maintain | Outperform | 2026-02-04 |
| Stifel | Maintain | Buy | 2026-02-04 |
| Evercore ISI Group | Maintain | Outperform | 2026-02-03 |
| Cantor Fitzgerald | Maintain | Overweight | 2026-02-02 |
| Stifel | Maintain | Buy | 2026-01-30 |
| UBS | Maintain | Buy | 2026-01-26 |
| B of A Securities | Maintain | Buy | 2026-01-22 |
CEVA, Inc. Grades
Below is a summary of recent institutional grade actions on CEVA, Inc.:
| Grading Company | Action | New Grade | Date |
|---|---|---|---|
| Barclays | Maintain | Overweight | 2025-11-12 |
| Rosenblatt | Maintain | Buy | 2025-11-11 |
| Rosenblatt | Maintain | Buy | 2025-08-14 |
| Oppenheimer | Maintain | Outperform | 2025-05-09 |
| Rosenblatt | Maintain | Buy | 2025-05-08 |
| Barclays | Maintain | Overweight | 2025-05-08 |
| Rosenblatt | Maintain | Buy | 2025-04-23 |
| Barclays | Maintain | Overweight | 2025-02-14 |
| Rosenblatt | Maintain | Buy | 2025-02-14 |
| Rosenblatt | Maintain | Buy | 2025-02-11 |
Which company has the best grades?
Teradyne, Inc. consistently receives “Buy” and equivalent top-tier grades from major firms, indicating strong analyst confidence. CEVA, Inc. also has positive grades but with a slightly older date range and a mix of “Buy” and “Overweight” ratings. Investors may view Teradyne’s more recent and uniformly bullish grades as a stronger signal of institutional sentiment.
Risks specific to each company
The following categories identify the critical pressure points and systemic threats facing both firms in the 2026 market environment:
1. Market & Competition
Teradyne, Inc.
- Dominates semiconductor test equipment with diverse segments, but faces intense competition from integrated device manufacturers and fabless companies.
CEVA, Inc.
- Operates in IP licensing for wireless and AI processors, vulnerable to rapid innovation and competition in semiconductor IP markets.
2. Capital Structure & Debt
Teradyne, Inc.
- Low debt-to-equity (0.12) and strong interest coverage (81.43) indicate solid financial stability and prudent capital allocation.
CEVA, Inc.
- Minimal debt (debt-to-assets 1.8%), but zero interest coverage signals risk in servicing debt and limited financial cushion.
3. Stock Volatility
Teradyne, Inc.
- Beta of 1.82 shows higher-than-market volatility, reflecting cyclical semiconductor sector sensitivity.
CEVA, Inc.
- Beta of 1.50 suggests moderate volatility, but smaller market cap raises susceptibility to swings from market sentiment.
4. Regulatory & Legal
Teradyne, Inc.
- Exposure to global tech regulations; must navigate export controls and IP protection in diverse markets.
CEVA, Inc.
- Licensing model exposes it to potential patent litigation and regulatory scrutiny in wireless standards.
5. Supply Chain & Operations
Teradyne, Inc.
- Complex global supply chains for hardware manufacturing increase risk of disruption and cost inflation.
CEVA, Inc.
- Dependent on licensees’ manufacturing; less direct supply chain risk but reliant on partners’ operational stability.
6. ESG & Climate Transition
Teradyne, Inc.
- Industrial automation focus aligns with energy efficiency trends but faces pressures to reduce manufacturing footprint.
CEVA, Inc.
- Software and IP licensing model has lower direct emissions but must address social governance in global partnerships.
7. Geopolitical Exposure
Teradyne, Inc.
- Significant US-China tensions risk supply chain disruption and market access in key semiconductor regions.
CEVA, Inc.
- Geopolitical risks linked to semiconductor industry concentration, with exposure to US export restrictions impacting licensing revenue.
Which company shows a better risk-adjusted profile?
Teradyne’s primary risk lies in market cyclicality and supply chain complexity, but its strong balance sheet and operational scale provide resilience. CEVA struggles with negative profitability and weak interest coverage, heightening financial risk despite low debt. Teradyne’s safer capital structure and higher Altman Z-Score underscore a superior risk-adjusted profile. The recent positive stock momentum (+10.7% for Teradyne) contrasts CEVA’s operational losses, justifying caution on CEVA’s financial health.
Final Verdict: Which stock to choose?
Teradyne, Inc. stands out as a cash-generating powerhouse with a proven ability to create shareholder value. Its superpower lies in operational efficiency and a strong return on invested capital well above its cost of capital. A point of vigilance is the recent decline in profitability trends, which could signal challenges ahead. Teradyne fits well in an aggressive growth portfolio seeking robust industrial technology exposure.
CEVA, Inc. offers a strategic moat through its niche in semiconductor intellectual property and a high current ratio that cushions liquidity risks. While it lacks Teradyne’s profitability and value creation, CEVA’s recurring revenue potential provides a safer harbor for investors wary of volatility. It aligns with Growth at a Reasonable Price (GARP) portfolios prioritizing turnaround stories with strategic assets.
If you prioritize sustained value creation and operational excellence, Teradyne outshines as the compelling choice due to its superior capital efficiency and market momentum. However, if you seek a speculative growth play with safety nets in liquidity and specialized IP, CEVA offers better stability despite its weaker profitability. Both present distinct analytical scenarios tailored to differing risk appetites and investment horizons.
Disclaimer: Investment carries a risk of loss of initial capital. The past performance is not a reliable indicator of future results. Be sure to understand risks before making an investment decision.
Go Further
I encourage you to read the complete analyses of Teradyne, Inc. and CEVA, Inc. to enhance your investment decisions: