Skyworks Solutions, Inc. (SWKS) and CEVA, Inc. (CEVA) are two key players in the semiconductor industry, each bringing distinct innovation strategies and market focuses. Skyworks designs and manufactures a wide range of proprietary semiconductor products, while CEVA specializes in licensing advanced wireless connectivity and smart sensing technologies. Their overlapping presence in cutting-edge wireless and IoT markets makes this comparison particularly relevant. In this article, I will help you identify which company offers the best investment potential.
Table of contents
Companies Overview
I will begin the comparison between Skyworks Solutions, Inc. and CEVA, Inc. by providing an overview of these two companies and their main differences.
Skyworks Solutions, Inc. Overview
Skyworks Solutions, Inc. designs, develops, manufactures, and markets proprietary semiconductor products globally. The company serves diverse markets including aerospace, automotive, broadband, cellular infrastructure, and consumer electronics. Headquartered in Irvine, California, Skyworks operates with over 10,000 employees and emphasizes a broad product portfolio spanning amplifiers, filters, and front-end modules, positioning itself strongly within the semiconductor industry.
CEVA, Inc. Overview
CEVA, Inc. licenses wireless connectivity and smart sensing technologies to semiconductor and OEM companies worldwide. Its offerings include digital signal processors, AI processors, and platforms for 5G, IoT, imaging, and voice applications. Based in Rockville, Maryland, CEVA employs around 400 people and focuses on delivering IP solutions and software tools, catering to markets such as mobile, automotive, robotics, and industrial sectors.
Key similarities and differences
Both companies operate in the semiconductor industry and provide technology solutions integral to wireless and smart devices. Skyworks manufactures and sells physical semiconductor products, while CEVA operates primarily as an IP licensor, offering technology platforms and software rather than hardware. Skyworks has a significantly larger workforce and market capitalization, reflecting its broader manufacturing scope compared to CEVA’s specialized licensing model.
Income Statement Comparison
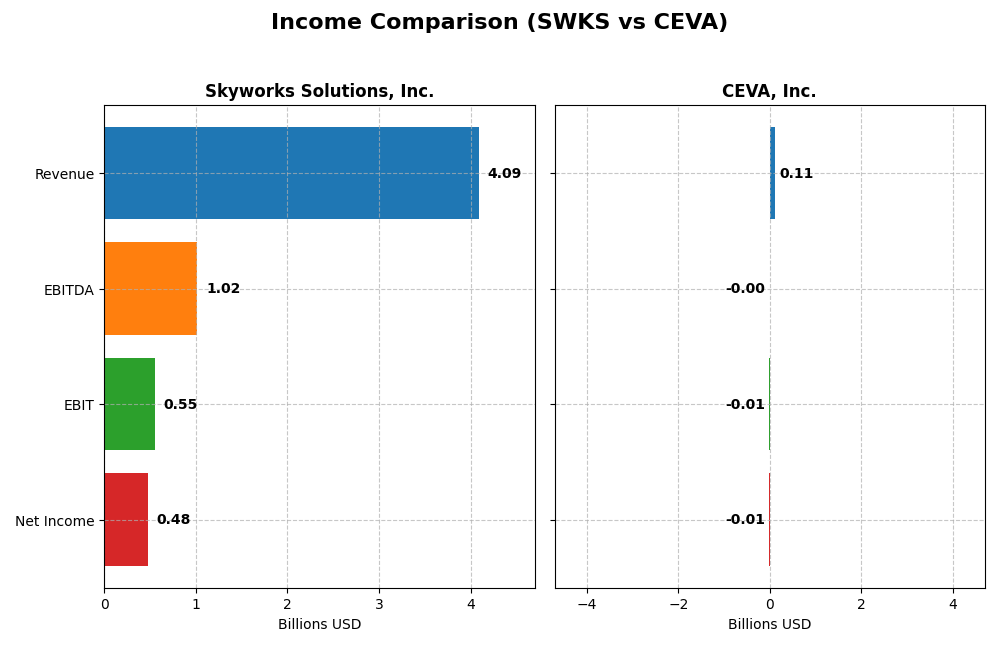
Below is a side-by-side comparison of key income statement metrics for Skyworks Solutions, Inc. and CEVA, Inc. for their most recent fiscal years.
| Metric | Skyworks Solutions, Inc. (2025) | CEVA, Inc. (2024) |
|---|---|---|
| Market Cap | 8.76B | 536M |
| Revenue | 4.09B | 107M |
| EBITDA | 1.02B | -3.41M |
| EBIT | 554M | -7.55M |
| Net Income | 477M | -8.79M |
| EPS | 3.09 | -0.37 |
| Fiscal Year | 2025 | 2024 |
Income Statement Interpretations
Skyworks Solutions, Inc.
Skyworks Solutions experienced a declining trend in revenue and net income from 2021 to 2025, with revenue dropping from $5.1B to $4.1B and net income falling from $1.5B to $477M. Margins showed a favorable gross margin of 41.16% but deteriorating net margin by 18.17% in the latest year. The 2025 fiscal year saw slowed growth and margin contraction, signaling challenges ahead.
CEVA, Inc.
CEVA’s revenue grew modestly by 9.77% in 2024, reaching $107M, but net income remained negative at -$8.8M. The company exhibited an exceptionally high gross margin of 88.06%, yet EBIT and net margins were unfavorable at -7.06% and -8.22%, respectively. Recent improvements in profitability metrics contrast with persistent overall net losses over the period.
Which one has the stronger fundamentals?
Skyworks shows a larger scale and historically positive profitability but faces sustained declines in revenue and net income, with worsening margins. CEVA, while smaller and loss-making, demonstrates strong gross margins and recent positive growth trends in revenue and operating metrics. The fundamentals favor Skyworks in size and margin consistency but highlight CEVA’s improving operational performance despite net losses.
Financial Ratios Comparison
Below is a comparison of key financial ratios for Skyworks Solutions, Inc. and CEVA, Inc. based on the most recent fiscal year data available.
| Ratios | Skyworks Solutions, Inc. (2025) | CEVA, Inc. (2024) |
|---|---|---|
| ROE | 8.29% | -3.30% |
| ROIC | 6.35% | -2.68% |
| P/E | 24.95 | -84.79 |
| P/B | 2.07 | 2.79 |
| Current Ratio | 2.33 | 7.09 |
| Quick Ratio | 1.76 | 7.09 |
| D/E (Debt to Equity) | 0.21 | 0.02 |
| Debt-to-Assets | 15.20% | 1.80% |
| Interest Coverage | 18.45 | 0 |
| Asset Turnover | 0.52 | 0.35 |
| Fixed Asset Turnover | 2.95 | 8.43 |
| Payout Ratio | 90.67% | 0% |
| Dividend Yield | 3.63% | 0% |
Interpretation of the Ratios
Skyworks Solutions, Inc.
Skyworks Solutions displays a balanced profile with half of its key ratios rated favorable, including a strong net margin of 11.67% and good liquidity ratios (current ratio 2.33). While return on equity at 8.29% is marked as unfavorable, other metrics like debt-to-equity (0.21) and interest coverage (20.44) are positive. The dividend yield of 3.63% is favorable, supported by a stable payout and sustainable free cash flow coverage, indicating steady shareholder returns.
CEVA, Inc.
CEVA shows several unfavorable financial ratios, such as a negative net margin of -8.22% and return on equity at -3.3%, reflecting operational challenges. Nevertheless, some ratios like debt-to-equity (0.02) and fixed asset turnover (8.43) are favorable. The company does not pay dividends, likely due to negative earnings and a focus on reinvestment in R&D and growth, which explains the absence of shareholder distributions.
Which one has the best ratios?
Comparing both, Skyworks Solutions presents a stronger overall ratio profile with 50% favorable metrics and a slightly favorable global opinion. CEVA’s metrics reveal significant financial weaknesses and an unfavorable overall rating, with only 36% favorable ratios. Consequently, Skyworks Solutions exhibits more consistent financial health based on the available ratio analysis.
Strategic Positioning
This section compares the strategic positioning of Skyworks Solutions, Inc. and CEVA, Inc. in terms of Market position, Key segments, and Exposure to technological disruption:
Skyworks Solutions, Inc.
- Large market cap of $8.76B, facing semiconductor industry competition.
- Diverse product portfolio including amplifiers, tuners, and modules across multiple industries.
- Develops proprietary semiconductor products; potential exposure to shifts in wireless tech and AI.
CEVA, Inc.
- Smaller market cap of $536M, competing in semiconductor licensing.
- Focused on licensing DSP, AI processors, and wireless platforms for mobile and IoT.
- Licenses wireless connectivity and smart sensing IP, susceptible to rapid tech evolution.
Skyworks Solutions, Inc. vs CEVA, Inc. Positioning
Skyworks pursues a diversified strategy with broad product offerings across many markets, providing scale advantages but facing varied competitive pressures. CEVA adopts a concentrated licensing approach focused on wireless and sensing IP, which may limit scale but allows specialization in innovation and technology licensing.
Which has the best competitive advantage?
Both companies show very unfavorable MOAT evaluations with declining ROIC below WACC, indicating value destruction and weak competitive advantages based on profitability trends over recent years.
Stock Comparison
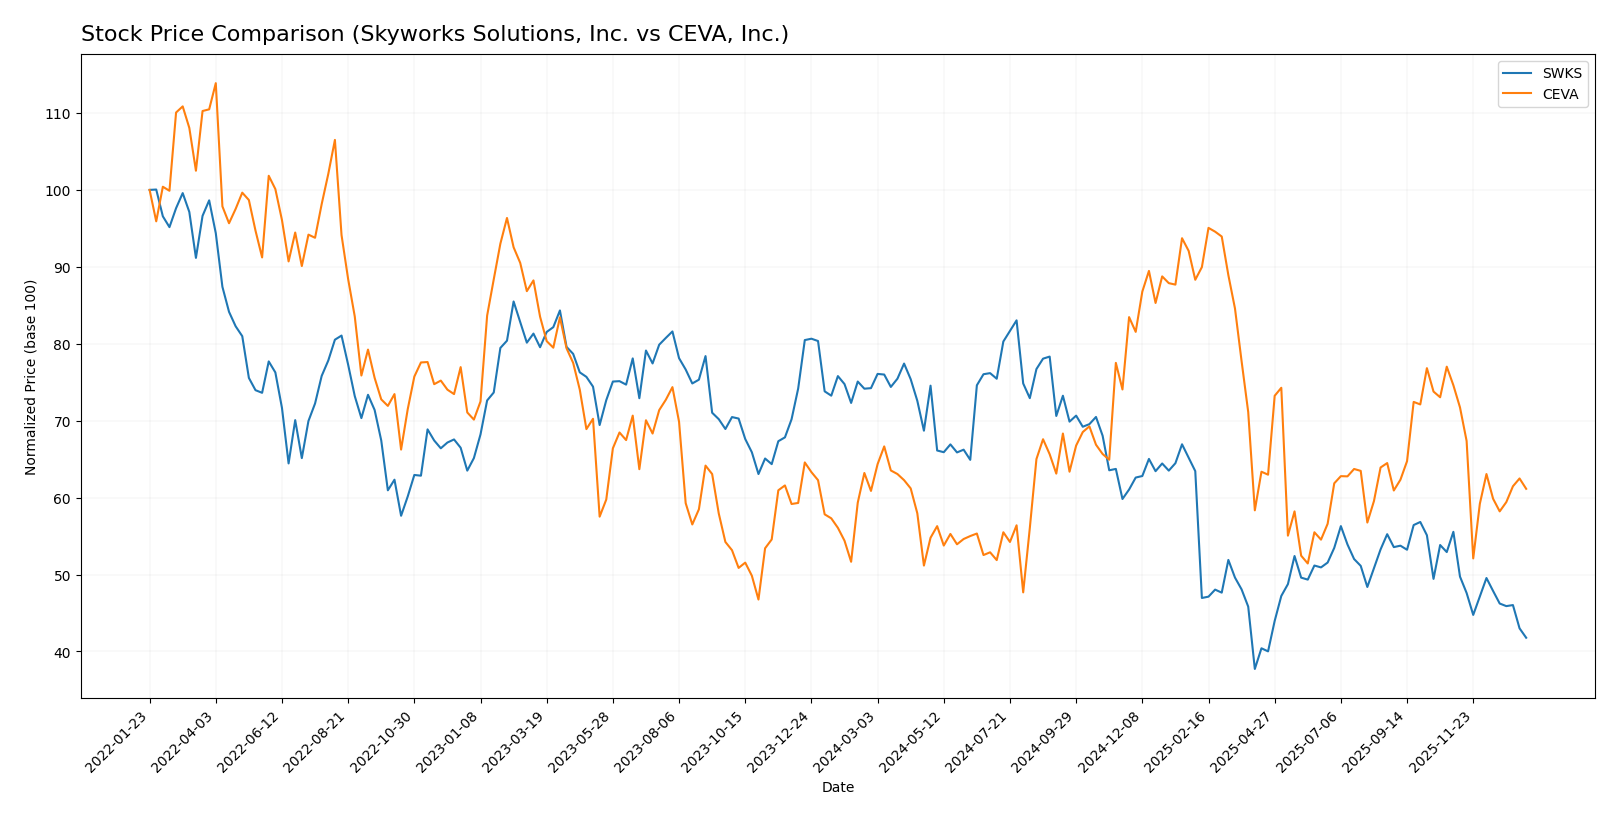
The stock price movements of Skyworks Solutions, Inc. and CEVA, Inc. over the past 12 months reveal contrasting trends, with significant declines for Skyworks and marginal gains for CEVA, alongside evolving trading dynamics.
Trend Analysis
Skyworks Solutions, Inc. experienced a bearish trend over the past year with a price decline of 43.71%, showing deceleration and high volatility (std deviation 16.35). The stock peaked at 116.18 and bottomed at 52.78.
CEVA, Inc. showed a slight bullish trend with a 0.45% price increase over the same period, but with deceleration and lower volatility (std deviation 4.4). The price ranged from a low of 17.39 to a high of 34.67.
Comparing the two, CEVA delivered the highest market performance with a marginal positive return, whereas Skyworks showed a significant loss, indicating stronger resilience in CEVA’s stock price.
Target Prices
Here is the current consensus on target prices from verified analysts for these semiconductor companies:
| Company | Target High | Target Low | Consensus |
|---|---|---|---|
| Skyworks Solutions, Inc. | 140 | 60 | 85.11 |
| CEVA, Inc. | 28 | 28 | 28 |
Analysts expect Skyworks Solutions to trade moderately above its current price of 58.46 USD, indicating potential upside. CEVA’s consensus target of 28 USD also suggests a notable increase from its current 22.30 USD price.
Analyst Opinions Comparison
This section compares analysts’ ratings and grades for Skyworks Solutions, Inc. (SWKS) and CEVA, Inc. (CEVA):
Rating Comparison
SWKS Rating
- Rating: B+, categorized as Very Favorable by analysts.
- Discounted Cash Flow Score: 4, indicating a Favorable valuation based on future cash flows.
- ROE Score: 3, showing Moderate efficiency in generating profit from equity.
- ROA Score: 4, Favorable effectiveness in asset utilization.
- Debt To Equity Score: 3, Moderate financial risk with balanced debt levels.
- Overall Score: 3, assessed as Moderate overall financial standing.
CEVA Rating
- Rating: C+, also considered Very Favorable overall.
- Discounted Cash Flow Score: 3, indicating a Moderate valuation on future cash flows.
- ROE Score: 1, reflecting Very Unfavorable profit generation from equity.
- ROA Score: 1, Very Unfavorable use of assets to generate earnings.
- Debt To Equity Score: 4, Favorable financial stability with low debt reliance.
- Overall Score: 2, Moderate but lower overall financial standing than SWKS.
Which one is the best rated?
Based strictly on the provided data, SWKS holds a higher rating of B+ compared to CEVA’s C+. SWKS also has superior scores in discounted cash flow, ROE, ROA, and overall standing, while CEVA scores better only in debt to equity.
Scores Comparison
Here is a comparison of the Altman Z-Score and Piotroski Score for both companies:
SWKS Scores
- Altman Z-Score: 4.44, indicating a safe zone with low bankruptcy risk.
- Piotroski Score: 7, classified as strong financial health.
CEVA Scores
- Altman Z-Score: 9.99, also in the safe zone, indicating very low bankruptcy risk.
- Piotroski Score: 4, considered average financial health.
Which company has the best scores?
CEVA has a higher Altman Z-Score, placing it well within the safe zone, indicating lower bankruptcy risk. However, SWKS shows a stronger Piotroski Score, suggesting better overall financial strength. The scores reflect different strengths depending on the metric used.
Grades Comparison
The following presents a comparison of recent grades and rating trends for Skyworks Solutions, Inc. and CEVA, Inc.:
Skyworks Solutions, Inc. Grades
This table summarizes the latest grades and rating actions from reputable financial institutions for Skyworks Solutions, Inc.:
| Grading Company | Action | New Grade | Date |
|---|---|---|---|
| Mizuho | Upgrade | Neutral | 2025-11-11 |
| JP Morgan | Maintain | Neutral | 2025-11-05 |
| UBS | Maintain | Neutral | 2025-11-05 |
| Citigroup | Upgrade | Neutral | 2025-10-29 |
| Benchmark | Maintain | Hold | 2025-10-29 |
| Piper Sandler | Upgrade | Overweight | 2025-10-29 |
| Barclays | Upgrade | Equal Weight | 2025-10-29 |
| Keybanc | Upgrade | Overweight | 2025-10-29 |
| UBS | Maintain | Neutral | 2025-10-29 |
| Citigroup | Maintain | Sell | 2025-08-06 |
Skyworks Solutions shows a pattern of upgrades from underperform or sell ratings toward neutral and overweight, indicating a cautiously positive outlook among analysts.
CEVA, Inc. Grades
This table summarizes the latest grades and rating actions from reputable financial institutions for CEVA, Inc.:
| Grading Company | Action | New Grade | Date |
|---|---|---|---|
| Barclays | Maintain | Overweight | 2025-11-12 |
| Rosenblatt | Maintain | Buy | 2025-11-11 |
| Rosenblatt | Maintain | Buy | 2025-08-14 |
| Oppenheimer | Maintain | Outperform | 2025-05-09 |
| Rosenblatt | Maintain | Buy | 2025-05-08 |
| Barclays | Maintain | Overweight | 2025-05-08 |
| Rosenblatt | Maintain | Buy | 2025-04-23 |
| Barclays | Maintain | Overweight | 2025-02-14 |
| Rosenblatt | Maintain | Buy | 2025-02-14 |
| Rosenblatt | Maintain | Buy | 2025-02-11 |
CEVA, Inc. maintains consistently positive ratings with multiple buy and overweight grades, reflecting strong analyst confidence over several months.
Which company has the best grades?
CEVA, Inc. has consistently received stronger and more stable buy and overweight grades compared to Skyworks Solutions, Inc., which shows more neutral and mixed ratings. This pattern suggests CEVA might be viewed as having better growth or value prospects by analysts, potentially impacting investor sentiment accordingly.
Strengths and Weaknesses
The table below summarizes key strengths and weaknesses of Skyworks Solutions, Inc. (SWKS) and CEVA, Inc. based on their latest financial performance, market position, and innovation capabilities.
| Criterion | Skyworks Solutions, Inc. (SWKS) | CEVA, Inc. |
|---|---|---|
| Diversification | Moderate product focus on semiconductors; limited diversification | Primarily licensing and royalties; less diversified revenue streams |
| Profitability | Positive net margin at 11.67%, stable dividend yield of 3.63% | Negative net margin (-8.22%), no dividend yield |
| Innovation | Neutral innovation rating; stable R&D investment | Focus on connectivity and smart sensing IP, but declining profitability |
| Global presence | Established global semiconductor footprint | Growing presence via licensing globally but smaller scale |
| Market Share | Strong position in wireless semiconductor markets | Niche market in DSP and connectivity IP, smaller share |
Skyworks Solutions shows stronger profitability and financial stability with favorable liquidity and dividend returns, despite limited diversification. CEVA faces significant profitability challenges with negative returns and heavy dependence on licensing revenue, indicating higher risk for investors.
Risk Analysis
Below is a comparative table highlighting key risks for Skyworks Solutions, Inc. (SWKS) and CEVA, Inc. (CEVA) based on their most recent data.
| Metric | Skyworks Solutions, Inc. (SWKS) | CEVA, Inc. (CEVA) |
|---|---|---|
| Market Risk | Beta 1.30, moderate volatility | Beta 1.44, higher volatility |
| Debt Level | Low debt-to-equity 0.21, favorable | Very low debt-to-equity 0.02, very favorable |
| Regulatory Risk | Moderate, global semiconductor regulations | Moderate, IP licensing focus with global exposure |
| Operational Risk | Large scale, complex manufacturing | Smaller scale, dependency on licensing revenue |
| Environmental Risk | Moderate, semiconductor production impact | Lower, primarily IP licensing, less direct production |
| Geopolitical Risk | Exposure to Asia-Pacific markets | Exposure through licensees globally |
The most impactful and probable risks differ: Skyworks faces moderate market volatility and supply chain complexities given its manufacturing scale, while CEVA’s key risks lie in profitability challenges with negative margins and dependency on licensing revenues amidst competitive market conditions. Both remain in a safe financial zone, but CEVA’s operational and market risks require cautious monitoring.
Which Stock to Choose?
Skyworks Solutions, Inc. (SWKS) presents a mixed income evolution with declining revenue and net income over 2021-2025, though it maintains favorable net margin and interest expense ratios. Its financial ratios show 50% favorable metrics, low debt, and solid liquidity, while profitability remains moderate. The company’s rating is very favorable with a B+ score, supported by a safe-zone Altman Z-Score and a strong Piotroski score. However, the economic moat evaluation signals value destruction with declining ROIC.
CEVA, Inc. (CEVA) shows favorable income growth in 2024 but overall negative net income trends over 2020-2024, with high gross margin overshadowed by negative profitability ratios. Its financial ratios are mostly unfavorable (57%), despite low leverage and a strong current ratio. The rating stands at C+ with mixed scores, including a safe-zone Altman Z-Score but an average Piotroski score. The company also exhibits a very unfavorable moat status due to declining and negative ROIC compared to WACC.
For investors prioritizing financial stability and a stronger overall rating, Skyworks might appear more favorable despite recent income declines and a weakening moat. Conversely, those focused on companies with recent positive income growth but higher risk might find CEVA’s profile more aligned with their tolerance. Ultimately, the choice could depend on whether an investor prefers established operational metrics or potential growth amid financial challenges.
Disclaimer: Investment carries a risk of loss of initial capital. The past performance is not a reliable indicator of future results. Be sure to understand risks before making an investment decision.
Go Further
I encourage you to read the complete analyses of Skyworks Solutions, Inc. and CEVA, Inc. to enhance your investment decisions: